Fig. 2
Download original image
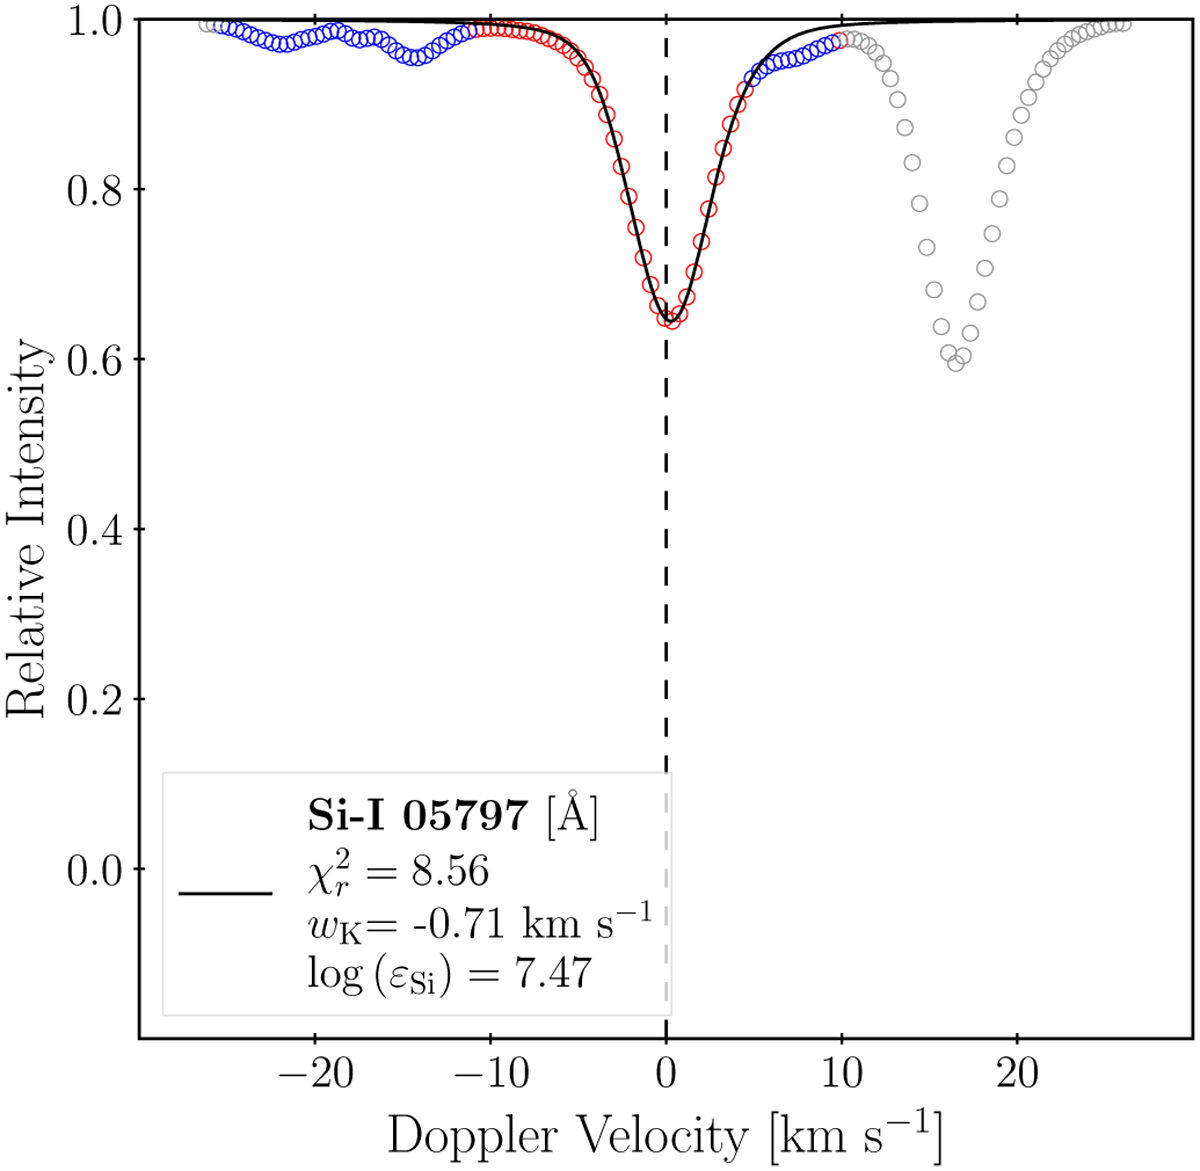
Synthesised fitted line profile (black line) against the observations from the Hamburg atlas (points). Grey points were cut from the initial fit; blue points show areas where the deviation between initial fit and data is too high, and so the subsequent fits do not use the offending points; red points are used for computing all fitted quantities. Removing the points on right hand side removes the strong blend, and sigma-clipping handles weaker ones during fitting. wK is the width of the broadening kernel used. Note that this line is not used in the final determination of the silicon abundance because of the large line blends.
Current usage metrics show cumulative count of Article Views (full-text article views including HTML views, PDF and ePub downloads, according to the available data) and Abstracts Views on Vision4Press platform.
Data correspond to usage on the plateform after 2015. The current usage metrics is available 48-96 hours after online publication and is updated daily on week days.
Initial download of the metrics may take a while.