Fig. 1
Download original image
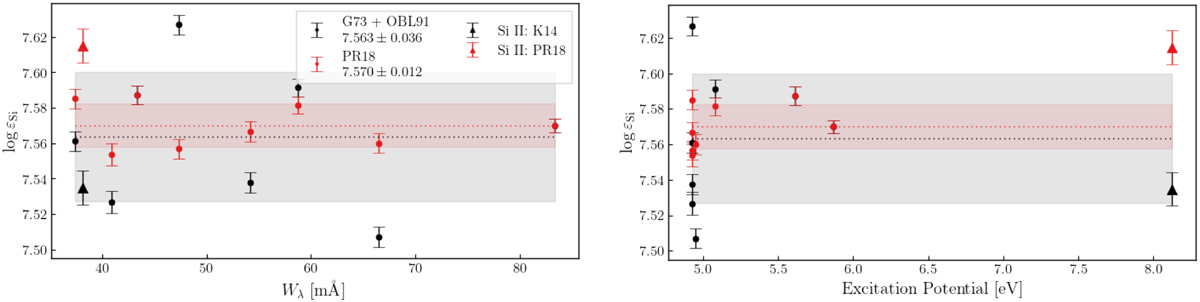
Individual fitted Si abundances for a set of eight Si i lines and one Si ii line as a function of equivalent width (left) and excitation potential (right) for eight Si i lines and one Si ii line. Only the Si i lines are used to determine the mean and RMSE (see definition in Eq. (8)), given in the legend in the left panel. G73+OBL91 indicates oscillator strengths from Garz (1973) normalised according to the results of O’Brian & Lawler (1991a); the oscillator strength for the Si ii line for comparison was taken from Kurucz (2014); PR18 indicates oscillator strengths from Pehlivan Rhodin (2018).
Current usage metrics show cumulative count of Article Views (full-text article views including HTML views, PDF and ePub downloads, according to the available data) and Abstracts Views on Vision4Press platform.
Data correspond to usage on the plateform after 2015. The current usage metrics is available 48-96 hours after online publication and is updated daily on week days.
Initial download of the metrics may take a while.