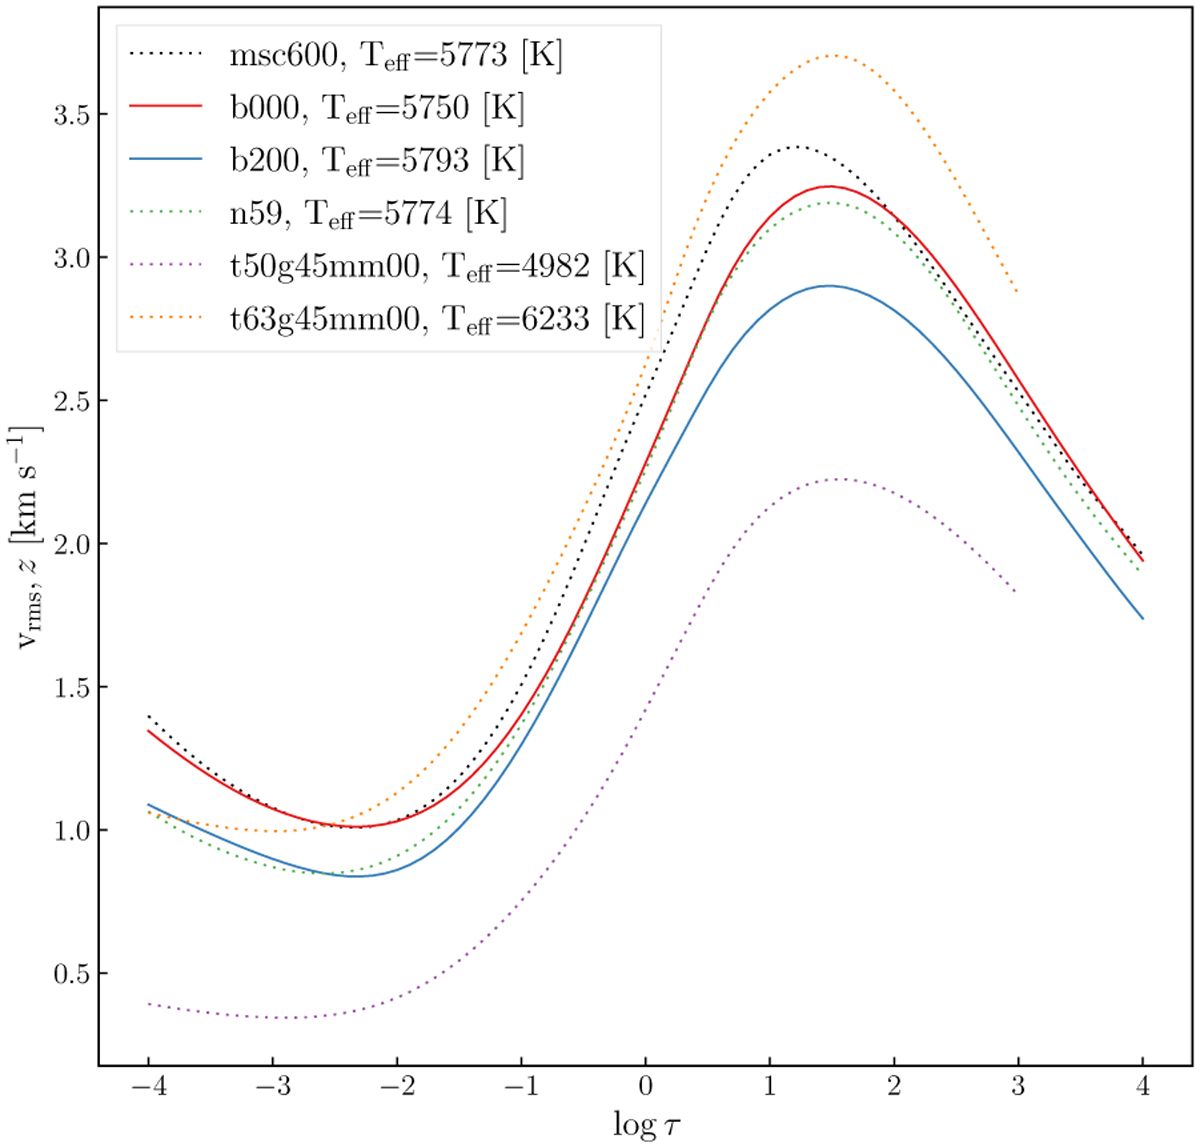
Fig. 6
Download original image
Vertical RMS velocity profiles in and around line-forming regions for the b000, b200 models (solid lines) with the msc600, n59, and 2 other models at much lower and higher effective temperatures shown for comparison (dotted lines). The b200 model clearly has lower RMS velocity than the other solar-type models, even though its effective temperature is higher.
Current usage metrics show cumulative count of Article Views (full-text article views including HTML views, PDF and ePub downloads, according to the available data) and Abstracts Views on Vision4Press platform.
Data correspond to usage on the plateform after 2015. The current usage metrics is available 48-96 hours after online publication and is updated daily on week days.
Initial download of the metrics may take a while.