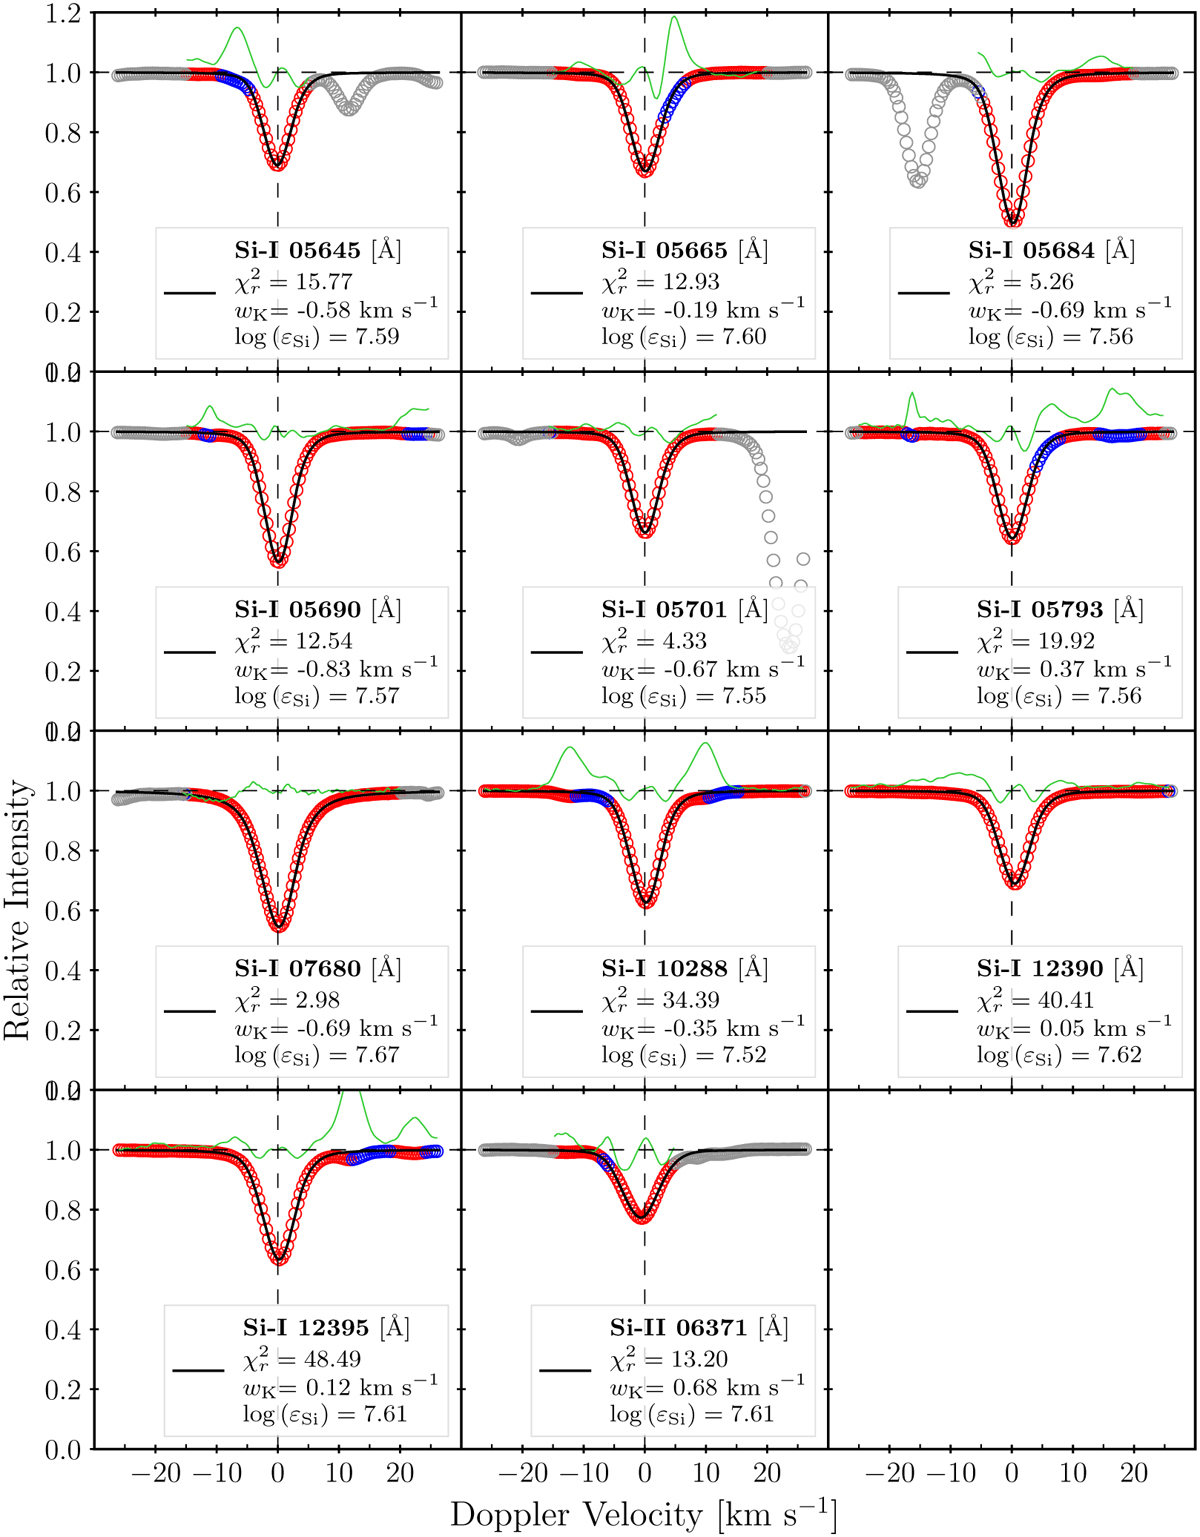
Fig. 4
Download original image
Synthesised fitted line shapes (black solid line) against observations from the Hamburg spectrum (points) for 11 silicon lines for the msc600 model. Grey points were removed before fitting, blue points show areas where sigma-clipping was employed to remove poorly fitting points, and red points were used for determining final fitted quantities. Green lines show the residuals increased by a factor of 10 for readability. In each panel, the name of the line, the reduced χ2 value, the width of the broadening kernel wK, and the LTE abundance log εSi are shown. The final weighted mean abundance of 7.57 ± 0.04 includes the −0.01 dex NLTE correction, a fixed continuum, no pre-broadening, and de-broadening.
Current usage metrics show cumulative count of Article Views (full-text article views including HTML views, PDF and ePub downloads, according to the available data) and Abstracts Views on Vision4Press platform.
Data correspond to usage on the plateform after 2015. The current usage metrics is available 48-96 hours after online publication and is updated daily on week days.
Initial download of the metrics may take a while.