| Issue |
A&A
Volume 664, August 2022
|
|
|---|---|---|
| Article Number | A150 | |
| Number of page(s) | 7 | |
| Section | Interstellar and circumstellar matter | |
| DOI | https://doi.org/10.1051/0004-6361/202244090 | |
| Published online | 24 August 2022 | |
Cosmic-ray-induced H2 line emission
Astrochemical modeling and implications for JWST observations
1
I. Physikalisches Institut, Universität zu Köln,
Zülpicher Straße 77,
50937
Köln, Germany
e-mail: This email address is being protected from spambots. You need JavaScript enabled to view it.
2
Center of Planetary Systems Habitability, The University of Texas at Austin,
Austin, TX, USA
3
Department of Astronomy, University of Maryland,
College Park, MD
20742, USA
4
Department of Physics, Aristotle University of Thessaloniki,
54124
Thessaloniki, Greece
5
INAF – Osservatorio Astrofisico di Arcetri,
Largo E. Fermi 5,
50125
Firenze, Italy
Received:
23
May
2022
Accepted:
26
June
2022
Abstract
Context. It has been proposed that H2 near-infrared lines may be excited by cosmic rays and thus allow for a determination of the cosmic-ray ionization rate in dense gas. One-dimensional models show that measuring both the H2 gas column density and H2 line intensity enables a constraint on the cosmic-ray ionization rate as well as on the spectral slope of low-energy cosmic-ray protons in the interstellar medium.
Aims. We aim to investigate the impact of certain assumptions regarding the H2 chemical models and interstellar medium density distributions on the emission of cosmic-ray-induced H2 emission lines. This is of particular importance for utilizing observations of these lines with the James Webb Space Telescope to constrain the cosmic-ray ionization rate.
Methods. We compare the predicted emission from cosmic-ray-induced, rovibrationally excited H2 emission lines for different one-and three-dimensional models with varying assumptions regarding the gas chemistry and density distribution.
Results. We find that the model predictions of the H2 line intensities for the (1-0)S(0), (1-0)Q(2), (1-0)O(2), and (1-0)O(4) transitions at 2.22, 2.41, 2.63, and 3.00 μm, respectively, are relatively independent of the astro-chemical model and the gas density distribution when compared against the H2 column density, making them robust tracers of the cosmic-ray ionization rate.
Conclusions. We recommend the use of rovibrational H2 line emission in combination with estimations of the cloud’s H2 column density to constrain the ionization rate and the spectrum of low-energy cosmic rays.
Key words: cosmic rays / ISM: lines and bands / infrared: ISM / molecular processes
© B. A. L. Gaches et al. 2022
 Open Access article, published by EDP Sciences, under the terms of the Creative Commons Attribution License (https://creativecommons.org/licenses/by/4.0), which permits unrestricted use, distribution, and reproduction in any medium, provided the original work is properly cited.
This article is published in open access under the Subscribe-to-Open model. This email address is being protected from spambots. You need JavaScript enabled to view it. to support open access publication.
1. Introduction
Low-energy cosmic rays (LECRs), with energies of less than 1 GeV, play a significant role in driving the thermochemistry of the molecular interstellar medium (ISM; Dalgarno 2006; Indriolo & McCall 2013). In regions shielded from ultraviolet (UV) radiation, LECRs are the dominant source of ionization. The ionization they provide drives a rich ion-neutral chemistry, leading to the formation of many astronomically important molecules, as well as the initiation of deuteration (Bayet et al. 2011; Caselli & Ceccarelli 2012; Indriolo & McCall 2013; Bialy & Sternberg 2015; Grenier et al. 2015). Further, LECRs provide an important source of heating and, through the ionization fraction, regulate the impact of nonideal magnetohydrodynamic (MHD) effects such as ambipolar diffusion (Padovani et al. 2020).
Determining the flux of LECRs irradiating molecular clouds is a difficult endeavor. There have been a number of investigations using a range of molecular lines (e.g., Caselli et al. 1998; van der Tak & van Dishoeck 2000; McCall et al. 2002, 2003; Hezareh et al. 2008; Shaw et al. 2008; Ceccarelli et al. 2011, 2014; Hollenbach et al. 2012; Indriolo & McCall 2012; Podio et al. 2014; Vaupré et al. 2014; Cleeves et al. 2015; Indriolo et al. 2015, Indriolo et al. 2018; Le Petit et al. 2016; Fontani et al. 2017; Neufeld & Wolfire 2017; Favre et al. 2018; Bacalla et al. 2019; Barger & Garrod 2020; Bovino et al. 2020; Redaelli et al. 2021) and gas temperature (e.g., Ivlev et al. 2019) to estimate the cosmic-ray ionization rate (CRIR), denoted here as ζ. In diffuse gas, absorption studies of simple molecular ions probe the CRIR. However, dense gas measurements typically rely on astrochemical modeling and thus are prone to a number of degeneracies, in particular the treatment of the CRIR (Gaches et al. 2019).
Recently, Bialy (2020, hereafter B20) proposed a novel method to estimate the LECR flux using H2 rovibrational line emission. As the primary cosmic-ray (CR) protons penetrate into the cloud, they produce a population of secondary electrons that efficiently excite the rovibrational transitions of H2 (especially of the first vibrational state, v = 1), resulting in H2 line emission in the near-infrared (NIR). As shown by Bialy et al. (2022) and Padovani et al. (2022, hereafter P22), observations of H2 rovibrational lines may be used to constrain the spectrum of LECRs that is prevailing in the ISM.
The H2 lines of interest are shown in Table 1, between 2.22 and 3 μm The James Webb Space Telescope (JWST) will be able to observe these lines with the Near InfraRed Spectrograph (NIRSPEC) instrument simultaneously. The unprecedented observations will enable JWST to determine the CRIR in dense molecular gas, where absorption measurements are difficult. As such, exploring how different model assumptions impact the line predictions is crucial.
The aforementioned previous calculations assumed a fully molecular one-dimensional slab that enabled parameter-space predictions of the H2 line intensity as a function of the observed H2 column density, Nobs. These calculations assumed fully molecular clouds and did not include the effects of far-ultraviolet (FUV) photodissociation and an inhomogeneous density structure, which result in regions in the cloud that are partially atomic. In addition, as previous models are one-dimensional, they assume that the observed column density along the line of sight (LOS) and the effective column density that attenuates CRs as they penetrate into the cloud are identical. In an inhomogeneous three-dimensional cloud, CRs can penetrate from different directions, along “rays” passing through different density profiles (not only along the direction of the LOS), resulting in strong fluctuations in the local CR ionization and excitation rate. Therefore, the role of density structure and the chemical evolution model (e.g., equilibrium versus nonequilibrium) should be constrained as they will impact the conversion of the local quantity (induced H2 emission) to an integrated quantity (observed H2 line intensity).
In this paper, we present synthetic H2 line emission (two-dimensional plane-of-the-sky) maps of a realistic molecular cloud irradiated by an interstellar CR proton spectrum. We use the three-dimensional astrochemical models presented in Gaches et al. (2022), which include a prescription for CR attenuation and self-consistently formed molecular clouds from the SILCC-Zoom project (Seifried et al. 2017) and the CR excitation rates computed in P22.
H2 transitions and physical constants.
2. Methods
We modeled a molecular cloud that is impacted by a flux of CRs and calculated the resulting H2 rovibrational excitation and the consequent NIR line emission from the cloud.
2.1. Incident CR flux
For the CRs that are impinging on the cloud surface, we assumed the interstellar CR proton spectrum from Padovani et al. (2018), with a low-energy spectral slope of α = −0.8; this is the “ℋ model,” which provides a good agreement with observations of the CRIR in diffuse clouds.
2.2. CR attenuation
As the CRs penetrate into the cloud, they lose energy through ionization, dissociation, and excitation. We account for this attenuation process by adopting the depth-dependent CRIR, ζ(Neff), from Table F.1 of Padovani et al. (2018), as well as the depth-dependent H2 excitation rate, ζex(Neff), from P22 (see their Figs. 5 and 6 and also Fig. 3 in Bialy et al. 2022). Hereafter, we consider a set of cloud models, including one-dimensional slab geometry models and three-dimensional models based on hydro simulations of turbulent clouds, as summarized in Table 2. For our one-dimensional models, Neff(z) = µN′(z), where  ndz′ is the column density from cloud edge to the point of interest at depth z inside the cloud, and μ = cos(θ) is the cosine angle of the B-field lines with the cloud normal. We adopted μ = 1. In our three-dimensional models, we utilized the effective column density by accumulating the column along Healpix rays (Górski et al. 2005),
 (1)
(1)
for Nℓ = 12 rays at the Healpix ℓ = 0 level of refinement.
Physical and chemical models.
2.3. Density structure
To explore the effect of the cloud structure on the resulting H2 line emission, we considered five models with different density distributions and chemical properties, as summarized in Table 2.
Models 1–3 are one-dimensional slabs. Models 1 and 2 assume a constant density, of n = 10 and 103 cm−3, respectively. Model 3 has a variable density profile in which the density and column density at each point in the cloud are related through
![Mathematical equation: ${N_{{\rm{eff}}}}\left( z \right) = 8.05 \times {10^{19}}\exp \,\left[ {1.6\,{{\left( {{n \over {{\rm{c}}{{\rm{m}}^{ - 3}}}}} \right)}^{0.12}}} \right]\,{\rm{c}}{{\rm{m}}^{{\rm{ - 2}}}}.$](/articles/aa/full_html/2022/08/aa44090-22/aa44090-22-eq3.png) (2)
(2)
This relies on the empirical AV–n relation found by Bisbas et al. (2019) and Bisbas et al. (in prep.) based on a series of turbulent ISM box simulations and galaxy disk simulations. For the densities significant for our results, this relationship accurately reproduces the average densities as a function of effective column density (see Fig. 5 of Gaches et al. 2022). This relationship is for a solar-metallicity gas and can change with metallicity (Hu et al. 2021). Appendix A provides additional details on the one-dimensional astrochemical models.
We also used two three-dimensional density distributions (Models 4 and 5). Model 4 uses the density distribution and astrochemical model from Gaches et al. (2022), which was also previously used in Bisbas et al. (2021). This cloud (called a “dense” cloud) is a subregion from the larger-scale simulations of Wu et al. (2017). It is located in a cube with a uniform resolution of 1123 cells, a side length L = 13.88 pc, total mass Mt0t = 5.9 × 10⁴ M⊙, and mean H-nucleus density 〈n〉 = 640 cm−3 (see Wu et al. 2017 and Bisbas et al. 2021 for more details). Model 5 is a molecular cloud from the MHD SILCC-Zoom simulations (Seifried et al. 2017, Seifried et al. 2020). These simulations model zoomed-in regions of the stratified disk SILCC (SImulating the LifeCycle of molecular Clouds) simulations (Walch et al. 2015; Girichidis et al. 2016) with the initial Galactic-scale magnetic field set to 3 µG and use the Flash 4.3 MHD code (Fryxell et al. 2000). The SILCC-Zoom MHD cloud is located in a cube with a side length of L ≈ 125 pc and a total mass of Mtot = 2.13 × 10⁵ M⊙.
2.4. Astrochemical models
For Models 1–4, the chemistry is computed with a modified version of the public astrochemistry code 3d-pdr (Bisbas et al. 2012; Gaches et al. 2022). We used a reduced network derived from the UMIST 20121 chemical network database (McElroy et al. 2013) consisting of 33 species and 330 reactions. The chemistry was then evolved to steady state using an integration time of 10 Myr. Models 1–3 use an external FUV radiation field of G0 = 1 (normalized to the spectral shape of Habing 1968) to minimize the impact of photochemistry, and Model 4 uses G0 = 10 to be consistent with previous studies (Bisbas et al. 2021; Gaches et al. 2022).
Model 5 uses nonequilibrium chemistry with a network of seven species (Glover & Mac Low 2007a,b; Glover et al. 2010; Glover & Clark 2012), a constant atomic hydrogen CRIR ζ = 3 × 10⁻¹⁷ s−1, and an external FUV radiation field G0 = 1.4. The effective column density is computed and stored during the simulation as described above using the TreeRay/OpticalDepth module (Clark et al. 2012; Walch et al. 2015; Wünsch et al. 2018). Due to the use of a constant CRIR, the chemistry is not entirely self-consistent with our treatment of the excitation rate, as described below. However, the ionization rates we consider are not high enough to greatly impact the H2 abundances. Therefore, our main results will not be significantly altered by this assumption.
2.5. H2 excitation and line emission
In steady state, the flux of secondary electrons becomes independent of the local density (see Ivlev et al. 2021). Thus, we can use the calculation of the excitation rate ζexc,u from P22 for vu = 1, Ju = 0,2. For the “ℋ” CR flux model, the excitation rate varies from 10−15 to 10−16 s−1 between the cloud surface and interior (see Fig. 5 in P22). This calculation uses the CR energy loss function assuming a fully molecular gas. In practice, the loss function should account for a mix of atomic and molecular hydrogen; however, as we show in the appendix, this has a marginal impact on our results for Nobs > 1021 cm−2 (see Fig. A.1).
Given ζexc,u, the emissivity for a specific H2 line is
 (3)
(3)
where αul is the probability that the excitation of state (vu, Ju) will be followed by radiative decay to state (v1, J1) Eul is the transition energy, and n(H2) is the H2 number density. The αul factor does not include collisional quenching as the densities we consider lie below the critical density (e.g., ncrit ≈ 1011 cm−3 at 100 K; Bialy 2020). Our models assume H2 is entirely in the para state, which is applicable for the dense regions we are primarily concerned with (Flower et al. 2006, see our Appendix A for an exploration of the impact of a different ortho-to-para ratio).
The LOS-integrated line intensity is then
 (4)
(4)
where  is the cumulative column density along the LOS, from the cloud edge to a point inside the cloud (at depth z), L is the cloud size, and σd = 4.5 × 10⁻²³ cm2 is the NIR dust absorption cross section per hydrogen nuclei (B20; Draine 2003). Hereafter, we also define the total column density integrated along the LOS,
  . Similarly, Nobs(H2) is the LOS-integrated column density of H2.
3. Results
Figure 1 shows the line intensity of the denoted H2 line, seen along the z axis, for Models 4 (top) and 5 (bottom). The observed fluctuations in the line intensities correspond to density fluctuations in the cloud, as well as variations in the effective column density. The emission saturates at high column densities due to the obscuration of dust. We note that these clouds formed through different processes: the Model 4 cloud is the product of a cloud-cloud collision, and the Model 5 cloud is likely the result of supernova shells interacting and contains structures on larger length scales, and thus also more diffuse gas.
Figure 2 shows the line intensities as a function of the total integrated column of hydrogen nuclei, Nobs, for our three-dimensional models (Models 4 and 5) and the Neff–n one-dimensional model (Model 3). We find that these models rapidly diverge for Nobs < 1022 cm−2. The divergence is caused by the substantial differences in the H–H2 chemical structure. In particular, Model 5 is more diffuse than Model 4, and while both Models 3 and 5 evolve the chemistry to steady state, Model 4 evolves the chemistry with a nonequilibrium solver. As such, the models exhibit different H2 abundance distributions, driving the divergence at low column densities.
The impact of different H2 abundance distributions can be factored out by comparing the H2 line intensity versus the H2 column density. Figure 3 shows the logarithmic column-density bin-averaged line intensity as a function of Nobs(H2) to investigate whether the differences in chemistry evolution, and thus the abundance profiles, are a dominant factor. We find that now the agreement between Models 3, 4, and 5 is strong. We also compare our results to the P22 model (solid curve), which assumes a constant-density, purely molecular slab. Despite the different treatments of the chemistry and density distributions in the various models, there is a good agreement on the line intensity as a function of Nobs(H2). We also show the observational upper limits from B20, which are consistent with the various models presented.
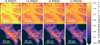 |
Fig. 1 Line-of-sight line intensities of the 3d-pdr model (top; Model 4) and the SILCC-Zoom MHD cloud (bottom; Model 5) for the four different H2 lines in Table 1. |
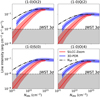 |
Fig. 2 Logarithmic column-density bin-averaged line intensities versus the total H-nucleus column density, Nobs, for the H2 lines in Table 1. The blue and red lines correspond to Models 4 and 5, respectively, with the filled regions representing ±2σ. The dashed-dot black line shows the results for Model 3. The shadowed region shows the JWST sensitivity with a signal-to-noise ratio of 3 with 1.25 h of integration and 50 shutters (P22). |
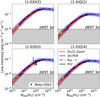 |
Fig. 3 Same as Fig. 2 but plotted against the LOS H2 column density, Nobs(H2). The solid black line corresponds to the calculation in P22. Black triangles show the observational upper limits on the (1-0)S(0) line from Bialy et al. (2022). |
4. Conclusions
The results presented in this paper demonstrate that the assumptions regarding geometry, chemical evolution, and density distribution do not play a significant role when the H2 column density is used along with the H2 emission lines for constraining the CRIR. However, if the H2 column density is not constrained, and the total hydrogen column density, Nobs, is used instead, then the various models diverge in their prediction of the H2 line intensity, especially at low columns, Nobs < 1022 cm−2. This is because the various models assume different density distributions and chemical evolution, which result in different H-H2 abundances.
There are a few chemical effects not included in this study that will be investigated in future work. First, we focused here primarily on the role of CRs. However, X-rays can also excite the H2 lines through secondary electrons produced by X-ray ionizations, in a similar manner as CRs. Second, the H2 excitation rate and emission assume the H2 is primarily in the para-H2 state. However, at low column densities, particularly in regions with enhanced radiation, this assumption may begin to break down (Flower et al. 2006). As a result, at low column densities, there may be variations in the H2 line depending on the ortho-to-para ratio (OPR) and whether or not state-specific chemistry is included (see Appendix A for a model using an approximate treatment of the OPR). Third, we have neglected additional H2 excitation processes, such as FUV photo-excitation at the cloud envelopes and H2 formation pumping. As shown in B20 (see their Fig. 1 and Eqs. (10) and (11)), this assumption is valid for clouds sufficiently high in CRIRs or low in FUV irradiation. A comprehensive three-dimensional model that includes these additional H2 excitation mechanisms will be presented in a future work.
To summarize, we have presented synthetic CR-induced H2 line emission maps of four key emission lines (Table 1) for two simulated three-dimensional molecular clouds and several one-dimensional models. These lines are of particular importance: B20 and P22 predicted that they trace the CRIR in dense gas and can be simultaneously observed using NIRSPEC on the JWST. We find that the H2 line intensity as a function of the H2 column density is relatively insensitive to the assumed density distribution or chemical model. Due to this insensitivity, we recommend the use of the H2 lines in Table 1 for constraining the CRIR in dense gas, in particular when using the JWST.
Acknowledgements.
B.A.L.G., D.S., and S.W. acknowledge support by the Deutsche Forschungsgemeinschaft (DFG) via the Collaborative Research Center SFB 956 “Conditions and Impact of Star Formation”. T.G.B. acknowledges support from Deutsche Forschungsgemeinschaft (DFG) grant no. 424563772. S.B. acknowledges support from the Center for Theory and Computations (CTC) at the University of Maryland. The following Python packages were utilized: NumPy (Harris et al. 2020), SciPy (Virtanen et al. 2020), Matplotlib (Hunter 2007), cmocean. This research has made use of NASA’s Astrophysics Data System.
Appendix A One-dimensional astrochemical models
We used three different density distributions: constant n = 10, 103 cm−3 and one following the Neff − n relation of Eq. (2). Cosmic-ray attenuation is included following the prescription given in Gaches et al. (2022), where the hydrogen nucleus column density, Neff, is equated with the attenuating column and the ionization rate follows the polynomial fit of the ℋ model from Padovani et al. (2018), as described above.
Figure A.1 shows the hydrogen nucleus number density and H2 abundance, x(H2) ≡ n(H2)/n, as a function of hydrogen nucleus column density, Neff. The models exhibit a transition from predominantly atomic H to molecular H2, gas with increasing column density, as the photodissociating FUV radiation is absorbed in the H2 lines and in the dust (for n = 103 cm−3, this transition occurs at small columns, beyond the x-axis lower limit), (Sternberg et al. 2014; Bialy & Sternberg 2016; Bialy et al. 2017).
Figure A.2 shows that, as a function of the total hydrogen column density, the line intensity shows significant variation between the models. Figure A.3 shows the line flux as a function of the H2 column density for the one-dimensional astrochemical models and exhibits far less variation. The constant-density model with n = 103 cm−3 is fully molecular and matches the P22 predictions best, which assumed a fixed H2 abundance, x(H2) = 0.5. The Neff − n model line intensities are dimmer than the n = 10 cm−3 model at low column densities due to the lower H2 abundances in this limit. As functions of the H2 column den
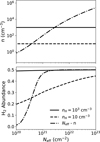 |
Fig. A.1 Total gas density (top) and H2 abundance (bottom) versus total hydrogen nucleus column density, Neff, for three different one-dimensional 3d-pdr models. |
sity, all one-dimensional models are in agreement to within an order of magnitude and are consistent with the Bialy et al. (2022) upper limits.
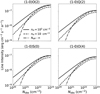 |
Fig. A.2 Same as Fig. A.3 but plotted against the total observed column density, Nobs. |
In our fiducial models, we assume a metallicity of Z = 1.0Z⊙ and that the H2 is entirely in the para-H2 spin state. We ran an additional set of four models using the Neff – n density distribution. Three models used different metallicities, Z = 0.1Z⊙, Z = 0.5Z⊙, and Z = 2.0Z⊙, and the fourth used Z = 1.0Z⊙ but assumed the H2 OPR is in thermal equilibrium (Flower et al. 2006),
 (A.1)
(A.1)
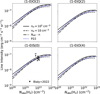 |
Fig. A.3 Line intensity as a function of H2 column density for the four H2 lines considered in this work. The dotted blue line corresponds to the calculation in P22. Black triangles show the upper limits on the (1-0)S(0) line from Bialy et al. (2022). |
where Tg is the gas temperature computed by 3D-PDR. The OPR ratio is applied in post-processing when computing the H2 emission since 3D-PDR does not include spin chemistry. This relationship deviates from the expected asymptotic OPR of 3 at high temperatures, but the gas we consider is generally cool (T < 100 K), and this relationship still produces an OPR of less than 3. However, the use of this approximation will provide a first indication of the importance of the OPR in determining these line intensities. The H2 line emissivity is then modified as
 (A.2)
(A.2)
The dust opacity and H2 formation rates are linearly scaled with metallicity. Further, the metallicity impacts the heating and cooling due to the changes in the abundances of metals and dust.
Figure A.4 shows the H2 line intensities versus H2 column density for these four different models along with the fiducial Neff – n model. At low H2 column densities, there is little deviation, although the “thermal OPR” model shows a slight decrease in line intensity at low column densities (and thus higher temperatures) due to H2 also being in the ortho-H2 spin state. At high column densities, the line intensities asymptote to different values due to lower (higher) metallicities and have their τd = 1 surface deeper (shallower) in the clouds.
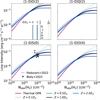 |
Fig. A.4 Same as Fig. A.3 but plotting the Neff – n model for different metallicities and a model using an OPR in thermal equilibrium. The vertical lines in the top-left plot denote the H2 column density where e−τd = 0.5. |
References
- Bacalla, X. L., Linnartz, H., Cox, N. L. J., et al. 2019, A&A, 622, A31 [EDP Sciences] [Google Scholar]
- Barger, C. J., & Garrod, R. T. 2020, ApJ, 888, 38 [Google Scholar]
- Bayet, E., Williams, D. A., Hartquist, T.W., & Viti, S. 2011, MNRAS, 414, 1583 [NASA ADS] [CrossRef] [Google Scholar]
- Bialy, S. 2020, Commun. Phys., 3, 32 [NASA ADS] [CrossRef] [Google Scholar]
- Bialy, S., & Sternberg, A. 2015, MNRAS, 450, 4424 [NASA ADS] [CrossRef] [Google Scholar]
- Bialy, S., & Sternberg, A. 2016, ApJ, 822, 83 [NASA ADS] [CrossRef] [Google Scholar]
- Bialy, S., Burkhart, B., & Sternberg, A. 2017, ApJ, 843, 92 [NASA ADS] [CrossRef] [Google Scholar]
- Bialy, S., Belli, S., & Padovani, M. 2022, A&A, 658, A13 [Google Scholar]
- Bisbas, T. G., Bell, T. A., Viti, S., Yates, J., & Barlow, M. J. 2012, MNRAS, 427, 2100 [NASA ADS] [CrossRef] [Google Scholar]
- Bisbas, T.G., Schruba, A., & van Dishoeck, E.F. 2019, MNRAS, 485, 3097 [NASA ADS] [Google Scholar]
- Bisbas, T. G., Tan, J. C., & Tanaka, K. E. I. 2021, MNRAS, 502, 2701 [CrossRef] [Google Scholar]
- Bovino, S., Ferrada-Chamorro, S., Lupi, A., Schleicher, D. R. G., & Caselli, P. 2020, MNRAS, 495, L7 [Google Scholar]
- Caselli, P., & Ceccarelli, C. 2012, A&ARv, 20, 56 [Google Scholar]
- Caselli, P., Walmsley, C. M., Terzieva, R., & Herbst, E. 1998, ApJ, 499, 234 [Google Scholar]
- Ceccarelli, C., Hily-Blant, P., Montmerle, T., et al. 2011, ApJ, 740, L4 [NASA ADS] [CrossRef] [Google Scholar]
- Ceccarelli, C., Dominik, C., López-Sepulcre, A., et al. 2014, ApJ, 790, L1 [Google Scholar]
- Clark, P. C., Glover, S. C. O., & Klessen, R. S. 2012, MNRAS, 420, 745 [NASA ADS] [CrossRef] [Google Scholar]
- Cleeves, L. I., Bergin, E. A., Qi, C., Adams, F. C., & Öberg, K. I. 2015, ApJ, 799, 204 [CrossRef] [Google Scholar]
- Dalgarno, A. 2006, Proc. Natl. Acad. Sci. U.S.A., 103, 12269 [NASA ADS] [CrossRef] [Google Scholar]
- Draine, B. T. 2003, ARA&A, 41, 241 [NASA ADS] [CrossRef] [Google Scholar]
- Favre, C., Ceccarelli, C., López-Sepulcre, A., et al. 2018, ApJ, 859, 136 [Google Scholar]
- Flower, D. R., Pineau Des Forêts, G., & Walmsley, C.M. 2006, A&A, 449, 621 [NASA ADS] [CrossRef] [EDP Sciences] [Google Scholar]
- Fontani, F., Ceccarelli, C., Favre, C., et al. 2017, A&A, 605, A57 [NASA ADS] [CrossRef] [EDP Sciences] [Google Scholar]
- Fryxell, B., Olson, K., Ricker, P., et al. 2000, ApJS, 131, 273 [Google Scholar]
- Gaches, B. A. L., Offner, S. S. R., & Bisbas, T. G. 2019, ApJ, 878, 105 [NASA ADS] [CrossRef] [Google Scholar]
- Gaches, B. A. L., Bisbas, T.G., & Bialy, S. 2022, A&A, 658, A151 [CrossRef] [EDP Sciences] [Google Scholar]
- Girichidis, P., Walch, S., Naab, T., et al. 2016, MNRAS, 456, 3432 [NASA ADS] [CrossRef] [Google Scholar]
- Glover, S. C. O., & Clark, P. C. 2012, MNRAS, 421, 116 [NASA ADS] [Google Scholar]
- Glover, S. C. O., & Mac Low, M.-M. 2007a, ApJS, 169, 239 [NASA ADS] [CrossRef] [Google Scholar]
- Glover, S. C. O., & Mac Low, M.-M. 2007b, ApJ, 659, 1317 [NASA ADS] [CrossRef] [Google Scholar]
- Glover, S. C. O., Federrath, C., Mac Low, M. M., & Klessen, R. S. 2010, MNRAS, 404, 2 [Google Scholar]
- Górski, K. M., Hivon, E., Banday, A. J., et al. 2005, ApJ, 622, 759 [Google Scholar]
- Grenier, I. A., Black, J. H., & Strong, A. W. 2015, ARA&A, 53, 199 [Google Scholar]
- Habing, H. J. 1968, Bull. Astron. Inst. Netherlands, 19, 421 [Google Scholar]
- Harris, C. R., Millman, K. J., van der Walt, S.J., et al. 2020, Nature, 585, 357 [NASA ADS] [CrossRef] [Google Scholar]
- Hezareh, T., Houde, M., McCoey, C., Vastel, C., & Peng, R. 2008, ApJ, 684, 1221 [NASA ADS] [CrossRef] [Google Scholar]
- Hollenbach, D., Kaufman, M. J., Neufeld, D., Wolfire, M., & Goicoechea, J. R. 2012, ApJ, 754, 105 [Google Scholar]
- Hu, C.-Y., Sternberg, A., & van Dishoeck, E. F. 2021, ApJ, 920, 44 [NASA ADS] [CrossRef] [Google Scholar]
- Hunter, J. D. 2007, Comput. Sci. Eng., 9, 90 [NASA ADS] [CrossRef] [Google Scholar]
- Indriolo, N., & McCall, B. J. 2012, ApJ, 745, 91 [NASA ADS] [CrossRef] [Google Scholar]
- Indriolo, N., & McCall, B. J. 2013, Chem. Soc. Rev., 42, 7763 [NASA ADS] [CrossRef] [Google Scholar]
- Indriolo, N., Neufeld, D. A., Gerin, M., et al. 2015, ApJ, 800, 40 [NASA ADS] [CrossRef] [Google Scholar]
- Indriolo, N., Bergin, E. A., Falgarone, E., et al. 2018, ApJ, 865, 127 [NASA ADS] [CrossRef] [Google Scholar]
- Ivlev, A. V., Silsbee, K., Sipilä, O., & Caselli, P. 2019, ApJ, 884, 176 [Google Scholar]
- Ivlev, A. V., Silsbee, K., Padovani, M., & Galli, D. 2021, ApJ, 909, 107 [NASA ADS] [CrossRef] [Google Scholar]
- Le Petit, F., Ruaud, M., Bron, E., et al. 2016, A&A, 585, A105 [NASA ADS] [CrossRef] [EDP Sciences] [Google Scholar]
- McCall, B. J., Hinkle, K. H., Geballe, T.R., et al. 2002, ApJ, 567, 391 [NASA ADS] [CrossRef] [Google Scholar]
- McCall, B. J., Huneycutt, A. J., Saykally, R. J., et al. 2003, Nature, 422, 500 [CrossRef] [Google Scholar]
- McElroy, D., Walsh, C., Markwick, A. J., et al. 2013, A&A, 550, A36 [NASA ADS] [CrossRef] [EDP Sciences] [Google Scholar]
- Neufeld, D. A., & Wolfire, M. G. 2017, ApJ, 845, 163 [Google Scholar]
- Padovani, M., Ivlev, A. V., Galli, D., & Caselli, P. 2018, A&A, 614, A111 [NASA ADS] [CrossRef] [EDP Sciences] [Google Scholar]
- Padovani, M., Ivlev, A. V., Galli, D., et al. 2020, Space Sci. Rev., 216, 29 [CrossRef] [Google Scholar]
- Padovani, M., Bialy, S., Galli, D., et al. 2022, A&A, 658, A189 [NASA ADS] [CrossRef] [EDP Sciences] [Google Scholar]
- Podio, L., Lefloch, B., Ceccarelli, C., Codella, C., & Bachiller, R. 2014, A&A, 565, A64 [NASA ADS] [CrossRef] [EDP Sciences] [Google Scholar]
- Redaelli, E., Sipilä, O., Padovani, M., et al. 2021, A&A, 656, A109 [NASA ADS] [CrossRef] [EDP Sciences] [Google Scholar]
- Seifried, D., Walch, S., Girichidis, P., et al. 2017, MNRAS, 472, 4797 [NASA ADS] [CrossRef] [Google Scholar]
- Seifried, D., Haid, S., Walch, S., Borchert, E. M. A., & Bisbas, T. G. 2020, MNRAS, 492, 1465 [NASA ADS] [CrossRef] [Google Scholar]
- Shaw, G., Ferland, G. J., Srianand, R., et al. 2008, ApJ, 675, 405 [NASA ADS] [CrossRef] [Google Scholar]
- Sternberg, A., Le Petit, F., Roueff, E., & Le Bourlot, J. 2014, ApJ, 790, 10 [CrossRef] [Google Scholar]
- van der Tak, F.F.S., & van Dishoeck, E.F. 2000, A&A, 358, L79 [NASA ADS] [Google Scholar]
- Vaupré, S., Hily-Blant, P., Ceccarelli, C., et al. 2014, A&A, 568, A50 [NASA ADS] [CrossRef] [EDP Sciences] [Google Scholar]
- Virtanen, P., Gommers, R., Oliphant, T. E., et al. 2020, Nature Methods, 17, 261 [CrossRef] [Google Scholar]
- Walch, S., Girichidis, P., Naab, T., et al. 2015, MNRAS, 454, 238 [Google Scholar]
- Wu, B., Tan, J. C., Nakamura, F., et al. 2017, ApJ, 835, 137 [NASA ADS] [CrossRef] [Google Scholar]
- Wünsch, R., Walch, S., Dinnbier, F., & Whitworth, A. 2018, MNRAS, 475, 3393 [CrossRef] [Google Scholar]
All Tables
All Figures
|
Fig. 1 Line-of-sight line intensities of the 3d-pdr model (top; Model 4) and the SILCC-Zoom MHD cloud (bottom; Model 5) for the four different H2 lines in Table 1. |
| In the text | |
|
Fig. 2 Logarithmic column-density bin-averaged line intensities versus the total H-nucleus column density, Nobs, for the H2 lines in Table 1. The blue and red lines correspond to Models 4 and 5, respectively, with the filled regions representing ±2σ. The dashed-dot black line shows the results for Model 3. The shadowed region shows the JWST sensitivity with a signal-to-noise ratio of 3 with 1.25 h of integration and 50 shutters (P22). |
| In the text | |
|
Fig. 3 Same as Fig. 2 but plotted against the LOS H2 column density, Nobs(H2). The solid black line corresponds to the calculation in P22. Black triangles show the observational upper limits on the (1-0)S(0) line from Bialy et al. (2022). |
| In the text | |
|
Fig. A.1 Total gas density (top) and H2 abundance (bottom) versus total hydrogen nucleus column density, Neff, for three different one-dimensional 3d-pdr models. |
| In the text | |
|
Fig. A.2 Same as Fig. A.3 but plotted against the total observed column density, Nobs. |
| In the text | |
|
Fig. A.3 Line intensity as a function of H2 column density for the four H2 lines considered in this work. The dotted blue line corresponds to the calculation in P22. Black triangles show the upper limits on the (1-0)S(0) line from Bialy et al. (2022). |
| In the text | |
|
Fig. A.4 Same as Fig. A.3 but plotting the Neff – n model for different metallicities and a model using an OPR in thermal equilibrium. The vertical lines in the top-left plot denote the H2 column density where e−τd = 0.5. |
| In the text | |
Current usage metrics show cumulative count of Article Views (full-text article views including HTML views, PDF and ePub downloads, according to the available data) and Abstracts Views on Vision4Press platform.
Data correspond to usage on the plateform after 2015. The current usage metrics is available 48-96 hours after online publication and is updated daily on week days.
Initial download of the metrics may take a while.