Open Access
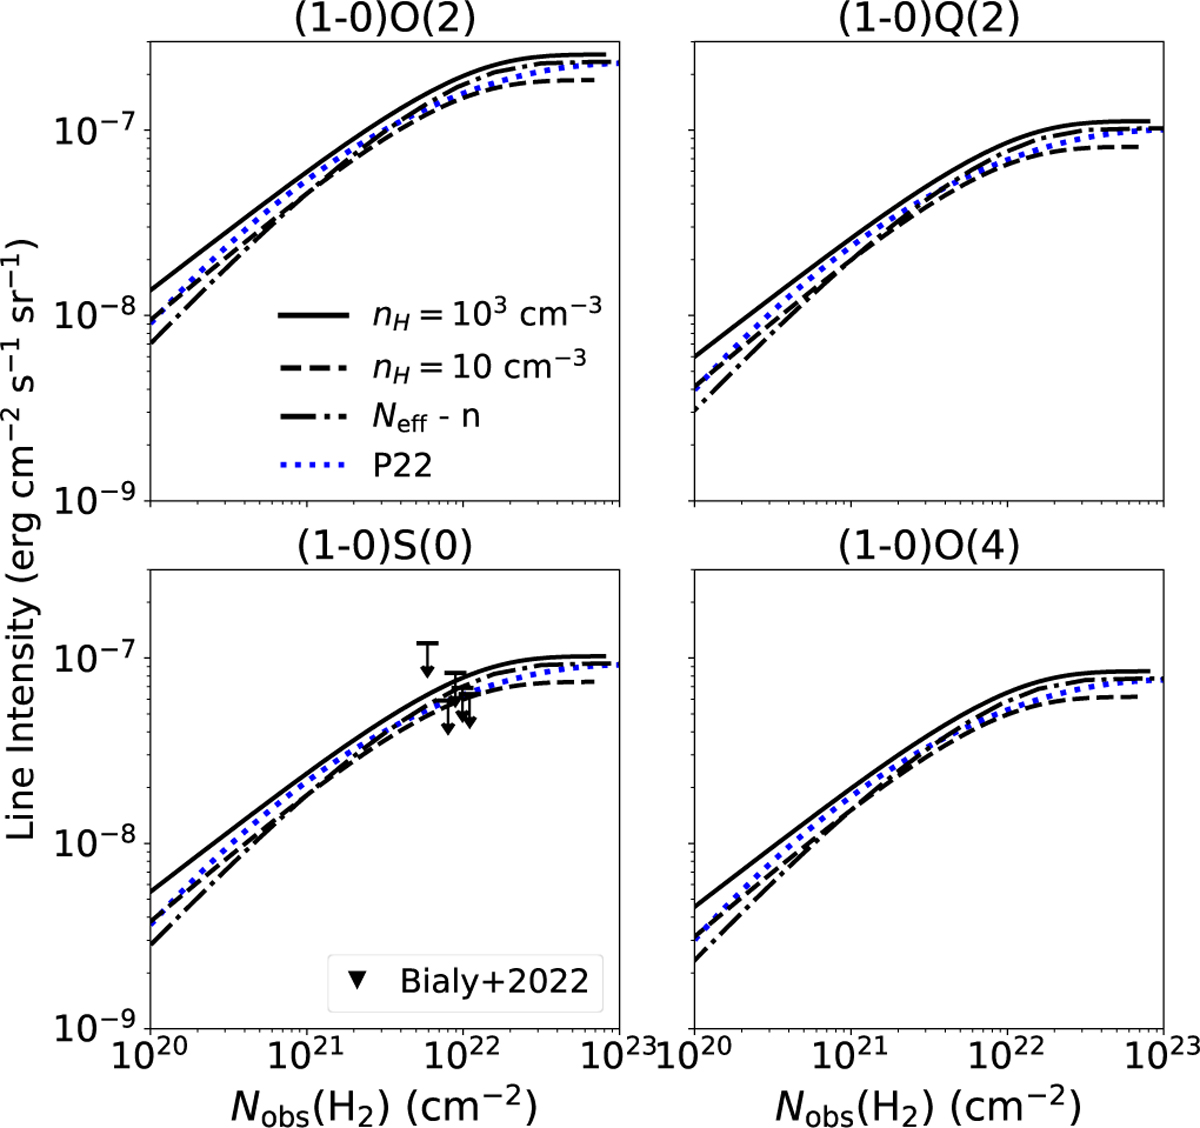
Fig. A.3
Download original image
Line intensity as a function of H2 column density for the four H2 lines considered in this work. The dotted blue line corresponds to the calculation in P22. Black triangles show the upper limits on the (1-0)S(0) line from Bialy et al. (2022).
Current usage metrics show cumulative count of Article Views (full-text article views including HTML views, PDF and ePub downloads, according to the available data) and Abstracts Views on Vision4Press platform.
Data correspond to usage on the plateform after 2015. The current usage metrics is available 48-96 hours after online publication and is updated daily on week days.
Initial download of the metrics may take a while.