Fig. 2
Download original image
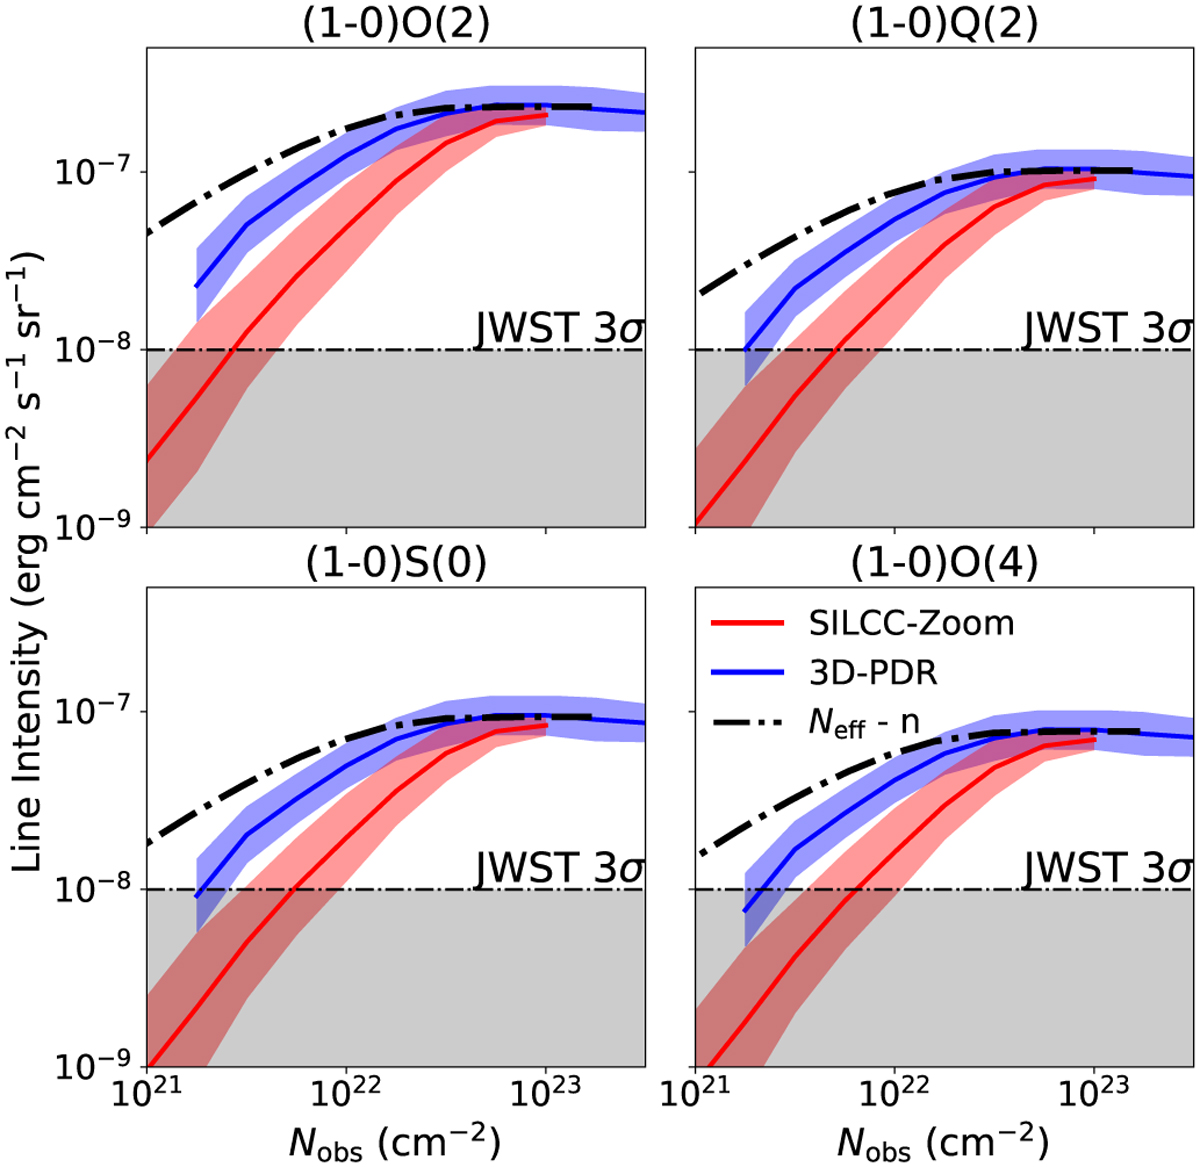
Logarithmic column-density bin-averaged line intensities versus the total H-nucleus column density, Nobs, for the H2 lines in Table 1. The blue and red lines correspond to Models 4 and 5, respectively, with the filled regions representing ±2σ. The dashed-dot black line shows the results for Model 3. The shadowed region shows the JWST sensitivity with a signal-to-noise ratio of 3 with 1.25 h of integration and 50 shutters (P22).
Current usage metrics show cumulative count of Article Views (full-text article views including HTML views, PDF and ePub downloads, according to the available data) and Abstracts Views on Vision4Press platform.
Data correspond to usage on the plateform after 2015. The current usage metrics is available 48-96 hours after online publication and is updated daily on week days.
Initial download of the metrics may take a while.