| Issue |
A&A
Volume 661, May 2022
|
|
|---|---|---|
| Article Number | A121 | |
| Number of page(s) | 18 | |
| Section | Atomic, molecular, and nuclear data | |
| DOI | https://doi.org/10.1051/0004-6361/202142620 | |
| Published online | 24 May 2022 | |
Condensation of cometary silicate dust using an induction thermal plasma system
II. Mg–Fe–Si–O–S system and the effects of sulfur and redox conditions
1
Earth’s Evolution and Environment Course, Department of Mathematics, Physics, and Earth Science, Ehime University,
2-5 Bunkyocho, Matsuyama,
Ehime,
790-8577,
Japan
e-mail: This email address is being protected from spambots. You need JavaScript enabled to view it.
2
Division of Earth and Planetary Sciences, Kyoto University,
Kyoto
606-8502,
Japan
3
Research Organization of Science and Technology, Ritsumeikan University,
Shiga
525-8577,
Japan
4
CAS Key Laboratory of Mineralogy and Metallogeny/Guangdong Provincial Key Laboratory of Mineral Physics and Materials, Guangzhou Institute of Geochemistry, Chinese Academy of Sciences (CAS),
Guangzhou
510640,
PR China
5
CAS Center for Excellence in Deep Earth Science,
Guangzhou
510640,
PR China
6
Department of Chemical Engineering, Wonkwang University,
460 Iksan-daero,
Iksan
54538,
Republic of Korea
7
Department of Earth and Planetary Science, The University of Tokyo,
Tokyo
113-0033,
Japan
8
JEOL Ltd.,
Tokyo
196-8558,
Japan
Received:
9
November
2021
Accepted:
4
February
2022
Abstract
Glass with embedded metal and sulfides (GEMS), the major components of chondritic-porous interplanetary dust particles (CP-IDPs), is one of the most primitive materials in the Solar System and may be analogous to the amorphous silicate dust observed in various astronomical environments. Mineralogical characteristics of GEMS should reflect their formation process and condition. In this study, synthetic experiments in the sulfur-bearing system of Fe–Mg–Si–O–S were performed with a systematic change in redox conditions using thermal plasma systems to reproduce the mineralogy and textures of GEMS. The resulting condensates were composed of amorphous silicates with Fe-bearing nano-inclusions. The Fe content and texture in the amorphous silicates as well as the mineral phases of the nanoparticles correlate with redox conditions. Fe dissolved in the amorphous silicate as FeO in oxidizing conditions formed Fe-metal nanoparticles in intermediate redox conditions, and gupeiite (Fe3 Si) nanoparticles in reducing conditions. In intermediate to reducing redox conditions, Fe-poor amorphous silicate formed a biphasic texture with Mg- and Si-rich regions, indicating liquid immiscibility during the melt phase. Most Fe-metal particles were surrounded by FeS and formed on the surface of amorphous silicate grains. Condensates produced in intermediate to slightly reducing redox conditions resemble GEMS in that they have similar mineral assemblages and chemical compositions to amorphous silicate, except that the Fe-metal grains are absent from the interior of the amorphous silicate grains. This textural difference can be explained by the sulfidation at high temperatures in this study, in contrast to sulfidation occurring at low temperatures in the presence of H2 in natural GEMS formation. Based on the two-liquid structures observed in the experimental products and in GEMS, also recognized in infrared spectra, we propose that GEMS condensed as silicate melt under limited redox conditions followed by incorporation of multiple metal grains into the silicate melt or by aggregation of coreshell structured grains before sulfidation of the metallic iron. Condensates produced in oxidizing conditions are similar to GEMS-like material in the matrices of primitive carbonaceous chondrite meteorites, indicating the possibility that they form by direct condensation from nebula gas in relatively oxidizing conditions compared to GEMS.
Key words: methods: laboratory: solid state / circumstellar matter / infrared: ISM / ISM: lines and bands / infrared: stars
© ESO 2022
1 Introduction
Glass with embedded metal and sulfides (GEMS) is one of the major components of the chondritic-porous interplanetary dust particles (CP-IDPs) that originate in comets (Bradley 1994a,b; Ishii et al. 2008; Keller & Messenger 2011) and are also found in micrometeorites (Noguchi et al. 2015). GEMS have varying chemical compositions, but the mean composition is similar to the CI composition, with some enrichment in Si, and displays the characteristic texture of Mg-Fe amorphous silicates with nanoparticles of Fe-metal and FeS (Bradley 1994a; Keller & Messenger 2011). Fe, Ni-sulfides are present on the surface of the amorphous silicates, while Fe-Ni metals are included inside amorphous silicates (Keller & Messenger 2011; Matsuno et al. 2022). Such texture is thought to be the result of later sulfidation of Fe-Ni-metal grains on the surface of amorphous silicate. GEMS is thought to be one of the most primitive materials in the Solar System. Several formation models for GEMS have been proposed, such as irradiation processing of presolar grains (Bradley & Dai 2004) and condensation in the early solar nebula (Keller & Messenger 2011). Both of these models have been well studied (Bradley 2013; Keller & Messenger 2013), and it has been suggested that GEMS could be key to the origin of the solid materials of the Solar System. GEMS-like materials have also been observed in the matrices of primitive carbonaceous chondrite meteorites (Greshake 1997; Leroux et al. 2015; Nittler et al. 2019; Matsumoto et al. 2019; Ohtaki et al. 2021; Villalon et al. 2021). These GEMS-like materials differ from GEMS in the fact that they are composed of Fe-enriched amorphous silicate, Fe-rich sulfide, and Ni-rich sulfide grains, while Fe-metal grains are rarely included (Nittler et al. 2019). Such GEMS-like materials are considered to have undergone weak aqueous alterations based on the coexistence with regions composed mainly of Fe-rich phyllosilicates (Leroux et al. 2015).
Synthetic experiments based on the condensation model are generally performed using an induction thermal plasma (ITP) furnace to form GEMS analog particles in order to investigate the formation process and possible origins of GEMS (Tanaka et al. 2014; Matsuno et al. 2021; Kim et al. 2021). The ITP system generates a rapid cooling of gas from high temperatures which simulates the environment in which condensation of cosmic dust occurs (Takigawa et al. 2019; Matsuno et al. 2021; Kim et al. 2021). Matsuno et al. (2021) first successfully synthesized textures similar to GEMS, where multiple Fe-metal grains are included in Mg-rich amorphous silicate by using S-free CI and GEMS-mean compositions while systematically changing the redox conditions. Matsuno et al. (2021) illustrated that such GEMS analog materials form by condensation of silicate melt spheres which become amorphous by solidification at low temperatures. This strongly suggests that most of the GEMS grains in CP-IDPs did not form by irradiation processing of the presolar grains (Bradley & Dai 2004) but by direct condensation from gas (Keller & Messenger 2011), a process that may occur in both the Solar System and circumstellar environments. Kim et al. (2021), which forms part I of the present study, also produced textures almost identical to GEMS using a different ITP furnace from Matsuno et al. (2021) with S-free CI composition. In Kim et al. (2021), the condensates similar to GEMS are irregular in shape and these authors found them at a higher frequency in the experimental products compared to Matsuno et al. (2021). Irrespective of the difference, in both experiments using S-free CI composition (Matsuno et al. 2021; Kim et al. 2021), core-shell structure – where a single Fe-metal particle is present in a single amorphous silicate sphere – is most frequently seen, while amorphous silicate with metal particles on the surface is rare. These authors proposed that the GEMS texture most likely formed by incorporation of multiple metal grains into the silicate melt (Matsuno et al. 2021), by aggregation of several core-shell structure grains due to annealing (Kim et al. 2021), or by collision before the solidification of the melt (Matsuno et al. 2021).
In previous studies (Matsuno et al. 2021; Kim et al. 2021), synthetic experiments were only performed in systems without sulfur – one of the major elements in GEMS – because of difficulties with sulfur during the experiments. It was assumed that the outlines of the texture form at temperatures higher than the temperature at which sulfidation occurs, and the resulting textures are comparable to GEMS. However, we do not know how sulfur affects GEMS textures, especially in different redox conditions in connection with the redox states of iron. In this study, we therefore performed synthetic experiments in the S-bearing system of Fe–Mg–Si–O–S, with systematic changes in redox conditions using the same ITP system as in part I (Kim et al. 2021) to better characterize the effect of sulfur and redox conditions during GEMS formation.
2 Methods
2.1 Condensation experiments
In this study, an ITP system (JEOL TP-40020NPS) with a sample feeder (TP-99010FDR) was used at Kyoto University, in the same way as in the condensation experiments performed in Part I (Kim et al. 2021). This system creates a high-temperature plasma (up to 104 K) which evaporates injected starting material and forms nanoparticles through condensation in a rapid cooling environment. The high-frequency power source used an input power of 6 kW, with a chamber pressure of 70 kPa. The plasma-forming gases used were a mixture of Ar and He with flow rates of 301 min-1 and 3 lmin-1, respectively. Two types of plasma flames were used; radial flame and tangential flame. The former is relatively long and slim, made by plasma gas flowing straight down, while the latter is relatively short and wide, made by swirling gas flow. The starting material was injected into a plasma flame in powder form with an Ar-carrier gas at a flow rate of 5 lmin-1. The feeding rate of the starting material was varied in different experimental runs, and ranged from 10 to 300 mg min-1. The feeding rate was obtained by dividing the total weight of the collected product by the run duration. The conditions of individual runs are listed in Table 1. The run products were collected separately from the upper chamber wall, lower chamber wall, and quenching part, which differ in distance from the plasma torch. The details of the ITP experiments are described in Part I (Kim et al. 2021). The plasma parameters used in the experiments presented here were chosen based on the results of Part I, where the optimal conditions for the experiments with the ITP system were determined.
We performed an additional experiment in this study using a direct current plasma (DCP) system in order to compare different plasma systems. In a DCP system, the powder starting material is injected into a plasma flame generated by a direct electric current with a higher temperature (~ 1.5 × 10⁴ K) than the ITP system and a cooling rate about ten times faster than the ITP system. A Techno Serve YC-500TSPT5 plasma torch was used with a SHINKO Electric ME-14C sample feeder at Inha University, Incheon, Korea. The DC power source used an input power of 9.5 kW at 100 A, with a chamber pressure of 101 kPa. The plasma-forming gases used were a mixture of Ar and He with flow rates of 15 lmin-1 and 2.5 lmin-1, respectively. The starting material was injected into the plasma jet with an Ar-carrier gas at 5 lmin-1 and a feeding rate of 100 mg min-1.
The starting material was prepared by mixing several powder reagents at rounded mean GEMS composition in a system of Si– Mg–Fe–S–O; Si:Mg:Fe:S = 1:0.7:0.6:0.3 (Keller & Messenger 2011). We did not add any minor elements such as Al, Ca, or Ni in order to easily evaluate the effect of sulfur. The powder reagents used are as follows: SiO2 (quartz; 4 µm, 99.9% purity, Kojundo Chemical Laboratory Co., Ltd.), Si (metallic silicon; 5 µm, >99.9% purity, Kojundo Chemical Laboratory Co., Ltd.), MgO (periclase; aggregates up to 5–15 µm, 99.9% purity, FUJIFILM Wako Pure Chemical Corporation), Fe (metallic Fe; 3–5 µm, >99.9% purity, Kojundo Chemical Laboratory Co., Ltd.) and FeS2 (pyrite; ground into 3–10 µm by Multi-Beas Shocker, Yasui Kikai Co., 99.8% purity, Sigma Aldrich). Similar to the methods used in Matsuno et al. (2021), several starting materials with different Si-SiO2 ratios were prepared to obtain different redox conditions; SiO2/(Si + SiO2) = 100, 95, 85, 75, 50%. The SiO2/(Si + SiO2) ratio and feeding rate (ƒ) of the starting material are listed in Table 1. The run numbers were named according to the type of plasma flame used (Rad for radial flame and Tan for tangential flame) and the SiO2/(Si + SiO2) ratio. For Rad-75, two runs were performed, with a relatively high feeding rate (Rad-75H) and low feeding rate (Rad-75L). It should be noted that the redox conditions were more oxidizing than expected from the SiO2/(Si + SiO2) ratio alone because additional oxygen entered the chamber, and thus the feeding rate, which determines the sample/ambient gas ratio, also affected the redox conditions as described below. To check the oxygen inflow, an additional experiment using aluminum powder (pure aluminum; 3 µm, 99.9% purity, Kojundo Chemical Laboratory Co., Ltd.) as the starting material – which is easily oxidized by ambient oxygen – was performed under the same run conditions as in the experiments using the mean GEMS composition.
Summary of experimental conditions and TEM analysis results.
2.2 Sample analysis
Run products were analyzed by X-ray diffraction (XRD), Fourier transform infrared spectroscopy (FT-IR), a field-emission scanning electron microscope (FE-SEM), and a field-emission (scanning) transmission electron microscope (FE-TEM/STEM). We mainly examined the samples collected from the lower chamber wall because the condensates tend to be larger in grain size with clearer boundaries than those collected from the upper chamber wall, which makes it easier to obtain the chemical composition of the amorphous silicate, and also because the products collected in the quench part contain a large number of evaporation residues as shown in Part I (Kim et al. 2021).
Powder XRD was obtained from Rigaku Smart Lab at Kyoto University using Ni filtered Cu Kα (λ = 1.5418 Å) radiation at an acceleration voltage of 40 kV and a tube current of 40 mA. Silicon zero-diffraction plates were used as sample holders. The scan range was 4–95 deg in 2θ and the scan step interval was 0.02 deg per step.
For the FT-IR spectroscopy, particles were embedded in a KBr matrix with a mass ratio of 1:200. KBr disks of 5 mm in diameter were prepared for all samples. The infrared (IR) transmission spectra of the pellets in the wavelength range from 400–7500cm-1 (1.3–25.0 µm) were measured with a JASCO MFT-680 at Kyoto University. For comparison, we also obtained IR spectra of quartz, amorphous silica (Takigawa et al. 2019), amorphous enstatite, and amorphous forsterite (Imai 2012).
FE-SEM analysis was performed on a JEOL JSM-7001F equipped with an Oxford Int. X-Max 150 energy dispersive spectrometer (EDS) at 15 kV and 300 pA at Kyoto University. The powder specimen was embedded into a resin and polished in order to observe the textures using SEM. A pressed sample was also prepared using a hydraulic pressing machine (~300 MPa) to make a flat surface with densely packed fluffy condensates on a Cu or Al plate for quantitative elemental analysis using SEM-EDS (Matsuno et al. 2021).
FE-STEM/TEM analysis was performed on a JEOL JEM-2100F with energy dispersive X-ray spectroscopy EDS (JED-2300T, JEOL), at an acceleration voltage of 200 kV at Kyoto University. Fine-grained powder specimens were directly placed onto a TEM grid coated with a carbon film. No solvents were used for the sample mount because the run products, including amorphous silicate nanoparticles, will easily react with solvents, such as water, ethanol, and acetone.
3 Results
3.1 Examination of bulk run products; condensates and evaporation residues (SEM-EDS, XRD, FT-IR)
An SEM analysis shows that run products are mixtures of fine- and coarse-grained materials (Figs. 1a, b), which correspond to condensates and evaporation residues, respectively, as discussed in Part I (Kim et al. 2021). The condensates are made up of grains that are <100 nm in diameter (Figs. 1c, d), the details of which are described in the TEM analysis section. A variety of evaporation residues with different mineral assemblage, size (10–500 µm), and texture were observed. The residue textures can be divided into two types: (1) irregularly shaped and (2) spherical grains (Fig. 1e). Because they have a similar size and texture to the starting materials, the irregular shaped grains can be explained as the remnants of starting materials that did not undergo a significant amount of evaporation or melting. Among the irregular grains (Fig. 1e), periclase is the most abundant, followed by quartz. The spherical grains are melted starting materials that did not become hot enough to evaporate; Fe-metal, FeS, and Fe–Mg–Si–O glasses are the most common in this category, along with the various combinations of coexisting phases (Figs. 1f, j). Tiny FeS blebs are often seen on the surface of the Mg–Fe–Si–O glass (Figs. 1f, g). FeS is also present as spherical grains that contain smaller spherical grains of Fe-metal and Mg–Fe–Si–O glass (Figs. 1h, i). In some Mg–Fe–Si–O glass, small Fe-metal grains are included inside (Fig. 1j). These textures indicate that the relative surface energies are roughly in the following order; Fe-metal > Fe–Mg–Si–O glass > FeS. The evaporation residues are more abundant in tangential plasma experiments than in radial plasma experiments, which is similar to the findings of Kim et al. (2021), and there is no clear correlation with redox conditions. The features of evaporation residues described above were essentially the same for all of the experimental runs in this study.
The chemical analysis of the fine-grained condensate regions, which are mostly uniform throughout the BSE images (Fig. 1), shows that condensates are almost chemically homogeneous in SEM scale for a single run product. The contrasting difference in some fine-grained regions of the BSE images (e.g., Figs. 1b, h, i) is not due to the difference in their chemical composition but the density of the pressed powder sample. The chemical compositions of the fine-grained regions are poorer in Mg and S than the starting material (Fig. 2) mainly because of the abundant periclase residue and probably the loss of moderately volatile S as gas, respectively. The depletion of Mg compared with the starting material is greater in the condensates from the DCP experiment, and is accompanied by a decrease in Fe.
In the XRD pattern, halos at 2θ = 20–40 degrees are derived from amorphous silicate mainly as condensates, and some from the evaporation residues (Fig. 3). Peaks of crystalline phases include phases in the starting materials (iron (Fe), periclase (MgO), and quartz (SiO2)) and newly formed phases, FeS, gupeiite (Fe3Si), and niningerite (MgS). The complete lack of pyrite (FeS2) peaks in the run products suggests that evaporation of sulfur is occurring, although the large spherical FeS grains (Figs. 1h, i) could also indicate that incongruent evaporation of some of the pyrite is forming molten FeS. FeS is troilite and/or pyrrhotite, and these are indistinguishable with XRD analysis. Periclase and quartz are evaporation residues as indicated by the SEM analysis, but iron (α-iron) may also be included in the condensates as shown later, in addition to the residue. Periclase is seen in all experiments while quartz is only seen in the tangential plasma experiments. In each run, the products collected from the quenching part are abundant in evaporation residues compared to those from the upper and lower chamber walls because starting material grains that have escaped from evaporation can easily fall onto the chamber bottom (quenching part) (see Fig. 1 in Part I). There is a tendency for iron and FeS to appear in oxidizing environments, while gupeiite and niningerite usually occur in reducing conditions.
In FT-IR spectra, 10 and ~20 µm bands, which are attributed to the asymmetric stretching and bending vibrations of O–Si–O in amorphous silicate, respectively, are observed in all run products (Fig. 4). In the 10 µm feature, a peak at 9.1 µm occurs that corresponds to amorphous silica or SiO2-rich material (Koike et al. 2013) and the peaks at 9.4–9.9 µm correspond to amorphous Mg–Fe silicates, whose peak position varies by chemical compostion (Mg/Si and Fe/Si) (Dorschner et al. 1995; Jäger et al. 2003). These two peaks were detected in different proportions in different runs. The small peaks at around 6 µm correspond to H2O contamination during sample preparation. The peak characteristic of quartz was not clearly observed in the run products, although a minor amount of quartz was detected in the XRD analysis.
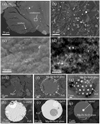 |
Fig. 1 SEM images of condensates and evaporation residues formed during experiments. BSE images of the residue-poor region (a) and residuerich region (b). High-magnification SE image (c) and BSE image (d) of nanoparticle aggregates as condensates, which appeared to be a smooth matrix in low-magnification images. (e) BSE image of MgO residue, which looks similar to the MgO in the starting material. (ƒ–j) BSE images of melted residues with spherical forms. Cross-section (ƒ) and surface image (g) of glass residues with aligned fine-grained FeS on the surface. Cross-section of residues composed of Fe-metal and FeS (h), Fe-metal, FeS and Mg-Fe-Si-O glass (i), and Fe-metal and glass (j). The relative locations of Fe-metal, FeS, and glass (ƒ–j) indicate the wettability relationships among them. |
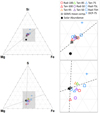 |
Fig. 2 Ternary diagram of the chemical composition of amorphous silicate analyzed by SEM-EDS. Each plot represents the average composition of 10–30 regions (~5 × 5 µm) analyzed within one sample, excluding data points with a composition too far from the average (which is probably due to residues below the surface). |
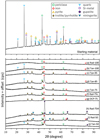 |
Fig. 3 Powder XRD analysis patterns of the experimental products. The pattern of the starting material with a ratio of SiO2:Si = 75:25 is shown at the top for comparison. The patterns of the experimental products are ordered by SiO2:Si ratio. |
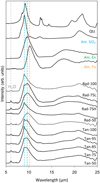 |
Fig. 4 FT-IR spectra of the experimental products. Spectra of quartz (Qtz), and amorphous silicate with SiO2 composition (Am. SiO2), enstatite composition (Am. En), and forsterite composition (Am. Fo) made by the ITP method are also shown for comparison. The maximum peak positions at around 10 µm were at 9.1 µm for Am.SiO2 (blue dashed line), 9.7 µm for Am. En (green dashed line), and 10.1 µm for Am. Fo (orange dashed line), respectively. |
3.2 Examination of condensates (TEM/STEM-EDS)
The condensates were composed of aggregates of spherical amorphous silicates of about 10–100 nm in diameter, with nanoinclusions of metal, sulfides, and/or silicides (Figs. 5 and 6). The mineral assemblage of the nano-inclusions, the textures of the condensates, and the chemical compositions of amorphous silicate varied from one experimental run to another.
Observed nano-inclusions were Fe-metal (Fe; α-iron and γ-iron), FeS, gupeiite (Fe3Si), and niningerite (MgS). These mineral phases were identified by the selected area electron diffraction (SAED) patterns (Fig. 7) and are consistent with the elemental maps (Figs. 5 and 6). FeS can be pyrrhotite, troilite, or both, but it was indistinguishable due to its low and inhomogeneous crystalline nature, unlike the other phases. The phase of Fe-metal coexisting with FeS was also impossible to identify due to overlap in the SAED pattern of FeS. However, some isolated occurrences of the Fe-metal were identified as γ-iron. Iron generally takes the bcc structure (α-iron) as a stable phase at room temperature but fcc structure (γ-iron) was observed in the nanoparticles (Wright 1971; Haneda et al. 1992). From the XRD pattern, α-iron seems to exceed γ-iron in overall abundance, but since evaporation residue is also included in the XRD data, we call them “Fe-metal” in condensates. The sulfides and silicides occur on the surface of amorphous silicate, and can sometimes create a dome-like texture in which a half-sphere is attached on the surface of the amorphous silicate (e.g., Figs. 5c and 6). This indicates that heterogeneous nucleation has occurred, or sulfide (or silicide) melt droplets have attached onto amorphous silicate glass. In contrast, Fe-metal is spherical and located in the interior of amorphous silicate with a relatively small size (<20 nm) (e.g., Type-A particle in Fig. 5c) or attached to the FeS grains on the amorphous silicate surface with a relatively large size (20– 50 nm) (e.g., Fig. 5b). Sometimes, a spherical Fe-metal grain is embedded in a half-sphere grain of FeS (e.g., Type-D particle in Fig. 5c).
The chemical composition of amorphous silicates was measured by avoiding the nano-inclusions as much as possible (Fig. 8). The Mg/Si ratios are in the range from 0 to 0.5, and iron was incorporated into amorphous silicate. The experimental runs are grouped into three categories based on the Fe content of amorphous silicate (Fig. 8, and Table 1): Group 1 (Rad-100, Tan-100, and Tan-95) contains relatively high Fe content (Fe/(Mg + Fe + Si)< ~0.3), Group 2 (Rad-75L, Tan-75, DCP-75, Tan-50) contains intermediate Fe content (Fe/(Mg + Fe + Si)< ~0.05– 0.1), and Group 3 (Tan-85, Rad-75H, Rad-50) contains almost no Fe. The Fe content roughly correlates with the SiO2/(Si + SiO2) ratio of the starting material but does not show strict correlation. The assemblage of the nano-inclusion phases correlates well with Groups 1, 2, and 3; Fe-metal + FeS in Group-1, Fe- metal + FeS or FeS + gupeiite in Group 2, and FeS + gupeiite + niningerite or Fe-metal + FeS + gupeiite in Group 3 (Table 1). Small amounts of sulfur were also contained in the amorphous silicate; up to S/(Mg+Fe+S) ~0.2 (S/Si ~0.17) (Fig. 8). Amorphous silicates in Groups 2 and 3 tend to have higher S contents than Group 1. Amorphous silicates in Groups 2 and 3 often have a texture that has two areas rich in Mg and Si within a single grain (e.g., Type-C particle in Fig. 5a, Type-D particles in Figs. 5b, c). The Mg/Si ratio varies between grains for the Mg-rich areas, which include more or less Fe, while the Si-rich area has an almost pure SiO2 composition. These features are reported in the previous experiments (Matsuno et al. 2021; Kim et al. 2021) and are consistent with the liquid immiscibility that appeared in the FeO–MgO–SiO2 system (Levin et al. 1964) (see also Fig. A.1). This shows that amorphous silicates did not condense directly from gas at low temperatures but silicate melts condensed at high temperatures and were separated into two immiscible liquids at temperatures above the glass transition temperature Tg (~830 K at Mg/Si = 0.67 based on Avramov et al. 2005) during cooling in this experiment.
When we focus on individual grains, condensates can be categorized into five types based on the chemical composition of amorphous silicate, nano-inclusion mineral assemblages, and textures (Table 2, and Fig. 9). The constituent minerals and their texture for each type is as follows; Type-A composed of Fe-rich amorphous silicate with internal Fe-metal nanoparticles, Type-B composed of Fe-rich amorphous silicate with FeS nanoparticles on the surface, Type-C composed of Fe-rich amorphous silicate showing two-liquid immiscibility with FeS nanoparticles on the surface, Type-D composed of Fe-poor amorphous silicate showing two-liquid immiscibility with Fe-metal nanoparticles coexisting with FeS on the surface, and Type-E composed of Fe- poor amorphous silicate showing two-liquid immiscibility with gupeiite (Fe3 Si) nanoparticles coexisting with niningerite (MgS) or FeS on the surface.
The change from Type B to Type E seems to correspond to the change in redox conditions from oxidizing to reducing, while Type A seems to be different from the above trend because Fe- rich silicate coexists with metallic iron, and the metallic iron is present inside the amorphous silicate sphere instead of on the surface. Type A grains were also only observed when using a radial flame plasma. Up to three different types of grains were observed simultaneously in a single run product; Type A, B, and C grains were mainly observed in Group 1 runs, Type D grains mainly in Group 2, and Type E mainly in Group 3 (Table 1). The features of each grain type mostly remained the same among the different runs.
The features of the DCP run product are almost consistent with the ITP run products in terms of Groups and Types, although the grain size of amorphous silicate was smaller (Fig. 6, Table 1). The smaller grain size is due to a faster cooling rate in the DPC system, but the different cooling rate does not appear to affect the other features.
 |
Fig. 5 High-angle annular dark-field (HAADF) images (left row) and X-ray elemental mapping images (middle and right rows) of the representative condensates for each grain type in the ITP experiments. Images in the middle and right rows depict the different elements (Fe, Mg, Si, and S) with different colors (red, green, and blue), with each containing a color legend in the upper right corner. The run numbers are (a) Tan-100, (b) Tan-85, (c) Rad-75L, and (d) Rad-75H from top to bottom. The numbered square regions (from 1 to 4) in the X-ray mapping images correspond to the numbered plots in Fig. 8. |
 |
Fig. 6 High-angle annular dark-field (HAADF) image (left) and X-ray elemental mapping images with Fe in red, Mg in green, and Si in blue (middle) and with Fe in red and S in blue (right) of the representative condensates of DCP-75. |
 |
Fig. 7 TEM BF images and SAED patterns of crystalline nanoparticles in condensates; gupeiite (Fe3Si), niningerite (MgS), γ-iron (Fe), and FeS phase. SAED patterns were taken from the circled region. (a) Type-E grains with gupeiite and niningerite on the amorphous silicate from Rad-75H, shown in Fig. 5d. Gupeiite and niningerite are highly crystalline and show conformity in crystal orientation, which is indexed in the SAED pattern with G and N, respectively. (b) Type-A grain with γ-iron particle in the amorphous silicate from Rad-75L. (c) Type-C grain with FeS particle on the amorphous silicate from Rad-100. The phase of FeS was undistinguishable because of its low crystalline and low continuity nature. |
3.3 Experiment using Al for examining oxygen inflow
An additional experiment was performed to check oxygen inflow into the ITP reactor using metallic Al powder as a starting material and Ar gas as plasma and carrier gas. Despite the absence of oxygen in the starting material, aluminum oxide (γ or δ alumina) was observed as well as metallic aluminum in the run product by XRD. This clearly illustrates the oxygen inflow into the ITP system. The amount of inflow oxygen was estimated from the amount of alumina in the end product and the feeding rate of Al powder, assuming that all the inflow oxygen reacted with the aluminum to form alumina. The proportion of alumina was obtained from the ratio of XRD intensities of the maximum peaks of pure Al and Al oxide using a calibration curve, where reagents of pure Al and y-alumina mixed in different ratios were analyzed. The estimated rate of inflow oxygen was 1.5–3.6 × 10⁻⁴ molmin−1 showing variation by the sample collection area. There are several candidates for the source of oxygen: oxygen as an impurity in the plasma-forming and carrier gases, a leak from outside the system, residual oxygen in the chamber, absorbed water molecules on the fine-grained starting material, and an oxidized surface of metallic Fe used as the starting material. The total possible oxygen inflow rate estimated from the total of the above possible sources is 5×10⁻⁵ molmin−1, which is not largely different from but is smaller than the experimental value, indicating an underestimation and/or the presence of an additional oxygen source not considered.
 |
Fig. 8 Ternary diagrams of the chemical compositions (Si –Mg–Fe on the right and S–Mg–Fe on the left) of amorphous silicates analyzed by STEM–EDS. The experiments were divided into three groups according to their relative Fe abundance; Group1 (Rad–100, Tan–100, Tan–95), Group 2 (Tan–75, Rad– 75L, DCP–75, Tan–50), and Group 3 (Tan–85, Rad–75H, Rad–50). The chemical composition of GEMS-like material (Leroux et al. 2015; Matsumoto et al. 2019) and GEMS in CP-IDPs (Bradley 1988, 1994a,b; Keller & Messenger 2011) and micrometeorites (Noguchi et al. 2015) were plotted in (a) and (b), respectively, according to their resemblance in mineral phase and texture to the experimental products. Also, the data from the numbered square in Fig. 5c (middle) of Rad-75L are plotted in a separate ternary diagram (b) (left) to show the relationship between texture and chemical composition. Each plot is a composition extracted from a STEM-EDS mapping of the condensate. Nano-inclusions were avoided. The shaded area in the Mg–Si–Fe diagram is the two-liquid region calculated from the diagram of Levin et al. (1964). |
Features of each grain type and comparison to natural GEMS.
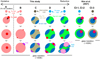 |
Fig. 9 Formation model of the condensates in this study together with those in Part I (Kim et al. 2021). |
4 Discussion
4.1 Formation environments and process of condensates in the present experiments
4.1.1 Heterogeneity of the condensation conditions in the ITP system
The formation of several grain types in a single experimental run indicates that there must be heterogeneity in the evaporation and condensation processes. In the ITP system, starting materials and condensates are transported by down-flowing plasma gas (see Fig.1 of Part I). The plasma flame is effused from the center of the ceiling of the chamber (torch exit), which creates a heterogeneous gas flow that is generally faster in the center and slower in the marginal portions of the chamber. The temperature and velocity distributions of the plasma flame are axisymmetric, and the maximum temperature and velocity are indicated at the center axis; those values rapidly decrease with increasing distance from the center axis (closer to the chamber wall). Therefore, the starting powder material will take different paths along such a heterogeneous gas flow and will therefore evaporate at different temperatures and residence times, forming different gas compositions, and finally condensation will occur at different cooling rates which results in variations of the condensates. This heterogeneity is more pronounced in the radial flame than in the tangential flame, because the plasma does not flow from the center to the outer part of the chamber. In addition to the spatial heterogeneity as discussed above, there might be temporal heterogeneity as well from the feeding rate of the starting material, f, which can affect and change the redox conditions in the ITP chamber as discussed in Sect.4.1.2.
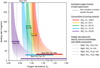 |
Fig. 10 Estimated redox condition for each experiment. The range of oxygen abundance XO (horizontal axis) for each starting material with the same SiO2/(Si + SiO2) ratio is calculated for the estimated inflow oxygen rates of 0.5 × 10⁻⁴ molmin−1 (left edge) and 3.6 × 10⁻⁴ molmin−1 (right edge). The redox condition becomes oxidizing with an increase in XO. Even if the same starting material is used, the redox condition becomes more oxidized with a decrease in feeding rate, which is due to the relatively large contribution of the inflow oxygen. The redox condition (XO) of each run is shown as a bar according to its starting material and feeding rate. The values of XO for specific mineral assemblages expected from the GEMS composition are also shown for comparison. |
4.1.2 Redox conditions in the ITP experiments
The valences of some elements are affected by the redox condition. In oxidizing conditions, iron is present in amorphous silicate as the Fe2+ion because Fe scarcely dissolves into silicate melt or glass as Fe0+. Matsuno et al. (2021) proposed the existence of Fe3+based on the magnetite precipitation in amorphous silicates in the most oxidized run, which is consistent with the bulk chemical composition including oxygen. The absence of magnetite in the present experiment may suggest there is very little Fe3+present. In extremely reducing conditions, Si is present as silicide (gupeiite; Fe3Si) and Mg as sulfide (niningerite; MgS) because there is no available oxygen with which to bond. Therefore, we categorized the condensates according to the Fe content of amorphous silicate and the mineral assemblages of nanoparticles in the run products, as these are the parameters that are most affected by redox conditions. Run Groups 1–3 and Type B–E grains reflect the redox conditions from oxidizing to reducing order, respectively. However, our results illustrate that these run groups and grain types are not strictly correlated with the SiO2/(Si + SiO2) ratio of the starting materials, although a rough correlation exists. Additional oxygen introduced into the ITP system, which we confirmed by the experiment using pure Al, can explain these results. As we used MgO, Si, SiO2, Fe, and FeS2 as the starting materials, Fe silicide (probably Fe3Si) is expected to appear and no FeO is expected to appear in amorphous silicates except in the run with Si (SiO2/(Si + SiO2) = 100) in the starting material. However, Fe silicide was not observed in runs of Rad-75L, Tan-95, and Tan-75, and FeO-bearing amorphous silicates (Type-A, B and C grains) appeared in Rad-75L and Tan-95 (Table1), illustrating the presence of additional oxygen. If the input rate of the additional oxygen remains constant for all of the experiments, then the feeding rate of the starting material should have an influence on the redox conditions.
The total oxygen abundance in each run relative to the oxygen abundance of the oxides used as the starting material (MgO and SiO2), XO, can be calculated from the starting material composition, the feeding rate, f, and the inflow rate of additional oxygen, RO, as follows;
 (1)
(1)
where AO,SM is the oxygen abundance of the starting material and AO is the oxygen abundance of the starting material where all Si is converted to SiO2 (equal to the composition of the starting material in Rad-100 and Tan-100). Thus, we expect materials composed of MgO, SiO2, Fe, and FeS at XO = 1. MgO, SiO2, FeO, Fe, and FeS are expected in oxidizing conditions at XO> 1, while MgO, SiO2, Fe, Fe3Si, FeS ± MgS are expected in more reducing conditions at XO< 1. Figure10 shows the change in XO as a function of f for runs with starting materials with different SiO2/(Si+SiO2) ratios. In this diagram, RO of 0.5–3.6 × 10⁻⁴ molmin−1 was adopted as estimated from the pure Al experiment. The range of XO corresponds to the range of RO, and the XO range is quite large when f is low, as the contribution of additional oxygen is relatively high. Even if the SiO2/(Si + SiO2) ratio of the starting material is constant, XO decreases, or the redox condition becomes reductive, as f increases because the contribution of the additional oxygen becomes relatively low. This can explain the experimental result that the condensates from Rad-75L with lower f are more oxidative than Rad-75H with a higher f. This also explains why the most reducing grains (type-E) appear in Tan-85 with a higher f but do not appear in Tan-75 with a lower f. As our data show in this diagram, runs of Groups 1, 2, and 3−all with different redox conditions−can be explained by the combination of SiO2/(Si+SiO2) ratio and feeding rate, f.
4.1.3 Equilibrium calculation of condensation in the ITP system
Equilibrium calculations of condensation in the ITP system were performed using the HSC Chemistry Software, Outotec Research Oy, in order to evaluate the formation process and the temperature of the mineral phases (and amorphous silicate) in the condensates (Table3, see Appendix A for settings). According to the equilibrium calculation, MgSiO3 and SiO2 occur as major solid phases in all runs. Fe-metal, oxides, sulfides, and silicides appear depending on the redox condition of the system. Mg silicide is present in reducing conditions while Mg sulfate in oxidative conditions. Some phases condense directly from the gas, while FeS, Fe3Si, and MgS form by the reaction of solid phases already condensed at high temperatures (Fe- metal, FeS, MgSiO3) with mainly SiS gas molecules. We note that the formation temperatures of FeS (or Fe0.877S) are 1360–1620 K (Table3), which are much higher than the formation temperature of ~700K (Lauretta et al. 1997) in the early Solar System. Representative reactions for the formation of representative solid phases are shown in Table4. The condensation starts from MgSiO3 at 2230–2490 K and is followed by the Fe-metal condensation at 1770–2040 K if it condenses (Table3).
There were some differences between the phases produced in the calculated run products and our results. In the experiments, it was the silicate melt that condensed instead of the end components of MgSiO3 melt and SiO2 melt (or solid) because silicate melt is not taken into consideration in the calculation. In the oxidized or intermediation runs, the FeO was also incorporated into the silicate melt (Groups-1 and -2 in Fig.8 and Table1) instead of the condensation of Fe oxides and/or silicate in the calculation. Taking these differences into account, the phase assemblage of the run products is almost consistent with the calculations. The presence of Fe in the run products of Rad-100 and Tan-100 is not consistent with the calculation and this may be an error due to the uncertainty of Ro with low f (30 mg min−1) (see Eq. (1)) because the value of Romay not be constant in all the runs. In particular, the run product of Tan-50 with very low f (10 mg min−1) is more reducing (presence of Fe3Si and FeS) than the calculation (Fe oxides and MgSO4), suggesting an overestimation of Ro in this run.
Results of equilibrium calculations using the HSC software for the different runs (Rad-100, Rad-75L, Tan-95, Rad-50).
Representative reactions for the formation of solids in equilibrium, calculated using the HSC software.
4.1.4 Formation model of the condensates and the effect of sulfur
In this section, we propose a model for the formation of grains from Type A to E (Fig.9). In the present experiments, it is reasonable to consider that silicate condenses as melt droplets because the run products are spherical grains of amorphous silicate, with some showing textures formed by liquid immiscibility as also proposed by Matsuno et al. (2021). The two-phase texture is formed by biphasic separation during the melt phase in specific chemical composition as shown in Appendix B. According to the equilibrium calculation (Table3) and the solid formation model by homogeneous nucleation and growth from gas (Yamamoto & Hasegawa 1977), silicate melt condenses prior to Fe-metal, particularly in rapid cooling conditions, which is due to the large surface energy of the metal, because the surface energies of crystalline and amorphous silicates are similar compared with metallic iron. This condensation order is common with the formation process discussed in previous studies (Matsuno et al.2021; Kim et al. 2021). Finally, FeS (and Fe3Si + MgS) forms by the reaction of Fe-metal (and Mg in the silicate melt) with S- bearing gas as shown in reactions (5) to (8) (Table4) depending on the redox conditions.
In oxidizing conditions, the Fe particles are smaller (Types- A, B, and C in Fig.9) than those in reducing conditions (Types D and E) because Fe is depleted in the gas by the dissolution into the melt as FeO before the Fe-metal condenses. In Type A grains, Fe particles are thought to condense on the silicate melt surface at relatively high temperatures and move inside the melt. FeS does not form in Type A grains because Fe-metal particles have already moved into the silicate melt before reaction with sulfur in the surrounding gas, and also because there is no longer enough Fe in the gas for direct condensation of FeS. The remaining sulfur may react with other types of condensate or escape from the furnace as gas molecules without reactions. In contrast, in Types B and C, Fe particles condense on the surface of silicate melt at relatively low temperatures and FeS forms by complete or partial sulfidation. In reducing conditions, Fe is not incorporated into silicate melt and thus Fe is not depleted in the gas by the melt condensation. In Type D grains, relatively large Fe-metal particles condense on the silicate melt surface from the Fe-rich gas and partially sulfidize to form a spherical Fe-metal grain embedded in a half-sphere grain of FeS (Fig.5i). In the most reducing condition for Type E grains, Fe3Si forms together with MgS and/or FeS. Fe3Si and MgS would form by the reactions with SiS(g), similar to the equilibrium calculation (reactions of (7) and (8) in Table4). Liquid immiscibility occurs above the glass transition temperature (~830 K) in Type C, D, and E grains due to the lower Fe and thus relatively high Si content of the silicate melt (Fig.8).
In this study, most Fe-metal particles are present on the surface of the amorphous silicate sphere (Type D) or were once present on the surface before sulfidation (Types B and C), which is clearly different from condensates consisting of Fe metal core and amorphous silicate shell observed in Matsuno et al. (2021) and Kim et al. (2021). Such textural difference is caused by the presence of sulfur. As stated above, as the silicate melt forms prior to Fe particles, the Fe particles condense on the surface of silicate melt through heterogeneous nucleation. The Fe particle is then incorporated into the silicate melt according to the calculation of the balance between the interfacial energies of the Fe grains and the silicate melt surfaces in Matsuno et al. (2021). This is also consistent with the texture observed in a melt droplet as evaporation residue, where a metallic iron particle is located inside an amorphous silicate sphere (Fig.1j). This formation model nicely fits the condensates in Matsuno et al. (2021) and Kim et al. (2021), but not the condensates in the present study. The S-bearing environment in the present experiments causes sulfidation of the Fe-metal grain before its incorporation into the melt, which is due to the formation of FeS at higher temperatures− without H2 gas (1360–1620 K in Table3)−than the formation temperature expected in the early Solar System (700 K). FeS grains formed by the sulfidation of Fe particles can stay on the silicate melt surface because of its low interfacial energy (Halden & Kingery 1955), which is also consistent with the texture of the evaporation residue droplets (Figs.1f and g). In addition, because the sulfur dissolved in Fe-metal and/or silicate melt as the minor element may decrease the interface energy of Fe (Halden & Kingery 1955), the rate at which Fe-metal moves into the silicate melt may be slower than the rate in the S-free system. For type-A, heterogeneous nucleation of the Fe-metal occurs at a higher temperature than the other types, resulting in the Fe-metal moving into the melt before sulfidation can occur. The reason for this difference in timing of Fe-metal nucleation and sulfidation in Type A grains is unclear, but it may be related to the heterogeneity in radial plasma flame, because Type A is only observed in the radial plasma experiments. As discussed above, the present formation model shows that it is important to consider the effect of sulfur, which can affect the variation of Fe- bearing particles and their relative position against amorphous silicate, determining the major texture of the condensates.
4.2 Implications for GEMS and GEMS-like materials
4.2.1 Comparison of IR spectra between experimental products with GEMS
The common 10 µm features of the FT-IR spectra for the run products with peaks at 9.1 µm and around 9.4–9.9 µm, which correspond to SiO2-rich and MgO-FeO-rich amorphous silicates, respectively, (Fig.4) are in agreement with the liquid immiscibility deduced from the two-phase textures (e.g., Fig.5c) and their chemical compositions (e.g., Fig.8) observed with TEM/STEM. Based on the relationship between the peak position and the (Mg + Fe)/Si ratio of the synthetic amorphous silicates (Dorschner et al. 1995), the positions of peaks at ~9.7 µm correspond to the enstatite composition (Fig.4), which is consistent with the TEM-EDS analysis of amorphous silicates. A lack of distinct differences in the IR spectra between the present S-bearing and the former S-free experiments suggests there is little or no effect of sulfur on the peak position. The relative ratio of the two peak heights at 9.1 µm and around 9.4–9.9 µm is a function of the relative abundances of SiO2-rich and MgO-FeO-rich amorphous silicates, and the peak position around 9.4–9.9 µm is probably due to the variation of the chemical composition in the amorphous silicates. We note that these features may be slightly influenced by the presence of MgO–FeO silicate glass in the evaporation residues.
Comparing the IR spectra of the GEMS-rich region in an IDP (simply written as GEMS in Bradley et al. 1999) and condensates in Rad-75L, the shape and position of the main peak of GEMS are similar to those of Rad-75L. In the GEMS spectrum, a weak peak at 9.0 µm can be seen in addition to the main peak at around 9.7 µm. This can be explained by a liquid immiscibility in GEMS, indicating condensation as melt. This additional peak at 9.0 µm is not clearly observed in circumstellar environments and interstellar mediums (Molster et al. 2010). Meanwhile, the peak at 9.0 µm is sometimes found in T Tauri stars (Sargent et al. 2009). This can be explained by the presence of similar condensates to those shown in this study, which are composed of SiO2-rich amorphous silicate and MgO-, FeO-rich amorphous silicate, and may relate to GEMS. These differences may indicate that amorphous silicates in some circumstellar environments did not form via the solidification of two-liquid melts. Alternatively, even if they initially had a two-peak feature, additional condensation of chemically homogenous amorphous silicate on the grain surfaces may change their IR spectra. In the former case, either the bulk chemical composition of silicate melt is out of the two-liquid region, or they formed as solid amorphous silicates by rapid condensation at temperatures below Tɡ. Future astronomical surveys that focus on the multi peaks at 9.0 and ~9.7 µm are desirable to associate GEMS with the astronomical environments.
4.2.2 Comparison of textures between synthetic products with GEMS and GEMS-like materials
Typical GEMS in CP-IDPs have Fe-poor amorphous silicates including many Fe-metal nanoparticles, with FeS on the surface (Keller & Messenger 2011). Type D grains produced in the present experiments are most similar to GEMS among the present run products in terms of mineral assemblage (Fe- metal and FeS) and chemical composition of amorphous silicate, except for the position of Fe-metal grains in amorphous silicate, where Fe-metal grains are absent inside the amorphous silicate of Type D grains. Two-phase separation with SiO2-rich and SiO2-poor compositions in amorphous silicates seems to also be seen in GEMS, which is described as Mg/Si zoning or domains in Keller & Messenger (2011) and is clearly demonstrated by three-dimensional observation of GEMS (Matsuno et al. 2022). The chemical compositions of GEMS (Bradley 1988, 1994a,b; Bradley & Ireland 1996; Keller & Messenger 2011; Noguchi et al. 2015) are more enriched in Fe and S compared to the amorphous silicates in Type D grains (Fig.8, Group 2). This is probably because many nano-inclusions of Fe-Ni and Fe sulfides in GEMS are too small to be avoided during the analysis of amorphous silicate, and only amorphous silicate was analyzed in the run products of this study.
Condensates synthesized under oxidizing conditions in the present experiments are similar to GEMS-like materials in the matrices of primitive carbonaceous chondrites, which include only Fe and Ni sulfides and no or rare metals with relatively Fe-rich amorphous silicate compared to GEMS (Greshake 1997; Leroux et al. 2015; Nittler et al. 2019; Matsumoto et al. 2019; Ohtaki et al. 2021; Villalon et al. 2021). In particular, Fe-rich amorphous silicates with FeS nanoparticles without Fe-metal (Types B and C) are the most consistent with the characteristics of these GEMS-like materials (Leroux et al. 2015; Matsumoto et al. 2019). We cannot compare textural features of the location of the sulfide grains among them, because GEMS-like grains are aggregated and become coherent in the matrix of primitive carbonaceous chondrites. Strictly speaking, the Fe contents of amorphous silicates in the condensates of oxidative runs are lower than GEMS-like materials in the Paris meteorite (Leroux et al. 2015) and much lower than those of the Acfer 094 (Matsumoto et al. 2019). Their differences might be partly due to the fact that their analysis includes some FeS, resulting in compositional variation toward FeS in the Mg-Fe-S diagram in Fig.8a and partly due to aqueous alteration as discussed below.
4.2.3 Formation process of GEMS and GEMS-like materials
The formation process of GEMS and GEMS-like materials can be discussed from the present experiments, although there are some differences in the condensation environment, such as the cooling timescale, the total pressure, and the presence of H2. The scaled conditions for condensation with the different cooling timescales and total pressures are comparable, as discussed below in more detail.
Based on the formation model in this study (Fig.9), typical GEMS should be formed under intermediate to slightly reducing conditions similar to Type C and D. As discussed in Sect.4.1.4, Fe-metal particles are not seen in the amorphous silicates of Type C and D grains, which is due to sulfidation at high temperature. In GEMS formation, Fe-metal particles can be transported into the amorphous silicate before sulfidation because H2 is present. The reason why aggregation of the condensates was not observed in the present study, using the same ITP system as Kim et al. (2021), may be due to the difference in the collection area of the run products. The condensates collected from the upper and lower walls were observed in Kim et al. (2021), where aggregation was frequently seen in condensates from the upper chamber wall, and samples from the lower chamber wall were mainly observed in the present study for ease of chemical analysis of amorphous silicate.
Based on the discussions above, we propose two different GEMS formation models (Fig.11). In the first model (left of Fig.11), multiple Fe-metal particles condense at relatively high temperature on the surface of the amorphous silicate melt droplet, and some of them move inside the melt by the interfacial energy-driven mechanisms (Matsuno et al. 2021). The melt then becomes amorphous at Tɡ (~830K at Mg/Si = 0.67 based on Avramov et al. 2005) and FeS is formed by sulfidation of the Fe-metal on the surface of amorphous silicate at or below the equilibrium temperature of sulfidation (700 K) (Lauretta et al.1997). The abundant condensation of the Fe-metal, which is not seen in our experiments, may be caused by differences in the gas composition, and/or by the difference in the sulfidation temperatures. In the second model (right of Fig.11), a single Fe-metal grain is present inside a single amorphous silicate sphere, and these grains form aggregates and undergo annealing resulting in a single larger grain including multiple Fe-metal grains as proposed by Kim et al. (2021), followed by the formation of FeS on the surface of the large grain. FeS should form after the aggregation, causing sulfides to be present only on the grain surface. This model is consistent with the fact that the size of GEMS is frequently larger than the synthesized condensates. Indeed, some GEMS particles seem to be aggregates of grains based on their TEM images (Keller & Messenger 2011) and 3D textural TEM observation (Matsuno et al. 2022).
The results from this study also indicate the formation of GEMS-like material by condensation from nebula gas as well as GEMS, likely under more highly oxidizing conditions than the GEMS formation. The formation process should be the same as that of the Type B or C grains in this study. It has been proposed in previous studies that such primitive GEMS-like materials would have experienced weak aqueous alteration (Leroux et al. 2015; Matsumoto et al. 2019). During aqueous alteration, metal nanoparticles are (hydro-)oxidized and the matrix becomes rich in Fe (Leroux et al. 2015). In addition to this aqueous alteration, the results of the present study suggest a contribution of the condensation process to the features of GEMS-like materials, such as the Fe-enrichment of amorphous silicate and the absence of metal nanopariticles. Therefore, GEMS-like materials in the matrix would form by condensation under more highly oxidizing conditions than the GEMS formation, be accreted into a parent body, and finally experience week aqueous alteration.
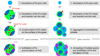 |
Fig. 11 Two possible models of GEMS formation. |
4.2.4 Formation environment of GEMS
Condensation of melts with the liquid immiscibility gap can explain chemical heterogeneities in amorphous silicates in GEMS (Matsuno et al. 2022) and possibly the peak characteristics of the IR spectra of GEMS (Matsuno et al. 2021; Kim et al. 2021). This indicates that the most likely GEMS formation mechanism is by the condensation of gas, that is, compared to the other possibilities, namely recondensation in low-temperature environments (Jones & Nuth 2011) or irradiation of crystalline phases in interstellar regions (Bradley & Dai 2004), which do not provide a suitable explanation for the features seen in the majority of GEMS.
The experimental conditions in the ITP systems and possible GEMS formation environments around young and evolved stars can be scaled by the homogeneous nucleation and growth theory for condensation (Yamamoto & Hasegawa 1977) and compared (Matsuno et al. 2021; Kim et al. 2021). The values of the scaled nondimensional parameter for condensation, A, (Yamamoto & Hasegawa 1977) in ITP systems, where the total pressure is high and cooling timescale is short, are comparable with those of circumstellar environments at low total pressure and large cooling timescales such as around Type II-P supernovae (SNe), in the outflow of asymptotic giant branch (AGB) stars, and in locally heated regions by bow shock in protoplanetary disks, rather than condensation from canonically cooled gases in protoplanetary disks. The same discussions can be applied to this work because the presence of sulfur does not change the scaling parameters, indicating that the possible formation environments are around Type II-P SNe, in the outflow of AGB stars, and in the protosolar disk with local heating as discussed by Matsuno et al. (2021).
Keller & Messenger (2011) reported that most GEMS grains have solar isotopic compositions of oxygen and presolar GEMS grains are rare. If GEMS formed in circumstellar environments around evolved stars, the exchange of oxygen isotopes between gas and dust in the protosolar disk should have erased most of the isotopic anomaly in the presolar amorphous silicates. However, the possible conditions that would allow oxygen isotopic exchange of amorphous silicates with H2O gas without crystallization (Yamamoto et al. 2020) are limited. The similarity seen between the IR spectra of the condensates and some T Tauri stars may also support the solar origin for the majority of GEMS.
5 Conclusion
The effect of sulfur and redox conditions during GEMS formation was examined through condensation experiments from gas in a system containing Mg−Fe−Si−O−S using an induction thermal plasma (ITP) system. The condensed grains are mainly composed of amorphous silicate, and can be categorized into five types (Type A to E) based on Fe content, the existence of liquid immiscibility, and the phase(s) of the nanoparticles with the amorphous silicate, which depend on the redox conditions (Fig.9). In oxidizing conditions, Fe dissolves in amorphous silicate as FeO with FeS nanoparticles. In intermediate conditions, the FeO content in amorphous silicate decreases, and Fe-metal and FeS nanoparticles are present. In reducing conditions, amorphous silicate contains scarce FeO and gupeiite (Fe3Si), and FeS and niningerite (MgS) nanoparticles appear. Textures showing two-liquid immiscibility, which appears in FeO-poor amorphous silicates, show that the amorphous silicate particles condense as melt phase first and are then transferred to amorphous state by rapid cooling. A formation model on the slightly oxidized, intermediate, and slightly-reduced grain types (Types B to D) was proposed after considering the homogeneous nucleation of silicate melt droplets followed by the heterogeneous nucleation of Fe-metal nanoparticles on the silicate melt surface, and reaction of the Fe-metal nanoparticles with S-rich gas (Fig.9).
In the present S-bearing system, most Fe-metal particles are present on the surface of the amorphous silicate sphere (Type D) or were once present on the surface before sulfidation (Types B and C), which is clearly different from condensates consisting of Fe metal core and amorphous silicate shell observed in Matsunoet al. (2021) and Kim et al. (2021). This textural differenceis caused by the formation of FeS from the reaction of Fe-metal with surrounding S-rich gas at relatively high temperature before the Fe-metal grain moves into the melt by an interfacial energy- driven mechanism.
Condensates produced in intermediate to slightly reducing conditions in the present experiments are similar to GEMS in terms of mineral assemblage (Fe-metal and FeS) and chemical composition of amorphous silicate, except for the absence of Fe-metal grains inside the amorphous silicate in the run products. Such textural differences can be explained by the difference in the timing of sulfidation; sulfidation occurs at high temperatures in the experiments (1360–1620 K in Table4) before Fe-metal grains are incorporated into the melt, while it occurs at lower temperature in the Solar System (~700 K) because of the presence of H2, preventing the sulfidation of some Fe grains which have already moved into amorphous silicates. We propose GEMS formation models (Fig.11) based on the condensation model in the present experiments (Fig.9). GEMS is thought to be formed by condensation as silicate melt in the intermediate or slightly reducing conditions of the present experiments, and incorporation of multiple metal grains into the silicate melt or by aggregation of core-shell structured grains before sulfidation of the metallic iron on the surfaces. The present experiments also indicate the possibility of formation of GEMS-like materials in the matrices of primitive carbonaceous chondrite meteorites (Leroux et al. 2015; Matsumoto et al. 2019) by direct condensation from nebula gas in a more highly oxidative environment than that in which GEMS can form. The FeO-rich features of amorphous silicates in the GEMS-like materials might not only be the result of aqueous alteration causing Fe-enrichment of amorphous silicates by oxidation of Fe-metal nanoparticles but also the result of direct condensation in oxidizing conditions.
The results of this study support the formation of GEMS by condensation, similarly to the previous condensation experiments performed by our group (Matsuno et al. 2021; Kim et al. 2021). The condensation environment is comparable to conditions found around Type II-P SNe and AGB stars, and locally heated regions by bow shock in protoplanetary disks, rather than the conditions found in canonically cooled gases in protoplane- tary disks, as proposed by previous studies (Matsuno et al. 2021; Kim et al. 2021). The similarity in the IR spectra between the condensates and some T Tauri stars may support a solar origin for the majority of GEMS.
Acknowledgements
S. Enju, A. Tsuchiyama, T.-H. Kim and J. Matsuno were financially supported by JSPS KAKENHI Grant Number 15H05695. A. Tsuchiyama, and J. Matsuno were also supported by JSPS KAKENHI Grant Number 20H00205. A. Takigawa was supported by the Hakubi Center for Advanced Research at Kyoto University and JSPS KAKENHI Grant Numbers 19H01935 and 19H00712. A. Takigawa was supported by the Hakubi Center for Advanced Research at Kyoto University and JSPS KAKENHI Grant Numbers 19H01935 and 19H00712 and J. Matsuno by JSPS KAKENHI Grant Numbers 13J01031. Thanks are also due to Prof. Hideyuki Yasuda of Kyoto University for his information about the presence of nano-sized γ-iron, Prof. Park Dong- Wha of Inha University for support of the DC plasma experiments, and Masahiro Yasutake of Japan Synchrotron Radiation Research Institute (JASRI/SPring-8) for constructive discussion of the formation model of condensates.
Appendix A Formation of the two-phase texture by liquid immiscibility
Equilibrium calculations of condensation in the ITP system were performed to evaluate the formation process and the temperature of the mineral phases (and amorphous silicate) in the condensates Fig. A1). It should be noted that the reaction is not occurring in complete equilibrium, because the condensation is a rapid process. However, the calculation can be used to understand the outline of the condensation reactions. The calculation was performed by minimizing the Gibbs free energy of the system as a function of temperature at 70 kPa using the HSC Chemistry Software (Outotec Research Oy) —where silicate melt is not taken into consideration— for each experimental condition with an averaged value of RO (2.6 × 10⁻⁴ molmin−1) (Table 3). We note that the equilibrium condensation temperatures, Tin, of the major phases are shown together with the disappearance temperatures, Tout, of some phases. The oxygen partial pressure (log pO2) at Tin(Fe) and the difference in oxygen partial pressure from the iron-wüstite buffer in log units, ΔIW, are also shown in Table 3.
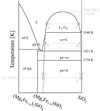 |
Fig. A.1 Schematic phase diagram of the (Mg, Fe)O−SiO2 system. The dashed lines show the metastable extinction curves of the two-liquid boundaries. Tɡ is the glass transition temperature. L: liquid phase; ol, olivine; px, pyroxene; cr, cristobalite; tr, tridymite. |
Appendix B Formation of the two-phase texture by liquid immiscibility
The formation process of the two-phase texture is schematically shown in Fig. B1. After the nucleation, the melt rapidly separates into two chemical compositions, either rich in MgO or SiO2(A and A’, respectively, in Fig B1). Crystallization of any crystalline phases (olivine, pyroxene, and silica phase) does not occur from the melt because of rapid cooling, and the chemical compositions change along the metastable extension (from A, B to C and A’, B’ to C’ in Fig B1). Finally the melt becomes glass around Tɡ and the chemical composition of the amorphous silicate become fixed (C and C’).
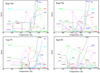 |
Fig. B.1 Proportions of the gas and solid species as a function of temperature, calculated by thermodynamic equilibrium using the HSC software for four different experimental runs with different redox conditions (Rad-100, Rad-75L, Tan-95, Rad-50). The molecular species considered in the calculation are mostly common with Matsuno et al. (2021) with addition with following S bearing species, where (g) denotes gas and (s) denotes solids; S(s), S(g), S2(g), S3(g), S4(g), S5(g), S6(g), S7(g), S8(g), S2O(g), SO(g), SO2(g), SO3(g), SiS(g), SiS(s), SiS2(g), SiS2(s), Fe0.877S(s), FeS(s), FeS(g), FeS2(s), FeSO4(s), Fe2(SO4)3(s), MgS(g), MgS(s),MgSO4(s). The abundance is normalized by the amount of Si in the starting material. |
References
- Avramov, I., Vassilev, T., & Penkov, I. 2005, J. Non-Cryst. Solids, 351, 472 [NASA ADS] [CrossRef] [Google Scholar]
- Bradley, J. 1988, Geochim. Cosmochim. Acta, 52, 889 [NASA ADS] [CrossRef] [Google Scholar]
- Bradley, J. P. 1994a, Science, 265, 925 [Google Scholar]
- Bradley, J. P. 1994b, Geochim. Cosmochim. Acta, 58, 2123 [NASA ADS] [CrossRef] [Google Scholar]
- Bradley, J. P. 2013, Geochim. Cosmochim. Acta, 107, 336 [CrossRef] [Google Scholar]
- Bradley, J., & Dai, Z. 2004, ApJ, 617, 650 [NASA ADS] [CrossRef] [Google Scholar]
- Bradley, J., & Ireland, T. 1996, Phys. Chem. Dyn. Interplanet. Dust, ASP Conf. Ser., 104, 275 [NASA ADS] [Google Scholar]
- Bradley, J. P., Keller, L. P., Snow, T. P., et al. 1999, Science, 285, 1716 [CrossRef] [Google Scholar]
- Dorschner, J., Begemann, B., Henning, T., Jäger, C., & Mutschke, H. 1995, A&A, 300, 503 [NASA ADS] [Google Scholar]
- Greshake, A. 1997, Geochim. Cosmochim. Acta, 61, 437 [NASA ADS] [CrossRef] [Google Scholar]
- Halden, F., & Kingery, W. 1955, Phys. Chem., 59, 557 [CrossRef] [Google Scholar]
- Haneda, K., Zhou, Z. X., Morrish, A. H., Majima, T., & Miyahara, T. 1992, Phys. Rev. B (Condensed Matter), 46, 13832 [NASA ADS] [CrossRef] [Google Scholar]
- Imai, Y. 2012, PhD thesis, Osaka University, Osaka, Japan [Google Scholar]
- Ishii, H. A., Bradley, J. P., Dai, Z. R., et al. 2008, Science, 319, 447 [NASA ADS] [CrossRef] [Google Scholar]
- Jäger, C., Dorschner, J., Mutschke, H., Posch, T., & Henning, T. 2003, A&A, 408, 193 [NASA ADS] [CrossRef] [EDP Sciences] [Google Scholar]
- Jones, A. R., & Nuth, J. A. III 2011, A&A, 530, A44 [NASA ADS] [CrossRef] [EDP Sciences] [Google Scholar]
- Keller, L. P., & Messenger, S. 2011, Geochim. Cosmochim. Acta, 75, 5336 [NASA ADS] [CrossRef] [Google Scholar]
- Keller, L. P., & Messenger, S. 2013, Geochim. Cosmochim. Acta, 107, 341 [NASA ADS] [CrossRef] [Google Scholar]
- Kim, T. H., Tsuchiyama, A., Takigawa, A., et al. 2021, A&A, 656, A42 [NASA ADS] [CrossRef] [EDP Sciences] [Google Scholar]
- Koike, C., Noguchi, R., Chihara, H., et al. 2013, ApJ, 778, 60 [CrossRef] [Google Scholar]
- Lauretta, D. S., Lodders, K., & Fegley, J. B. 1997, Science, 277, 358 [NASA ADS] [CrossRef] [Google Scholar]
- Leroux, H., Cuvillier, P., Zanda, B., & Hewins, R. H. 2015, Geochim. Cosmochim. Acta, 170, 247 [NASA ADS] [CrossRef] [Google Scholar]
- Levin, E. M., Robbins, C. R., & Mc Murdie H. F. 1964, Phase diagram for ceramists, The American Ceramic Society. MgO-FeO-SiO (Columbus, OH: American Ceramic Society) [Google Scholar]
- Matsumoto, M., Tsuchiyama, A., Nakato, A., et al. 2019, Sci. Adv., 5 [Google Scholar]
- Matsuno, J., Tsuchiyama, A., Watanabe, T., et al. 2021, ApJ, 911, 47 [NASA ADS] [CrossRef] [Google Scholar]
- Matsuno, J., Tsuchiyama, A., Miyake, A., Nakamura-Messenger, K., & Messenger, S. 2022, Geochim. Cosmochim. Acta, 320, 207 [NASA ADS] [CrossRef] [Google Scholar]
- Molster, F. J., Waters, L. B. F. M., & Kemper, F. 2010, Lect. Notes Phys., 815, 143 [NASA ADS] [CrossRef] [Google Scholar]
- Nittler, L. R., Stroud, R. M., Trigo-Rodríguez, J. M., et al. 2019, Nat. Astron., 3, 659 [NASA ADS] [CrossRef] [Google Scholar]
- Noguchi, T., Ohashi, N., Tsuhimoto, S., et al. 2015, Earth Planet. Sci. Lett., 410, 1 [Google Scholar]
- Ohtaki, K. K., Ishii, H. A., Bradley, J. P., et al. 2021, Geochim. Cosmochim. Acta, 310, 320 [NASA ADS] [CrossRef] [Google Scholar]
- Sargent, B. A., Forrest, W. J., Tayrin, C., et al. 2009, ApJ, 182, 477 [NASA ADS] [Google Scholar]
- Takigawa, A., Kim, T.-H., Igami, Y., et al. 2019, ApJ, 878, L7 [NASA ADS] [CrossRef] [Google Scholar]
- Tanaka, M., Noda, J., Watanabe, T., Matsuno, J., & Tsuchiyama, A. 2014, J. Phys., 518, 012025 [NASA ADS] [Google Scholar]
- Villalon, K., Ohtaki, K., Bradley, J., et al. 2021, Geochim. Cosmochim. Acta, 310, 346 [NASA ADS] [CrossRef] [Google Scholar]
- Wright, J. G. 1971, Philos. Mag., 24, 217 [NASA ADS] [CrossRef] [Google Scholar]
- Yamamoto, T., & Hasegawa, H. 1977, Progr. Theor. Phys., 58, 816 [NASA ADS] [CrossRef] [Google Scholar]
- Yamamoto, D., Tachibana, C., Kawasaki, N., & Yurimoto, H. 2020, Meteor. Planet. Sci., 55, 1281 [NASA ADS] [CrossRef] [Google Scholar]
All Tables
Results of equilibrium calculations using the HSC software for the different runs (Rad-100, Rad-75L, Tan-95, Rad-50).
Representative reactions for the formation of solids in equilibrium, calculated using the HSC software.
All Figures
|
Fig. 1 SEM images of condensates and evaporation residues formed during experiments. BSE images of the residue-poor region (a) and residuerich region (b). High-magnification SE image (c) and BSE image (d) of nanoparticle aggregates as condensates, which appeared to be a smooth matrix in low-magnification images. (e) BSE image of MgO residue, which looks similar to the MgO in the starting material. (ƒ–j) BSE images of melted residues with spherical forms. Cross-section (ƒ) and surface image (g) of glass residues with aligned fine-grained FeS on the surface. Cross-section of residues composed of Fe-metal and FeS (h), Fe-metal, FeS and Mg-Fe-Si-O glass (i), and Fe-metal and glass (j). The relative locations of Fe-metal, FeS, and glass (ƒ–j) indicate the wettability relationships among them. |
| In the text | |
|
Fig. 2 Ternary diagram of the chemical composition of amorphous silicate analyzed by SEM-EDS. Each plot represents the average composition of 10–30 regions (~5 × 5 µm) analyzed within one sample, excluding data points with a composition too far from the average (which is probably due to residues below the surface). |
| In the text | |
|
Fig. 3 Powder XRD analysis patterns of the experimental products. The pattern of the starting material with a ratio of SiO2:Si = 75:25 is shown at the top for comparison. The patterns of the experimental products are ordered by SiO2:Si ratio. |
| In the text | |
|
Fig. 4 FT-IR spectra of the experimental products. Spectra of quartz (Qtz), and amorphous silicate with SiO2 composition (Am. SiO2), enstatite composition (Am. En), and forsterite composition (Am. Fo) made by the ITP method are also shown for comparison. The maximum peak positions at around 10 µm were at 9.1 µm for Am.SiO2 (blue dashed line), 9.7 µm for Am. En (green dashed line), and 10.1 µm for Am. Fo (orange dashed line), respectively. |
| In the text | |
|
Fig. 5 High-angle annular dark-field (HAADF) images (left row) and X-ray elemental mapping images (middle and right rows) of the representative condensates for each grain type in the ITP experiments. Images in the middle and right rows depict the different elements (Fe, Mg, Si, and S) with different colors (red, green, and blue), with each containing a color legend in the upper right corner. The run numbers are (a) Tan-100, (b) Tan-85, (c) Rad-75L, and (d) Rad-75H from top to bottom. The numbered square regions (from 1 to 4) in the X-ray mapping images correspond to the numbered plots in Fig. 8. |
| In the text | |
|
Fig. 6 High-angle annular dark-field (HAADF) image (left) and X-ray elemental mapping images with Fe in red, Mg in green, and Si in blue (middle) and with Fe in red and S in blue (right) of the representative condensates of DCP-75. |
| In the text | |
|
Fig. 7 TEM BF images and SAED patterns of crystalline nanoparticles in condensates; gupeiite (Fe3Si), niningerite (MgS), γ-iron (Fe), and FeS phase. SAED patterns were taken from the circled region. (a) Type-E grains with gupeiite and niningerite on the amorphous silicate from Rad-75H, shown in Fig. 5d. Gupeiite and niningerite are highly crystalline and show conformity in crystal orientation, which is indexed in the SAED pattern with G and N, respectively. (b) Type-A grain with γ-iron particle in the amorphous silicate from Rad-75L. (c) Type-C grain with FeS particle on the amorphous silicate from Rad-100. The phase of FeS was undistinguishable because of its low crystalline and low continuity nature. |
| In the text | |
|
Fig. 8 Ternary diagrams of the chemical compositions (Si –Mg–Fe on the right and S–Mg–Fe on the left) of amorphous silicates analyzed by STEM–EDS. The experiments were divided into three groups according to their relative Fe abundance; Group1 (Rad–100, Tan–100, Tan–95), Group 2 (Tan–75, Rad– 75L, DCP–75, Tan–50), and Group 3 (Tan–85, Rad–75H, Rad–50). The chemical composition of GEMS-like material (Leroux et al. 2015; Matsumoto et al. 2019) and GEMS in CP-IDPs (Bradley 1988, 1994a,b; Keller & Messenger 2011) and micrometeorites (Noguchi et al. 2015) were plotted in (a) and (b), respectively, according to their resemblance in mineral phase and texture to the experimental products. Also, the data from the numbered square in Fig. 5c (middle) of Rad-75L are plotted in a separate ternary diagram (b) (left) to show the relationship between texture and chemical composition. Each plot is a composition extracted from a STEM-EDS mapping of the condensate. Nano-inclusions were avoided. The shaded area in the Mg–Si–Fe diagram is the two-liquid region calculated from the diagram of Levin et al. (1964). |
| In the text | |
|
Fig. 9 Formation model of the condensates in this study together with those in Part I (Kim et al. 2021). |
| In the text | |
|
Fig. 10 Estimated redox condition for each experiment. The range of oxygen abundance XO (horizontal axis) for each starting material with the same SiO2/(Si + SiO2) ratio is calculated for the estimated inflow oxygen rates of 0.5 × 10⁻⁴ molmin−1 (left edge) and 3.6 × 10⁻⁴ molmin−1 (right edge). The redox condition becomes oxidizing with an increase in XO. Even if the same starting material is used, the redox condition becomes more oxidized with a decrease in feeding rate, which is due to the relatively large contribution of the inflow oxygen. The redox condition (XO) of each run is shown as a bar according to its starting material and feeding rate. The values of XO for specific mineral assemblages expected from the GEMS composition are also shown for comparison. |
| In the text | |
|
Fig. 11 Two possible models of GEMS formation. |
| In the text | |
|
Fig. A.1 Schematic phase diagram of the (Mg, Fe)O−SiO2 system. The dashed lines show the metastable extinction curves of the two-liquid boundaries. Tɡ is the glass transition temperature. L: liquid phase; ol, olivine; px, pyroxene; cr, cristobalite; tr, tridymite. |
| In the text | |
|
Fig. B.1 Proportions of the gas and solid species as a function of temperature, calculated by thermodynamic equilibrium using the HSC software for four different experimental runs with different redox conditions (Rad-100, Rad-75L, Tan-95, Rad-50). The molecular species considered in the calculation are mostly common with Matsuno et al. (2021) with addition with following S bearing species, where (g) denotes gas and (s) denotes solids; S(s), S(g), S2(g), S3(g), S4(g), S5(g), S6(g), S7(g), S8(g), S2O(g), SO(g), SO2(g), SO3(g), SiS(g), SiS(s), SiS2(g), SiS2(s), Fe0.877S(s), FeS(s), FeS(g), FeS2(s), FeSO4(s), Fe2(SO4)3(s), MgS(g), MgS(s),MgSO4(s). The abundance is normalized by the amount of Si in the starting material. |
| In the text | |
Current usage metrics show cumulative count of Article Views (full-text article views including HTML views, PDF and ePub downloads, according to the available data) and Abstracts Views on Vision4Press platform.
Data correspond to usage on the plateform after 2015. The current usage metrics is available 48-96 hours after online publication and is updated daily on week days.
Initial download of the metrics may take a while.