Free Access
Fig. 2
Download original image
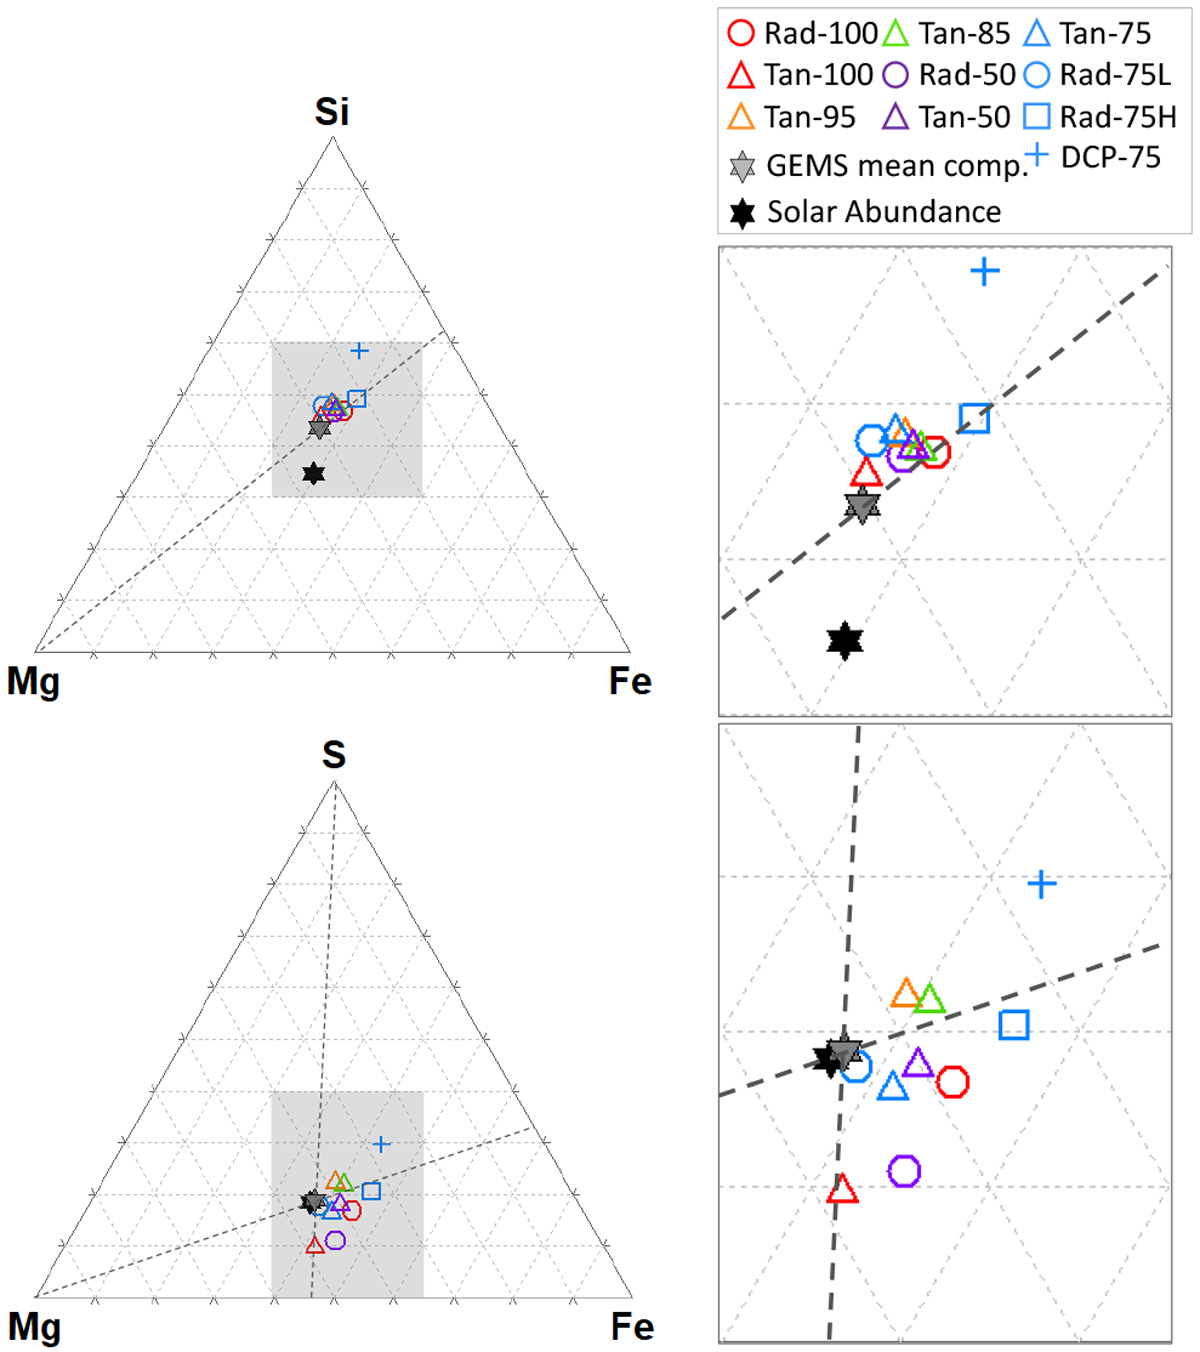
Ternary diagram of the chemical composition of amorphous silicate analyzed by SEM-EDS. Each plot represents the average composition of 10–30 regions (~5 × 5 µm) analyzed within one sample, excluding data points with a composition too far from the average (which is probably due to residues below the surface).
Current usage metrics show cumulative count of Article Views (full-text article views including HTML views, PDF and ePub downloads, according to the available data) and Abstracts Views on Vision4Press platform.
Data correspond to usage on the plateform after 2015. The current usage metrics is available 48-96 hours after online publication and is updated daily on week days.
Initial download of the metrics may take a while.