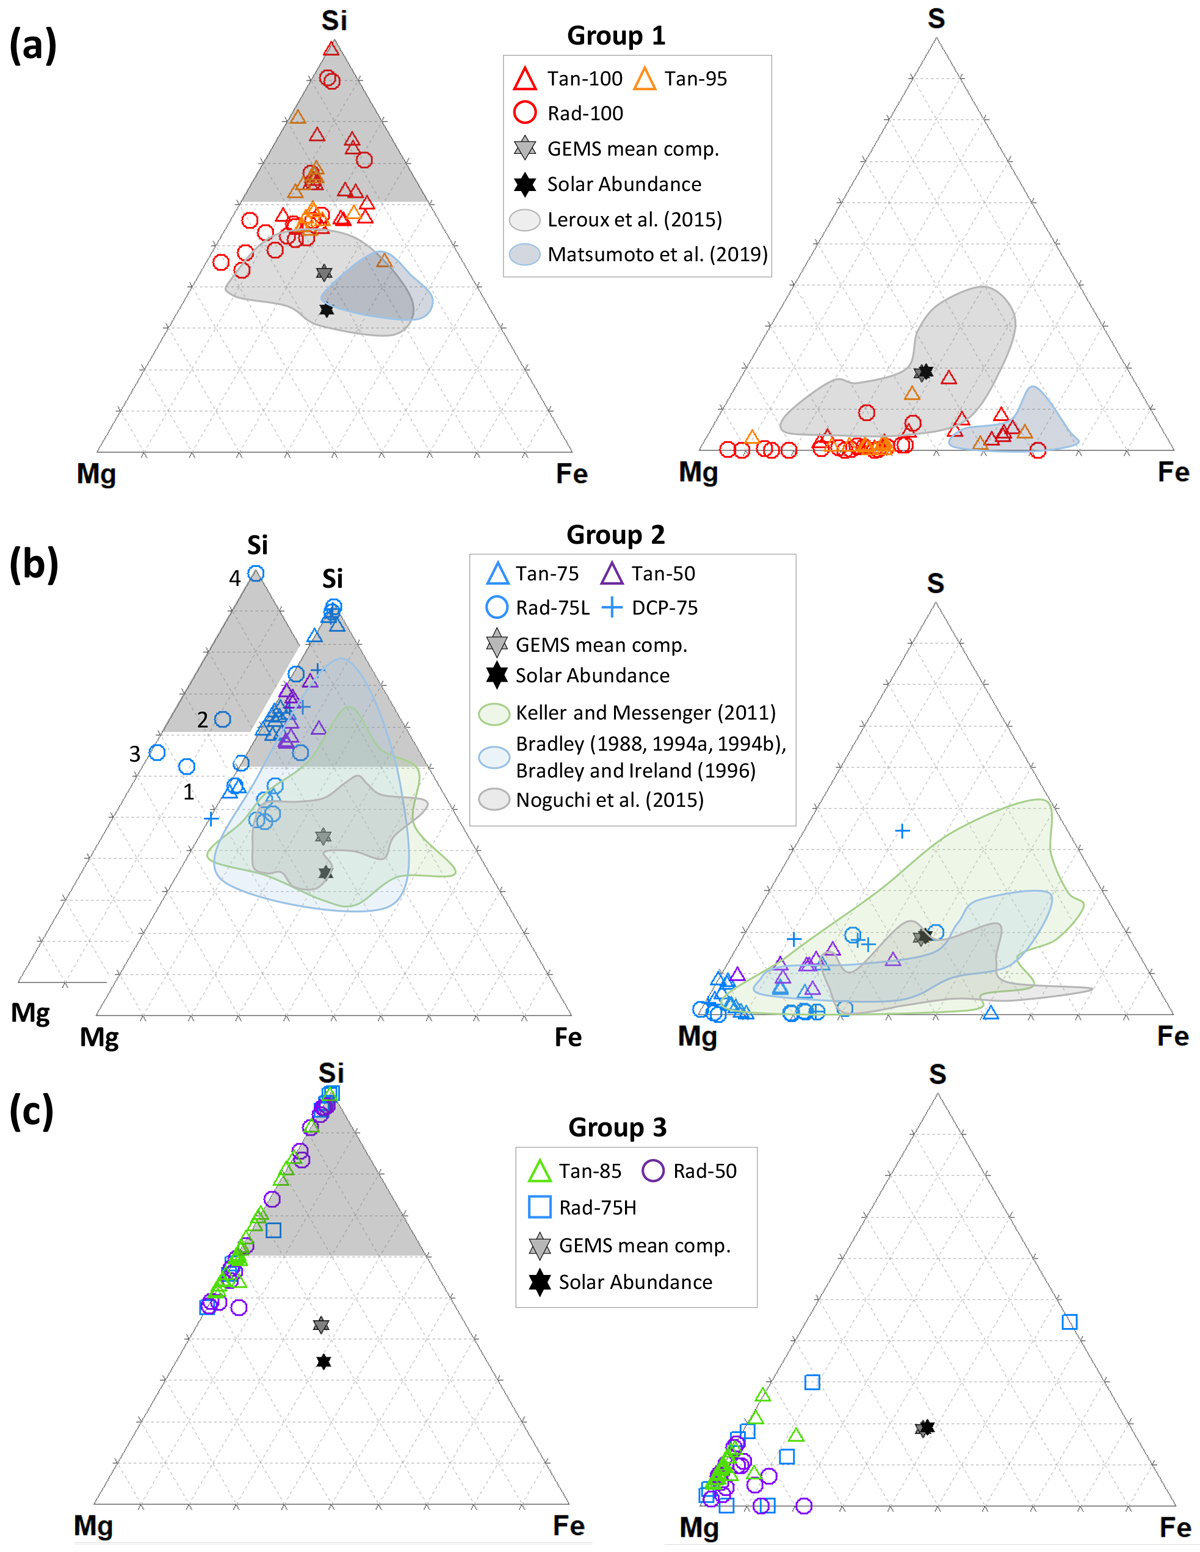
Fig. 8
Download original image
Ternary diagrams of the chemical compositions (Si –Mg–Fe on the right and S–Mg–Fe on the left) of amorphous silicates analyzed by STEM–EDS. The experiments were divided into three groups according to their relative Fe abundance; Group1 (Rad–100, Tan–100, Tan–95), Group 2 (Tan–75, Rad– 75L, DCP–75, Tan–50), and Group 3 (Tan–85, Rad–75H, Rad–50). The chemical composition of GEMS-like material (Leroux et al. 2015; Matsumoto et al. 2019) and GEMS in CP-IDPs (Bradley 1988, 1994a,b; Keller & Messenger 2011) and micrometeorites (Noguchi et al. 2015) were plotted in (a) and (b), respectively, according to their resemblance in mineral phase and texture to the experimental products. Also, the data from the numbered square in Fig. 5c (middle) of Rad-75L are plotted in a separate ternary diagram (b) (left) to show the relationship between texture and chemical composition. Each plot is a composition extracted from a STEM-EDS mapping of the condensate. Nano-inclusions were avoided. The shaded area in the Mg–Si–Fe diagram is the two-liquid region calculated from the diagram of Levin et al. (1964).
Current usage metrics show cumulative count of Article Views (full-text article views including HTML views, PDF and ePub downloads, according to the available data) and Abstracts Views on Vision4Press platform.
Data correspond to usage on the plateform after 2015. The current usage metrics is available 48-96 hours after online publication and is updated daily on week days.
Initial download of the metrics may take a while.