Fig. 4
Download original image
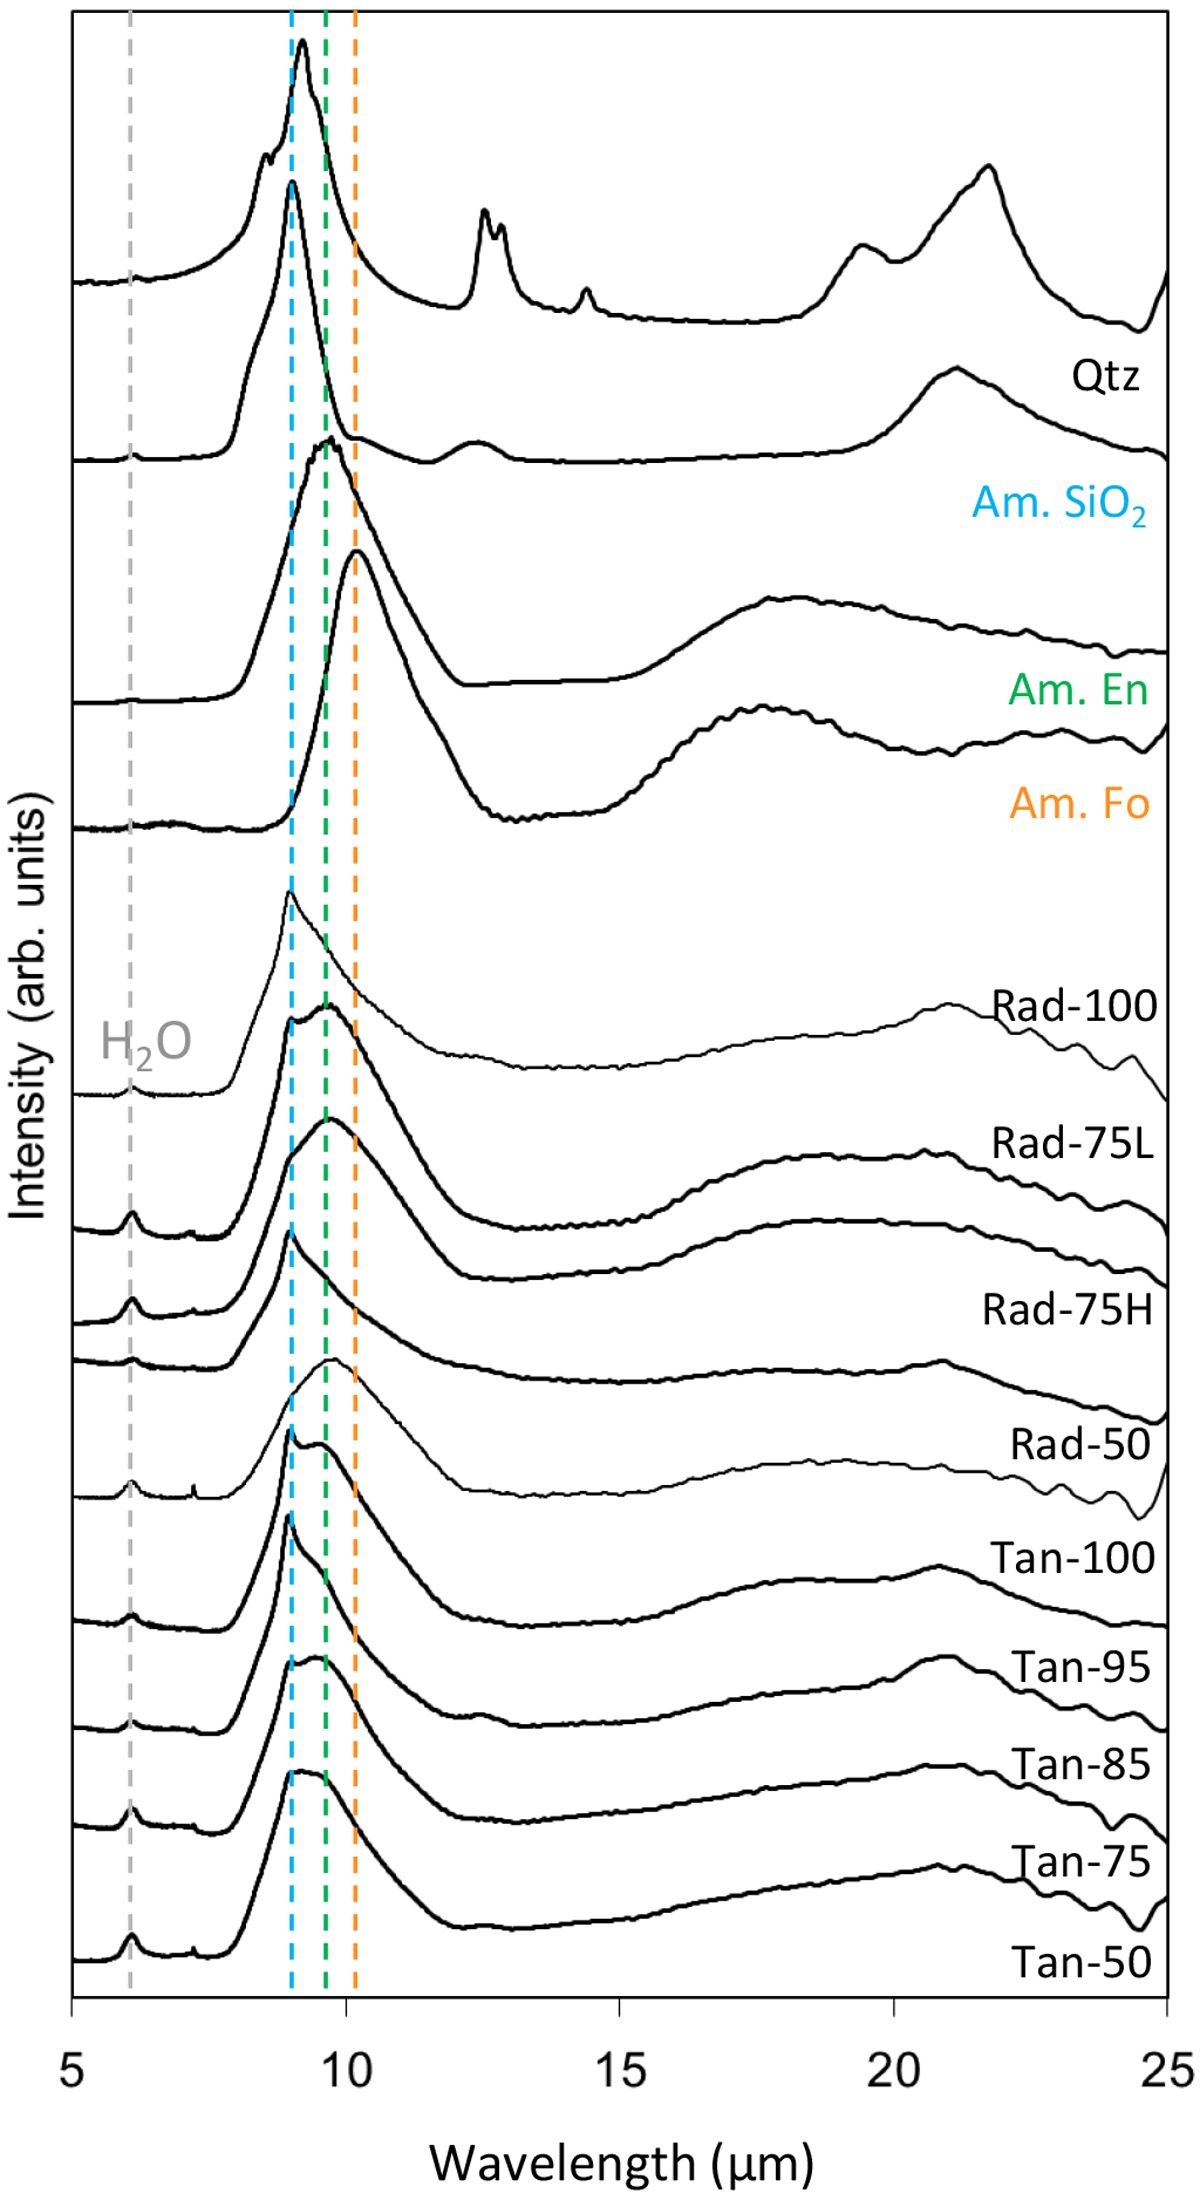
FT-IR spectra of the experimental products. Spectra of quartz (Qtz), and amorphous silicate with SiO2 composition (Am. SiO2), enstatite composition (Am. En), and forsterite composition (Am. Fo) made by the ITP method are also shown for comparison. The maximum peak positions at around 10 µm were at 9.1 µm for Am.SiO2 (blue dashed line), 9.7 µm for Am. En (green dashed line), and 10.1 µm for Am. Fo (orange dashed line), respectively.
Current usage metrics show cumulative count of Article Views (full-text article views including HTML views, PDF and ePub downloads, according to the available data) and Abstracts Views on Vision4Press platform.
Data correspond to usage on the plateform after 2015. The current usage metrics is available 48-96 hours after online publication and is updated daily on week days.
Initial download of the metrics may take a while.