Fig. 5
Download original image
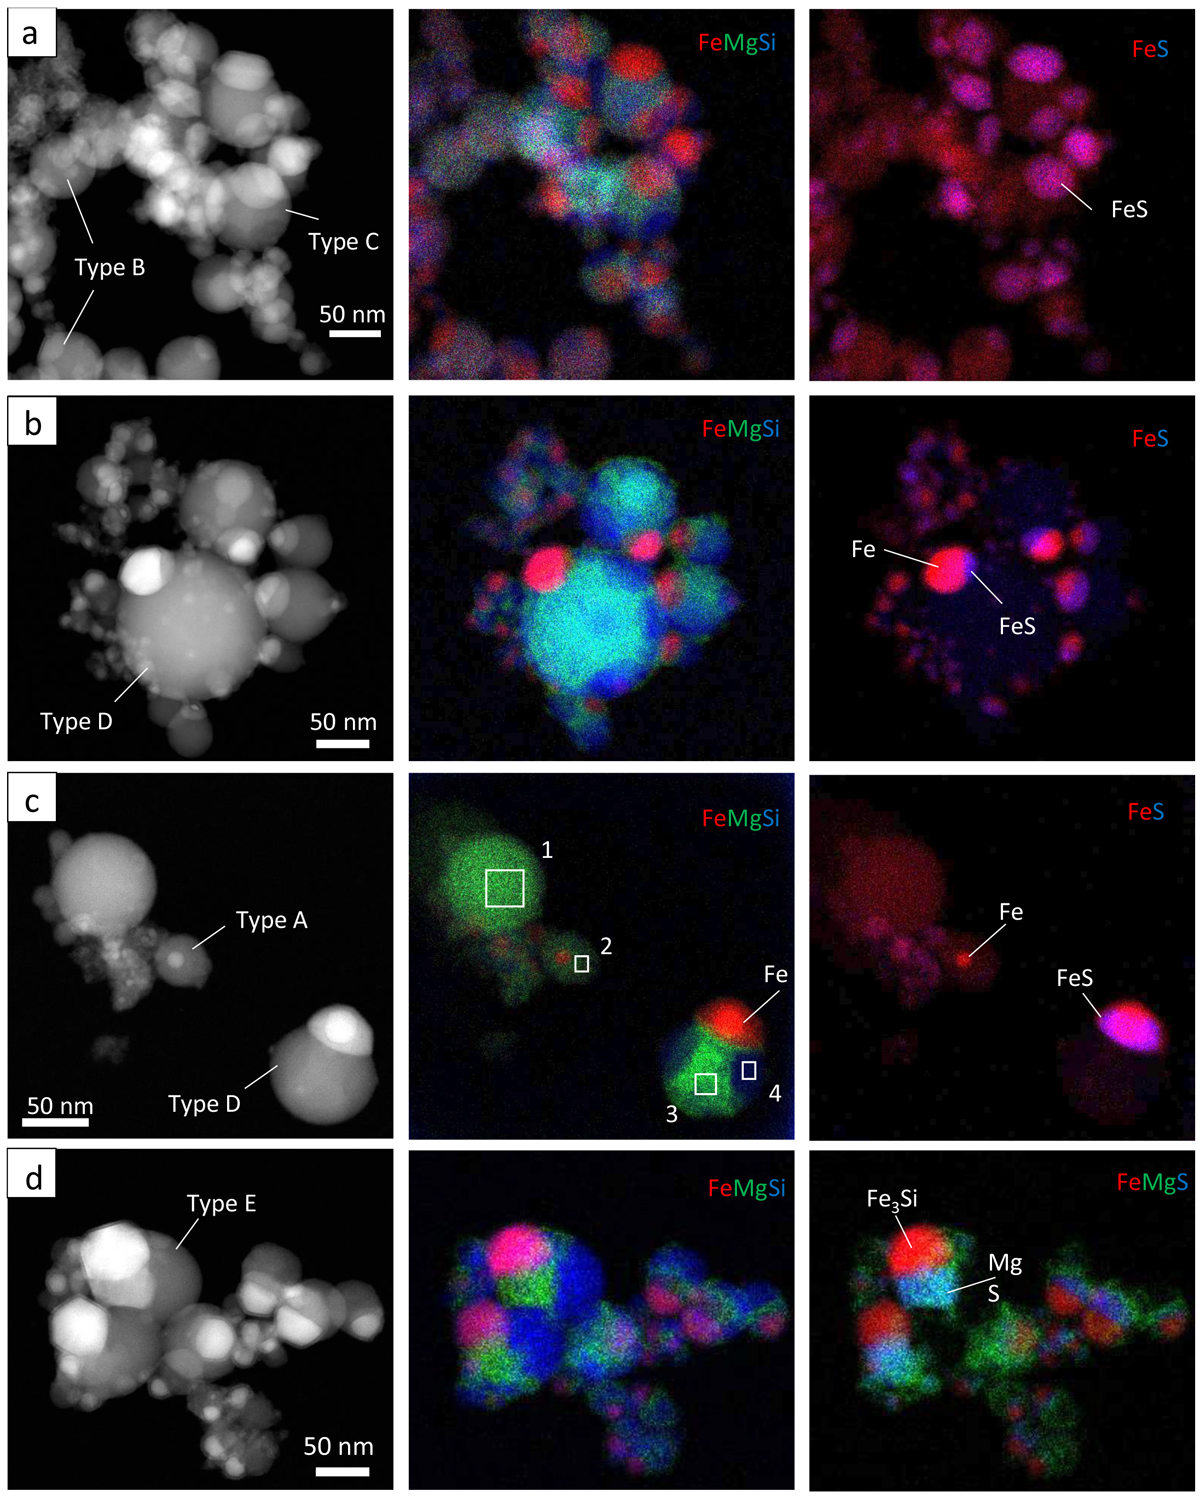
High-angle annular dark-field (HAADF) images (left row) and X-ray elemental mapping images (middle and right rows) of the representative condensates for each grain type in the ITP experiments. Images in the middle and right rows depict the different elements (Fe, Mg, Si, and S) with different colors (red, green, and blue), with each containing a color legend in the upper right corner. The run numbers are (a) Tan-100, (b) Tan-85, (c) Rad-75L, and (d) Rad-75H from top to bottom. The numbered square regions (from 1 to 4) in the X-ray mapping images correspond to the numbered plots in Fig. 8.
Current usage metrics show cumulative count of Article Views (full-text article views including HTML views, PDF and ePub downloads, according to the available data) and Abstracts Views on Vision4Press platform.
Data correspond to usage on the plateform after 2015. The current usage metrics is available 48-96 hours after online publication and is updated daily on week days.
Initial download of the metrics may take a while.