| Issue |
A&A
Volume 660, April 2022
|
|
|---|---|---|
| Article Number | A57 | |
| Number of page(s) | 14 | |
| Section | Astrophysical processes | |
| DOI | https://doi.org/10.1051/0004-6361/202142558 | |
| Published online | 12 April 2022 | |
Grammage of cosmic rays in the proximity of supernova remnants embedded in a partially ionized medium
1
Dipartimento di Fisica, Universitá di Torino, Via P. Giuria 1, 10125 Torino, Italy
e-mail: This email address is being protected from spambots. You need JavaScript enabled to view it.
2
Istituto Nazionale di Fisica Nucleare, Sezione di Torino, Via P. Giuria 1, 10125 Torino, Italy
3
INAF-Osservatorio Astrofisico di Arcetri, Largo E. Fermi 5, 50125 Firenze, Italy
4
INAF-Osservatorio Astronomico di Brera, Via Bianchi 46, 23807 Merate, Italy
5
Université de Paris, CNRS, Astroparticule et Cosmologie, 75006 Paris, France
6
Laboratoire Univers et Particules de Montpellier, Université Montpellier/CNRS, 34095 Montpellier, France
7
Pushkov Institute of Terrestrial Magnetism, Ionosphere and Radiowave Propagation, 108840 Troitsk, Moscow, Russia
Received:
1
November
2021
Accepted:
21
January
2022
Abstract
Aims. We investigate the damping of Alfvén waves generated by the cosmic-ray resonant streaming instability in the context of cosmic-ray escape and propagation in the proximity of supernova remnants. We study in particular whether the self-confinement of cosmic rays in the vicinity of sources can appreciably affect the grammage.
Methods. We considered ion-neutral damping, turbulent damping, and nonlinear Landau damping in the warm ionized and warm neutral phases of the interstellar medium. For the ion-neutral damping, the most recent damping coefficients were used.
Results. We show that ion-neutral damping and turbulent damping effectively limit the residence time of cosmic rays in the proximity of the source, so that the grammage that is accumulated near sources is found to be negligible. In contrast to previous results, this also occurs in the most extreme scenario in which ion-neutral damping is less effective, namely in a medium consisting only of neutral helium and fully ionized hydrogen. The standard picture, in which cosmic-ray secondaries are produced during the whole time that cosmic rays spend in the Galactic disk therefore do not need to be revised substantially.
Key words: cosmic rays / ISM: general / diffusion
© ESO 2022
1. Introduction
The most popular hypothesis for the origin of Galactic cosmic rays (CRs) invokes supernova remnants (SNRs) as the main sources of such particles (see, e.g., Blasi 2013; Gabici et al. 2019). In this scenario, which in the past decades has become a paradigm, CR diffusion plays a central role. Diffusion is the key ingredient at the base of the diffusive shock acceleration of particles at SNRs (e.g., Drury 1983). Diffusion also affects the escape of CRs from the acceleration site and the subsequent propagation in the source region, with significant implications for γ-ray observations (Aharonian & Atoyan 1996; Gabici et al. 2009; Casanova et al. 2010; Ohira et al. 2011; Nava & Gabici 2013). In particular, the detection of γ rays from the π0 decay channel, produced by runaway CRs interacting with molecular clouds in the source region, can provide information about the diffusion coefficient of CRs in the source region (see, e.g., Gabici et al. 2015). Finally, diffusion determines the confinement time of CRs in the Galaxy, thus affecting the observed spectrum and the abundances of secondary spallation nuclei and unstable isotopes (Ptuskin & Soutoul 1998; Wiedenbeck et al. 2007).
The diffusion of CRs is thought to be mostly due to the resonant scattering off plasma waves whose wavelength is comparable to the Larmor radius rL = γmpc2/eB of the particle, where mp is the proton mass, B is the magnetic field strength, and γ the Lorentz factor (see, e.g., Skilling 1975a). The magnetohydrodynamic (MHD) turbulence relevant for CR propagation is composed of incompressible Alfvénic and compressible (fast and slow) magnetosonic fluctuations (Cho & Lazarian 2002; Fornieri et al. 2021). MHD turbulence is ubiquitous in the interstellar space and may be injected by astrophysical sources (see, e.g., Mac Low & Klessen 2004), but also by the CRs themselves. The active role of CRs in producing the waves that cause their scattering has been widely recognized (see, e.g., Wentzel 1974; Skilling 1975b; Cesarsky 1980; Amato 2011). The spatial gradients in the CR density, such as those found in the vicinity of the source, lead to the excitation of Alfvén waves at the resonant scale (Ptuskin et al. 2008). This process, called resonant streaming instability, produces waves that propagate along magnetic field lines in the direction of decreasing CR density.
The density of Alfvén waves that scatter CRs is limited by several damping processes. The most relevant are (i) ion-neutral damping in a partially ionized medium (Kulsrud & Pearce 1969; Kulsrud & Cesarsky 1971; Zweibel & Shull 1982), (ii) turbulent damping due to the interaction of a wave with counterpropagating Alfvén wave packets. These waves may be the result of a background turbulence injected on large scales and cascading to small scales (we abbreviate this damping FG, after Farmer & Goldreich 2004), and (iii) nonlinear Landau (NLL) damping caused by the interaction of background thermal ions with the beat of two interfering Alfvén waves (see, e.g., Felice & Kulsrud 2001; Wiener et al. 2013). The relative importance of these effects depends significantly on the physical conditions and chemical composition of the ambient medium. A few other collisionless and collisional damping processes can impact MHD wave propagation in a partially ionized gas, but they mostly affect high-wavenumber perturbations (Yan & Lazarian 2004). Recently, it has been suggested that dust grains may also contribute to the damping of Alfvén waves (Squire et al. 2021).
In this paper we investigate the escape of CRs from SNRs and their subsequent self-confinement in the source region as caused by the interplay between the generation of Alfvén waves by CR streaming instability and the damping process mentioned above. Our main goal is to establish whether the self-confinement of CRs in the vicinity of sources can appreciably affect the grammage accumulated by these particles. If this were the case, a significant fraction of CR secondaries would be produced in the vicinity of CR sources and not during the time spent by CRs in the Galactic disk, as commonly assumed. This would constitute a profound modification of the standard view of CR transport in the Galaxy (see, e.g., D’Angelo et al. 2016; Cowsik & Madziwa-Nussinov 2016; Lipari 2019; Mertsch et al. 2021; Schroer et al. 2021). In particular, we focus on the CR propagation in partially ionized phases of the interstellar medium (ISM), showing that ion-neutral and FG damping can significantly affect the residence time of CRs in the vicinity of their sources. We find that for typical conditions, the grammage accumulated by CRs in the vicinity of sources is negligible compared to that accumulated during the time they spend in the Galaxy. Even for a medium consisting of fully ionized H and neutral He, the combination of ion-neutral and turbulent damping can substantially reduce the confinement time1.
This paper is organized as follows: in Sect. 2 we describe the damping of Alfvén waves by ion-neutral collisions in various partially ionized phases of the ISM and by other damping mechanisms; in Sect. 3 we illustrate the equations and the setup of our model of CR escape and propagation in the proximity of SNRs, the time-dependent CR spectrum and diffusion coefficient, the residence time of CRs in the proximity of the source and the implications on the grammage; in Sect. 4 we describe our results; and in Sect. 5, we finally draw our conclusions.
2. Damping of Alfvén waves
2.1. Ion-neutral damping
The Galaxy for most of its volume consists of three ISM phases: the warm neutral medium (WNM, filling factor ∼25%), the warm ionized medium (WIM, filling factor ∼25%), and hot the ionized medium (HIM, filling factor ∼50%; see, e.g., Ferrière 2001, 2019). The physical characteristics of these phases are summarized in Table 1 (from Jean et al. 2009). The physical characteristics of the cold neutral medium (CNM) and the diffuse molecular medium (DiM) are also listed for completeness, while their filling factor is ≲1% (Ferrière 2001, 2019). In regions with neutrals, such as the WNM and the WIM, the rate of ion-neutral damping depends on the number and chemical species of the colliding particles. In the WNM and WIM, the ions are H+, while neutrals are He atoms (with a H/He ratio of ∼10%) and H atoms with a fraction that varies from phase to phase.
ISM phases and parameters we adopted.
The main processes of momentum transfer (mt) between ions and neutrals are elastic scattering by induced dipole and charge exchange (ce). In the first case, which is dominant at low collision energies, the incoming ion is deflected by the dipole electric field that is induced in the neutral species, according to its polarizability (Langevin scattering); in the second case, the incoming ion takes one or more electrons from the neutral species, which becomes an ambient ion. The friction force per unit volume Fi exerted on an ion i is thus the sum of Fi, mt + Fi, ce.
With the exception of collisions between an ion and a neutral of the same species, as in the important case of collisions of H+ ions with H atoms (see Appendix A.1), the two processes are well separated in energy. At low collision energies, elastic scattering dominates, and the friction force is
 (1)
(1)
where ni and nn are the ion and neutral densities, ui and un are the ion and neutral velocities, μin is the reduced mass of the colliding particles, σmt is the mt cross section, and the brackets denote an average over the relative velocity of the colliding particles.
At high collision energies (above ∼102 eV), the dominant contribution to the transfer of momentum is ce,
 (2)
(2)
If the ce rate coefficient is approximately independent of temperature and there is no net backward-forward asymmetry in the scattering process (two conditions that are generally well satisfied), the friction force on the ions takes the form (Draine 1986)
 (3)
(3)
where σce is the ce cross section, and mn(i) is the mass of the neutral (ion).
The collisional rate coefficients ⟨σmtv⟩in and ⟨σcev⟩in are often estimated from the values given by Kulsrud & Cesarsky (1971) or Zweibel & Shull (1982) for H+–H collisions (e.g., D’Angelo et al. 2016; Nava et al. 2016; Brahimi et al. 2020). The rate coefficients for collisions between various species of ions and neutrals adopted in this study are described in detail in Appendix A.1. For elastic collisions, they were taken from the compilation by Pinto & Galli (2008); for ce, they were calculated from the most recently updated available cross sections.
Ion-neutral collisions are one of the dominant damping processes for Alfvén waves propagating in a partially ionized medium (see Piddington 1956; Kulsrud & Pearce 1969). In the case of elastic ion-neutral collisions (Eq. (1)), the dispersion relation for Alfvén waves is
![Mathematical equation: $$ \begin{aligned} \omega (\omega ^2-\omega _k^2)+i \nu _{\rm in}[(1+\epsilon )\omega ^2-\epsilon \omega _k^2]=0, \end{aligned} $$](/articles/aa/full_html/2022/04/aa42558-21/aa42558-21-eq4.gif) (4)
(4)
where ω is the frequency of the wave, ωk = kvA, i is the wave vector in units of the Alfvén speed of the ions,
 (5)
(5)
νin is the ion-neutral collision frequency,
 (6)
(6)
and ϵ is the ion-to-neutral mass density ratio,
 (7)
(7)
ϵ is a small quantity in the WNM and CNM, but not in the WIM2.
The dispersion relation Eq. (4) is a cubic equation for the wave frequency ω (with real and imaginary parts) as a function of the real wave number ωk. Writing  , where
  is the ion-neutral damping rate, and substituting in Eq. (4), we obtain (Zweibel & Shull 1982)
![Mathematical equation: $$ \begin{aligned} \omega _k^2=\frac{2\Gamma _{\rm d}^\mathrm{in}}{\nu _{\rm in} - 2\Gamma _{\rm d}^\mathrm{in}}[(1+\epsilon )\nu _{\rm in}-2\Gamma _{\rm d}^\mathrm{in}]^2, \end{aligned} $$](/articles/aa/full_html/2022/04/aa42558-21/aa42558-21-eq10.gif) (8)
(8)
which implies  . If ϵ ≪ 1, then
![Mathematical equation: $$ \begin{aligned} \Gamma _{\rm d}^\mathrm{in}\approx \frac{\omega _k^2\nu _{\rm in}}{2[\omega _k^2+(1+\epsilon )^2\nu _{\rm in}^2]}\cdot \end{aligned} $$](/articles/aa/full_html/2022/04/aa42558-21/aa42558-21-eq12.gif) (9)
(9)
Alfvén waves resonantly excited by CR protons have a frequency ωk ≈ vA, i/rL Thus, the frequency is related to the kinetic energy of the CR proton E = γmpc2 as
 (10)
(10)
The effective Alfvén velocity, vA = ℜ(ω)/k, that is felt by CRs depends on the coupling between ions and neutrals.
In general, the following two asymptotic behaviors can be identified: (i) low wavenumber, ωk ≪ νin. At high CR energy, ions and neutrals are well coupled, the total density is n = nH + nHe + ni, and the Alfvén speed relevant for CRs resonant with the waves is
 (11)
(11)
where μ ∼ 1.4 is the mean molecular weight, and  , (ii) high wavenumber, ωk ≫ νin. At low CR energy, ions and neutrals are weakly coupled and ion-neutral damping is most effective. The Alfvén speed is the one in the ions, vA, i, and
  .
.
If ϵ < 1/8, the waves do not propagate in a partially ionized medium for a range of wave numbers (Zweibel & Shull 1982). This is plotted as a shaded region in Figs. 1 and 2. On the other hand, a band without propagation like this is found when no CRs propagate in the partially ionized medium. It has recently been suggested (Reville et al. 2021) that when CRs are taken into account, the propagation of waves in that band may be feasible.
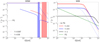 |
Fig. 1. Damping rates |


We introduce the fraction of ionized gas f and the helium-to-hydrogen ratio χ,
 (12)
(12)
Equation (6) then becomes
![Mathematical equation: $$ \begin{aligned} \nu _{\rm in} = \left[\frac{1-f}{1+\tilde{m}_{\rm i}}\langle \sigma _{\rm mt} { v}\rangle _{\mathrm{i,H}} +\frac{4\chi }{4+\tilde{m}_{\rm i}}\langle \sigma _{\rm mt} { v}\rangle _{\mathrm{i,He}}\right] \frac{n}{1+\chi }, \end{aligned} $$](/articles/aa/full_html/2022/04/aa42558-21/aa42558-21-eq20.gif) (13)
(13)
where  . In the following, the standard value χ = 0.1 is assumed, but the case χ = 0 is also considered for illustrative purposes and for a comparison with the results of D’Angelo et al. (2016), who neglected the contribution of helium to ion-neutral damping.
2.1.1. Warm ionized medium and warm neutral medium
In this case, H is partially ionized, and the dominant ion is H+ ( ). Therefore ϵ = nH+/(nH + 4nHe) = f/(1 − f + 4χ), namely ϵ = 0.005−0.05 and 0.75−9 for the WNM and the WIM, respectively. The ion-neutral collision frequency is
![Mathematical equation: $$ \begin{aligned} \nu _{\rm in}=\left[\frac{1-f}{2} \langle \sigma _{\rm mt} { v}\rangle _{\mathrm{H}^+,\mathrm{H}} +\frac{4\chi }{5}\langle \sigma _{\rm mt} { v}\rangle _{\mathrm{H}^+,\mathrm{He}}\right] \frac{n}{1+\chi }\cdot \end{aligned} $$](/articles/aa/full_html/2022/04/aa42558-21/aa42558-21-eq23.gif) (14)
(14)
Figure 1 shows the damping rate for waves that are resonant with CRs of energy E as a function of the CR energy E. We highlight the band without propagation in the WNM (ϵ < 1/8).
2.1.2. Cold neutral medium and diffuse molecular medium
In this case, H is neutral, and the dominant ion is C+ ( ), with a fractional abundance nC+/nH ≈ (0.4−1)×10−3. Therefore ϵ = 12nC+/(nH + 4nHe)≈(3−9)×10−3 and
![Mathematical equation: $$ \begin{aligned} \nu _{\rm in}=\left[\frac{1}{13}\langle \sigma _{\rm mt} { v}\rangle _{\mathrm{C}^+,\mathrm{H}} +\frac{\chi }{4}\langle \sigma _{\rm mt} { v}\rangle _{\mathrm{C}^+,\mathrm{He}}\right] \frac{n}{1+\chi }\cdot \end{aligned} $$](/articles/aa/full_html/2022/04/aa42558-21/aa42558-21-eq25.gif) (15)
(15)
Figure 2 shows the damping rate for waves that are resonant with CRs of energy E as a function of the CR energy E. Regions without propagation are found in this case as well.
 |
Fig. 2. Ion-neutral damping rate |

2.2. Wave cascade and turbulent damping
The turbulent damping (FG) of self-generated Alfvén waves is due to their interaction with a pre-existing background turbulence. This, turbulence may be injected by astrophysical sources (see e.g., Mac Low & Klessen 2004) with a turbulent velocity vturb and on scales, Linj, that far exceed the CR Larmor radius. For waves that are in resonance with particles with a given energy E, the damping rate that accounts for the anisotropy of the turbulent cascade has been derived by Farmer & Goldreich (2004) and Yan & Lazarian (2004), and reads
 (16)
(16)
where vA is the effective Alfvén speed felt by CRs, as defined in Sect. 2.1. We took the turbulence as trans-Alfvénic at the injection scale, namely vturb = vA, n (at large scales, waves are in the low wave number regime, where ions and neutrals are well coupled, as shown in Sect. 2.1). This situation is expected if the turbulence is mainly injected by old SNRs, with a forward shock becoming trans-sonic and trans-Alfvénic. The FG damping rate is shown in Fig. 1 for the WIM and WNM.
In highly neutral media, such as the WNM, CNM, and DiM, the background turbulence that causes FG damping can be damped by ion-neutral friction at a scale lmin = 1/kmin (Xu et al. 2015, 2016; Lazarian 2016; Brahimi et al. 2020). Correspondingly, there is a minimum particle energy, Emin, such that rL(Emin) = lmin, below which the FG damping cannot affect the self-generated Alfvén waves (Brahimi et al. 2020),
 (17)
(17)
In Fig. 1 the FG damping rate for the WNM is truncated at Emin. In the WIM, the cascade rate is found to be always higher than the ion-neutral damping rate, and there is no Emin.
2.3. Nonlinear Landau damping
The NLL damping is caused by the interaction between the beat of two Alfvén waves and the thermal (at temperature T) ions in the background medium. The damping rate for resonant waves is (Kulsrud 1978; Wiener et al. 2013)
 (18)
(18)
where kB is the Boltzmann constant and I(kres) is the wave energy density (see Sect. 3 below for the definition) at the resonant wave number kres = 1/rL.
3. Cosmic-ray propagation in the proximity of supernova remnants
We considered the escape of CRs from an SNR and the subsequent propagation in the proximity of the source. The propagation region was assumed to be embedded in a turbulent magnetic field, with a large-scale ordered component of strength B0. CRs are scattered by Alfvén waves, which constitute a turbulent magnetic field background of relative amplitude δB(k)/B0, where k is the wave number. We only considered waves that propagate along the uniform background field B0. In the limit of δB/B0 ≪ 1, which is relevant for the cases treated in this paper, CR diffusion along field lines can be treated in the quasi-linear regime, with the diffusion coefficient given by Berezinskii et al. (1990) and Kulsrud (2005),
 (19)
(19)
where c is the speed of light,  is the wave energy density calculated at the resonant wave number, and DB(E) = (4π/3)crL(E) is the Bohm diffusion coefficient. We also assumed that the dominant source of Alfvénic turbulence is produced by the CR resonant streaming instability.
We adopted the flux tube approximation for the CR transport along B0 (see, e.g., Ptuskin et al. 2008), and we neglected diffusion across field lines, which is suppressed in the δB/B0 ≪ 1 regime (see, e.g., Drury 1983; Casse et al. 2002). Thus, we did not address the perpendicular evolution of the flux tube (see, e.g., Nava & Gabici 2013) and any possible CR feedback on it, and in general, on the ISM dynamics (see, e.g., Schroer et al. 2021). A one-dimensional model for the CR propagation like this is applicable for distances from the source below the coherence length, Lc, of the background magnetic turbulence, that is, the scale below which the magnetic flux tube is roughly preserved (see, e.g., Casse et al. 2002).
When particles diffuse away from the source at distances larger than Lc, diffusion becomes three-dimensional, and the CR density drops quickly. In the Galactic disk, Lc is estimated observationally and may range from a few parsec to ≈100 pc, depending on the ISM phase (see, e.g., Nava & Gabici 2013, and references therein).
We followed the approach proposed by Nava et al. (2016, 2019), and we determined (i) the escape time of CRs of a given energy from the remnant, (ii) the time-dependent evolution of the CR cloud and of the self-generated diffusion coefficient after escape, and (iii) the time spent by CRs in the vicinity of the source and the corresponding grammage. We focused on the warm ionized and warm neutral phases of the ISM. As shown in the following sections, the results depend significantly on the ISM phase that is considered, and in particular, on the number and type of neutral and ionized atoms in the background medium.
3.1. Transport equations and initial and boundary conditions
The coupled CR and wave transport equations read (Nava et al. 2016, 2019)
 (20)
(20)
and
 (21)
(21)
Here vA is an effective Alfvén velocity that takes the coupling between ions and neutrals into account (see Sect. 2.1), and PCR is the partial pressure of CRs with a momentum p normalized to the magnetic field pressure,
 (22)
(22)
The term 2 ΓCRI gives the wave growth due to the CR streaming instability and can be expressed as
 (23)
(23)
The term Γd encompasses the relevant wave damping rates, which are described in detail in Sect. 2. The term Q represents the possible injection of turbulence from an external source other than the CR streaming. Here it was taken as Q = 2ΓdI0, where I0 is a parameter such that typical values of the Galactic CR diffusion coefficient are recovered at large distances from the source (see, e.g., Strong et al. 2007). In this way, when the streaming instability is not relevant, diffusion is regulated by the background turbulence. In these equations, we neglected adiabatic losses that arise when the Alfvén speed varies in space (see, e.g., Brahimi et al. 2020) because we considered a homogeneous ISM around the SNR.
The coordinate z was taken along B0, and z = 0 refers to the center of the CR source. The equations were solved numerically with a finite-difference explicit method, using the initial conditions
and
 (24)
(24)
Here Resc(E) is the size of the region that is filled by CRs at the time of escape, and  is the initial CR pressure inside this region. The method we used to determine the escape radius and time for particles of energy E is described in detail in Nava et al. (2016, 2019) and is summarized in Sect. 4.1. For the initial condition for the waves, it is also possible to choose I ≫ I0 for z < Resc(E) in order to mimic Bohm diffusion inside the source, as proposed by Malkov et al. (2013). However, as discussed by Nava et al. (2019), different choices of I inside the source have little impact on the final solution. As boundary conditions, we imposed a symmetric CR distribution at z = 0, and
 (25)
(25)
The one-dimensional model we used is valid only up to a distance from the source given by the coherence length Lc of the magnetic field. At larger distances, the diffusion becomes three-dimensional, and the CR density quickly drops. This behavior can be described in terms of a free escape boundary at Lc. The value of Lc is constrained from observations to be ≲100 pc, but its value is debated and likely depends on phase and position in the Galaxy. We took the free escape boundary at z ≳ Lc, and we verified that this assumption did not affect the results significantly, for instance, change Lc to 10 Lc.
4. Results
We discuss the release of CRs of energy E from an SNR below and give an estimate of the age and radius of the source at the moment of escape. Moreover, we investigate the propagation of runaway CRs in the proximity of the source, with particular focus on the CR spectrum and self-generated diffusion coefficient. Finally, we estimate the residence time of CRs in the proximity of the source, and we infer general implications for the grammage accumulated in that region. We treat these aspects in the cases of a WIM or a WNM surrounding the remnant, with particular emphasis on the role played by the ion-neutral damping of Alfvén waves.
In our calculations we assumed that (i) runaway CRs have a total energy ECR = 1050 erg, a power-law spectrum in energy between 1 GeV–5 PeV with a spectral index γ = −2.0, and that (ii) the typical ISM diffusion coefficient is D(E) = D0(E/10 GeV)0.5 with D0 = 1028 cm2 s−1 (see, e.g., Strong et al. 2007).
4.1. Escape of cosmic rays: Source age and radius
The age and escape radius of CRs with an energy E was estimated as follows (Nava et al. 2016, 2019): We defined the half-time, t1/2(E, R) of a CR cloud as the time after which half of the CRs of a given energy that were initially confined within a region of size R have escaped that region. The evolution of this CR cloud was studied by solving Eqs. (20) and (21) with initial conditions given by Eq. (24) and boundary conditions given by Eq. (25).
The radius of an SNR that expands in a homogeneous medium of density n can be estimated as (Truelove & McKee 1999)
![Mathematical equation: $$ \begin{aligned} R_{\rm SNR}(t) = 0.5 \left(\frac{E_{51}}{n}\right)^{1/5}\left[1-\frac{0.09\,M_{\mathrm{ej}\odot }^{5/6}}{E_{51}^{1/2}n^{1/3}t_{\rm kyr}}\right]^{2/5}t_{\rm kyr}^{2/5}\,\mathrm{pc}, \end{aligned} $$](/articles/aa/full_html/2022/04/aa42558-21/aa42558-21-eq40.gif) (26)
(26)
where E51 is the supernova explosion energy in units of 1051 erg, n is the total density of the ambient ISM in cm−3, Mej⊙ is the mass of the supernova ejecta in solar masses, and tkyr is the SNR age in kyr. This equation is valid in the adiabatic phase of the expansion, which starts after  yr. Here we took E51 = 1 and Mej⊙ = 1.4, while the gas density depends on the medium and is reported in Table 1. At earlier times, an approximate expression for the free expansion phase has to be used (Chevalier 1982). The adiabatic phase stops at roughly
  yr, when the radiative phase starts (Cioffi et al. 1988). At this epoch, we also assumed that the acceleration of CRs becomes ineffective and that all CRs are instantly released (the validity of an assumption of instant release may depend on the conditions in the shock precursor, as discussed by Brahimi et al. 2020).
The escape time, tesc(E), of particles with energy E was estimated as the time when t1/2(E, RSNR) equals the age, ta(RSNR), of an SNR of radius RSNR. If t1/2(E, RSNR) > ta(RSNR), the SNR expansion is faster than the CR cloud expansion, and CRs remain confined in the remnant. In the opposite case, the cloud expansion is faster than the SNR expansion, so that these particles are released from the accelerator. The moment of escape is estimated as t1/2(E, RSNR) = ta(RSNR). We note that tesc(E) is the timescale over which waves can grow.
The dependence of t1/2(E, R) on the initial radius R at fixed energy E and varying the background diffusion coefficient and the CR spectral index has been extensively explored by Nava et al. (2016, 2019), and we refer to these works for a detailed discussion. Here we briefly summarize the most relevant points. At small R, the CR gradient is large and the amplification of waves is very effective. In this regime, the NLL damping, which scales with the wave energy density I(k), can play an important role and may dominate ion-neutral and FG damping at small enough radii. At intermediate R, ion-neutral damping dominates in most cases. Figure 1 shows that the ion-neutral damping rate is higher than the FG rate at least up to particle energies of ∼10 TeV, with the only exception of a WIM with fully ionized hydrogen and ∼10% of neutral helium. At large R, the CR gradient is reduced and the streaming instability is less effective. In this case, the expansion of the CR bubble is determined by the background turbulence and the test particle limit is recovered, with t1/2 ∝ R2/D0.
Figures 3 and 4 show the SNR age and radius at the time of CR escape as a function of CR energy in the case of a WNM and WIM, respectively. We confirm the findings by Nava et al. (2016, 2019) and the qualitative results that particles with higher energy escape earlier than the low-energy particles (see, e.g., Gabici 2011).
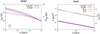 |
Fig. 3. Case of WNM. Left panel: SNR age tesc (solid lines, left axis) and radius Resc (dashed lines, right axis) at the time of CR escape as a function of CR energy. Right panel: grammage (left axis) accumulated in a region of ∼100 pc around the source as a function of CR energy as deduced from the estimated residence time tres (right axis) in that region. The grammage accumulated during CR Galactic propagation as estimated by Ptuskin et al. (2009) (XP09, olive line) and by Evoli et al. (2019) (XE19, gray line) is also shown. Different colors are used for different values of the hydrogen ionization fraction f, while the helium-to-hydrogen ratio χ = 0.1. The parameters of the WNM are listed in Table 1. |
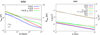 |
Fig. 4. Case of WIM. Left panel: SNR age tesc (solid lines, left axis) and radius Resc (dashed lines, right axis) at the time of CR escape as a function of CR energy. Right panel: grammage (left axis) accumulated in a region of ∼100 pc around the source as a function of CR energy as deduced from the estimated residence time tres (right axis) in that region. The grammage accumulated during CR Galactic propagation as estimated by Ptuskin et al. (2009) (XP09, olive line) and by Evoli et al. (2019) (XE19, gray line) is also shown. The cyan curve is computed by assuming that particles of all energies escape at an SNR radius of 20 pc, as assumed by D’Angelo et al. (2016). Different colors are used for different values of the hydrogen ionization fraction f and helium-to-hydrogen ratio χ. The parameters of the WIM are listed in Table 1. |
In the case of the WIM, Resc and tesc tend to decrease with a higher neutral density. The effect of ion-neutral damping is especially visible in the energy range ∼1−10 TeV, where the ion-neutral damping rate starts to decrease from a roughly constant value at different particle energies, depending on the value of the ionized hydrogen fraction f and on the helium-to-hydrogen ratio χ, as shown in Fig. 1. The drop in  corresponds to an increase in tesc, and therefore to a better CR confinement.
The situation is different in a subtle way in the case of the WNM. Here the confinement appears to be slightly more effective for a lower value of f. This result is opposite to what occurs in the WIM. This can be explained by taking into account that while  is practically the same at energies below ∼10 TeV for f ∼ 7 × 10⁻³ − 5 × 10⁻², the effective Alfvén speed felt by CRs, which at these energies is roughly that of ions as illustrated in Sect. 2, is a factor of ∼2−3 higher for f = 7 × 10⁻³. This reflects on an increase by the same amount of the FG damping rate (above the cutoff energy, see Sect. 2.2), as shown in Fig. 1, but also of the growth rate term, which is proportional to vA. On the other hand, at energies in the range ∼10 GeV–1 TeV, the FG damping is always subdominant compared to the ion-neutral damping, and the net effect of this change of vA is a slightly better confinement at smaller f as a result of an enhanced wave growth rate.
Furthermore, in the case of a WIM, the effective vA is slightly higher at smaller f below ∼1 TeV, but here the increase is only by a factor of ∼1.2 and cannot overcome the effect of ion-neutral damping.
4.2. Cosmic-ray spectra and diffusion coefficient
The spectrum of runaway CRs and the corresponding self-generated turbulence depend significantly on the distance from the source and on the time. In Figs. 5 and 6 we show the spectrum of CRs that have already escaped to a distance of 50 pc from the center of the remnant at different times, from t = 6 × 10³ yr to t = 105 yr, and for the WNM (f = 0.05, χ = 0.1) and the WIM (f = 0.9, χ = 0.1), respectively. To remove the effect of the simple 1D geometry that we adopted, we multiplied PCR by  . For each case, we also show the ratio of the self-generated and of the background diffusion coefficients.
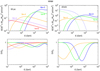 |
Fig. 5. Case of WNM (f = 0.05, χ = 0.1): CR spectrum and ratio D/D0 as a function of energy, where D0(E) = 1028(E/10 GeV)0.5 cm2 s−1. The different colors refer to different ages in yr (as marked). Left panels: refer to a location at 50 pc from the center of the SNR, and right panels: refer to the shock position. In this case, the spectrum of CRs that are still confined in the accelerator is also shown (dashed lines). |
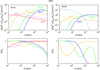 |
Fig. 6. Case of WIM (f = 0.9, χ = 0.1): CR spectrum and ratio D/D0 as a function of energy, where D0(E) = 1028(E/10 GeV)0.5 cm2 s−1. The different colors refer to different ages in yr (as marked). Left panels: refer to a location at 50 pc from the center of the SNR, and right panels: refer to the shock position. In this case, the spectrum of CRs that are still confined in the accelerator is also shown (dashed lines). |
In the same figures we also show the spectrum and diffusion coefficient at the position of the shock of CRs that have escaped at earlier times (and are considered as decoupled from the accelerator), as well as the spectrum of a particle that is still confined to the accelerator, at different ages of the remnant from t = 6 × 10³ yr to t = 3 × 10⁴ yr. The spectrum of the confined particles was estimated by assuming that the remnant provides ≈1050 erg in CRs with a ∝E−2 spectrum that extends from ∼1 GeV to ∼5 PeV, with an exponential cutoff at the energy of the particles that escape at the considered age. The SNR was assumed to stop accelerating particles at the onset of the radiative phase, which for the typical density of the WIM and WNM takes place at trad ≈ 3 × 10⁴ yr. The corresponding shock radius is Rrad ≈ 22 pc. In all cases and at each time and location, the spectrum exhibits a sharp rise at low energies and a peak followed by a nearly power-law-like behavior at higher energies.
Because high-energy particles escape earlier and diffuse faster, they reach a given distance at earlier times, as shown for the spectra at 50 pc, where the peak moves at lower energies with time. At energies lower than the peak, particles have not yet reached that position, which results in the sharp rise. At higher energies, particles have diffused over a larger distance, which causes a spectrum that is steeper than the spectrum that was released from the SNR, here assumed to be ∝E−2.
A similar behavior is observed for the spectra at the shock. Here the position at which the spectra are shown varies with time because it is given by the shock radius at a given age. This radius is always < 50 pc for the cases illustrated here. When we compare the spectra at the shock and at 50 pc for a given age, it is evident that the peak occurs at a lower energy in the first case. This is again the result of an earlier escape and faster diffusion of high-energy particles.
It is possible to infer from the plots for the D/D0 ratio as a function of energy that at a given time, the diffusion coefficient is equal to its background value at low energies, where particles have not yet escaped or have not yet reached the position at which D is calculated, and at high energies, where the turbulence produced by this particle is being damped. At intermediate energies, and roughly corresponding to the peak in the spectrum, the diffusion coefficient is suppressed compared to D0 by the CR streaming instability. The energies at which the suppression is evident move to lower values with time.
A more complex situation can be observed in some cases, for instance, at t = 104 yr at the shock and in the TeV range, for the WIM. Here D starts to deviate from D0 at ∼50 GeV, then, above ∼500 GeV, D begins to approach again D0, but above ∼3 TeV the level of turbulence increases again, with the result of a suppression of D. This is due to the energy dependence of the escape radius, which becomes steeper above few TeV. This results in the fact that, above that energy, the escape radius becomes small enough as to effectively excite the streaming instability. In fact the density of runaway CRs is  . The more efficient self-confinement at this high energies also results in a hardening of the spectrum (see also Nava et al. 2019 for a discussion).
4.3. Residence time and grammage
The grammage accumulated by CRs close to their sources and its relevance compared to the grammage accumulated while CRs are diffused in the whole Galaxy is related to the residence time in the proximity of the source. A formal determination of the grammage should be done by solving the CR transport equation for nuclei with the inclusion of spallation contributions (see, e.g., Berezinskii et al. 1990; Ptuskin & Soutoul 1990).
Here we adopted the following approach: We assumed that N0 particles of energy E are instantly injected by a source located in a region of constant gas density ρ = μmpn and are subject to free escape at a boundary located at a distance Lc from the source. At a given time t, the total number of particles that are still in the region is Nin(t), and the number of escaped particles is Nesc = N0 − Nin(t). Particles that cross the boundary at time t have accumulated the grammage X(t) = ρct and the average grammage gained by all escaped particles from t = 0 to t = ∞ is
![Mathematical equation: $$ \begin{aligned} \langle X \rangle&= \frac{1}{N_0} \int _0^{\infty } \rho ct \frac{\mathrm{d}N_{\rm esc}}{\mathrm{d}t}\,\mathrm{d}t \\&= \frac{\rho c}{N_0}\left[\int _0^{\infty } N_{\rm in}(t)\,\mathrm{d}t - \lim _{t \longrightarrow \infty } (t\, N_{\rm in}(t))\right]\nonumber \\&= \rho \,c\,\tau _{\rm res}.\nonumber \end{aligned} $$](/articles/aa/full_html/2022/04/aa42558-21/aa42558-21-eq47.gif) (27)
(27)
The residence time τres is
![Mathematical equation: $$ \begin{aligned} \tau _{\rm res} = \frac{1}{N_0}\left[ \int _0^{\infty } N_{\rm in}(t)\, \mathrm{d}t - \lim _{t \longrightarrow \infty } (t\, N_{\rm in}(t))\right]. \end{aligned} $$](/articles/aa/full_html/2022/04/aa42558-21/aa42558-21-eq48.gif) (28)
(28)
The number of particles with a given energy contained in the region at a given time can be calculated from the CR pressure (see Sect. 3),
 (29)
(29)
where we took into account that CRs with an energy E are initially released from a region of size Resc(E).
Figures 3 and 4 show the residence time (right axis of the right panel) of CRs in a region of ∼100 pc around the remnant for the WNM and the WIM, respectively, and for different values of the neutral fraction. The corresponding grammage is reported on the left axis and is compared to that accumulated during CR Galactic propagation as estimated by Ptuskin et al. (2009) and Evoli et al. (2019).
Even in the (not very plausible) case of a fully ionized WIM (f = 1.0, χ = 0.0), the grammage is nearly two orders of magnitudes smaller than that accumulated in the disk (see, e.g., Jones et al. 2001; Ptuskin et al. 2009; Gabici et al. 2019; Evoli et al. 2019). This is due to the action of the ion-neutral and FG damping. The presence of a ∼10% of neutral helium (which is less effective at wave damping than hydrogen) noticeably reduces the CR residence time compared to the case of a fully ionized background medium, above few tens GeV.
These results are at odds with what was previously suggested by D’Angelo et al. (2016), namely that ion-neutral damping is totally negligible in the case of only neutral helium because the ce cross section is very small. However, as shown in Sect. 2, not only ce, but also mt has to be taken into account in the ion-neutral damping. D’Angelo et al. (2016) reported a grammage that is nearly a factor of ten larger than what we find. This is in part due to their assumption of ion-neutral damping of waves with neutral helium. In addition, they assumed a 20% acceleration efficiency, while we assumed 10%, which enhances the effect of streaming instability, and they did not include FG damping. Finally, D’Angelo et al. (2016) assumed that CRs at all energies are released when the SNR radius is 20 pc. This scenario implies a smaller release radius at low energies than in our calculation, which translates into an enhancement of the streaming instability (and the CR confinement) at energies below ≈1 TeV, as shown in Fig. 4.
Any addition of neutral hydrogen compared to the case of only neutral helium further reduces the confinement time. Correspondingly, the CR grammage accumulated in the source proximity is well below that inferred from observations. A similar result was found by Nava et al. (2019) for the HIM, where the residence time tends to be lower than in a partially ionized medium, but the ISM density is lower (∼0.01 cm−3).
4.4. Source contribution to the boron-to-carbon ratio
The estimate of the CR residence time and grammage in the source region presented above indicates that the contribution of CR self-confinement around SNRs to the production of secondaries is negligible in the considered phases, namely in the WIM and WNM. Nava et al. (2019) have shown that this is also the case in the hot ionized phase. Here we provide an order-of-magnitude estimate of this contribution to the B/C ratio. For simplicity, we assumed that boron is produced solely by the spallation of carbon (e.g., we neglected the contribution of oxygen) both around the source and during the propagation in the Galaxy.
For the spallation cross section of boron and carbon, we adopted the following parameterization (see Blasi 2017, and references therein):
 (30)
(30)
where σA is the total spallation cross section for an atom with mass A, and σAA′ is the cross section for spallation of an atom with mass A to an atom with mass A′. In the case of boron and carbon, we adopted bCB = 0.28 (Blasi 2017). The corresponding spallation timescale is
 (31)
(31)
where i = C(B) for the total spallation cross section for carbon (boron) and i = CB for the spallation of carbon to boron.
4.4.1. Boron-to-carbon ratio in the source region
According to Eq. (31), the typical spallation timescale in a region with density ∼0.35 cm−3 (typical of a warm medium) is  yr, which is much longer than the typical residence time of CRs in the source region. Under this condition, carbon (and also boron) is not much affected by spallation in the source region (superscript S) and produces boron with a B/C ratio given by
 (32)
(32)
where τres is shown in Figs. 3 and 4 for the WNM and WIM, respectively.
Even in the most optimistic case of a fully ionized WIM (Fig. 3),  , while the data shown in Fig. 7 indicate ηB/C(10 GV)∼0.23. Moreover, the grammage accumulated around the source decreases quite steeply with particle rigidity, as shown in Figs. 3 and 4, which makes the contribution of boron produced around sources negligible at higher energies as well. This is shown more quantitatively in the next section.
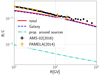 |
Fig. 7. Estimated B/C from Galactic propagation (dashed blue line) and from self-confinement in the source region (dash-dotted cyan line). The total B/C ratio (solid red line) is qualitatively compared to PAMELA (Adriani et al. 2014) and AMS02 data (Aguilar et al. 2016). |
4.4.2. Boron-to-carbon ratio after propagation in the Galaxy
Following a standard approach (see, e.g., Blasi 2017), Galactic propagation is modeled assuming that sources are embedded in a thin disk with a half-thickness h ∼ 150 pc and gas density nd ∼ 1 cm−3. Spallation is assumed to take place in the disk, while CRs propagate diffusively, with a rigidity-dependent diffusion coefficient D(R), in a halo of vertical size H ∼ 4 kpc and free-escape to infinity at the outer edge of the halo. The CR transport in this region is assumed to be one-dimensional and dependent on the distance z from the Galactic disk.
In this scenario, the transport equation for carbon is
 (33)
(33)
where fC is the carbon distribution function,  is the injection spectrum from SNRs, and the last term in the equation describes spallation in the Galactic disk.
The solution for this equation for z ≠ 0 and free escape boundary at z = H reads
 (34)
(34)
where  is the carbon distribution in the disk (z = 0). The latter can be computed by integrating around the disk (between z = 0− and z = 0+) and using Eq. (34), which gives
 (35)
(35)
This equation can be rewritten in a more convenient form by introducing the timescale of diffusive escape from the Galaxy, τesc = H2/D,
 (36)
(36)
For boron, the transport equation is formally equal to that of carbon,
 (37)
(37)
where the source term qB has two contributions,
 (38)
(38)
the first of which is due to the propagation in the source region, and the second reflects the propagation in the Galaxy. The solution for the boron distribution in the disk can thus be written in analogy to that of carbon, and reads
 (39)
(39)
The total B/C ratio,  , is then
![Mathematical equation: $$ \begin{aligned} \eta _{\rm B/C} = \left[\eta _{\rm BC}^S \left(\frac{1}{\tau _{\rm esc}} + \frac{h}{H}\frac{1}{\tau _{\rm sp}^\mathrm{C}} \right) + \frac{h}{H}\frac{1}{\tau _{\rm sp}^\mathrm{CB}}\right] \left(\frac{1}{\tau _{\rm esc}} + \frac{h}{H}\frac{1}{\tau _{\rm sp}^\mathrm{B}}\right)^{-1}. \end{aligned} $$](/articles/aa/full_html/2022/04/aa42558-21/aa42558-21-eq65.gif) (40)
(40)
At high rigidities (above ≈10 GV), escape dominates spallation, hence
 (41)
(41)
Figure 7 shows the contribution to the B/C from propagation around the source in the optimistic case of a fully ionized WIM (orange line in the right panel of Fig. 3), and the contribution due to Galactic propagation. The latter was computed with  cm2 s−1, where RGV is the particle rigidity in units of GV. This value is typically used in models of Galactic CR propagation (see, e.g., Gabici et al. 2019).
Our results are compared with PAMELA (Adriani et al. 2014) and AMS-02 (Aguilar et al. 2016) data for the B/C ratio. The boron production around the sources is totally negligible in the range 10−1000 GV, and most likely also at higher energies.
In contrast, the boron produced in the Galactic disk estimated with our (simplified) model is quite close to the data (underestimated by ≲50%). A better agreement can be obtained when a more refined description of the Galactic diffusion is accounted for and the production of boron from other primary nuclei is included, as was done by Evoli et al. (2019), for example.
5. Conclusions
We followed the method and setup proposed by Nava et al. (2016, 2019) to investigate the escape of CRs from SNRs that are embedded in a WNM and WIM, and the CR self-confinement in the source proximity. Our main objective was to determine whether in realistic situations, the grammage accumulated by CRs in the source region can become comparable to that inferred from observations. In this case, the standard picture of CR propagation in the Galaxy should be profoundly revised.
We confirm the results found by Nava et al. (2016, 2019) that CRs that escape from SNRs drive the excitation of Alfvén waves through the resonant CR streaming instability, which results in a suppression of the diffusion coefficient and in the CR self-confinement in the source region. The SNR radius at which CRs of a given energy leave the source, Resc(E), is a decreasing function of the energy and regulates the CR streaming instability through a dilution factor  .
.
We found that the growth of self-generated Alfvén waves, and consequently, the residence time of CRs in the source region, is significantly limited by several damping processes, especially by the FG and ion-neutral damping. In particular, for the ion-neutral damping of Alfvén waves, we used the most recent damping coefficients, based on accurate experimental or theoretical determinations of the mt and ce cross sections between ions and neutrals of different species.
In the one-dimensional geometry adopted in our calculation, a suppression of the diffusion coefficient is found within a distance form the source of about the magnetic field coherence length Lc ≈ 50−100 pc for a timescale that can be as long as ∼105 yr at ∼10 GeV. A lower value for Lc would cause the CR propagation to become three-dimensional closer to the remnant, thus reducing the residence time compared to our results.
We conclude that ion-neutral and FG damping strongly limits the CR grammage that can be accumulated in the source region. For typical conditions in the WIM and WNM of the Galactic disk, the CR source grammage is found to be negligible compared to that inferred form observation. A similar result was found for the HIM by Nava et al. (2019), who reported that the CR residence time is typically longer than in a partially ionized medium, but that the ISM density is lower by more than a factor of ten. This makes alternative scenarios for the interpretation of quantities such as the B/C ratio less attractive, where an important contribution to the production of secondaries comes from the source region.
Our results for the residence time (and grammage) may change when the contribution of other sources of turbulence is included in the CR confinement. In particular, it has recently been suggested that another CR-induced instability, the so called nonresonant streaming instability (Bell 2004), which is mediated by the CR current and plays a crucial role in the acceleration of CRs, may significantly enhance the CR self-confinement in the source region above ∼TeV energies (Schroer et al. 2021). Further investigations are thus needed in order to firmly establish the amount of CR grammage that accumulates in the vicinity of sources by very-high energy particles.
The case of a fully neutral (atomic or partially molecular) medium and of a diffuse molecular medium (see, e.g., Brahimi et al. 2020) are not treated here because the filling factor of these phases is small, but we report the ion-neutral damping rate for these media for the sake of completeness. The case of a fully ionized medium has been extensively treated by Nava et al. (2019).
To be precise, the dispersion relation Eq. (4) is valid only if the friction force is proportional to the ion-neutral relative speed un − ui, as in the case of momentum transfer by elastic collisions. However, we use the same relation also in the case of charge exchange and replace ⟨σmtv⟩in with ⟨σcev⟩in.
References
- Adriani, O., Barbarino, G. C., Bazilevskaya, G. A., et al. 2014, ApJ, 791, 93 [NASA ADS] [CrossRef] [Google Scholar]
- Aguilar, M., Ali Cavasonza, L., Ambrosi, G., et al. 2016, Phys. Rev. Lett., 117, 231102 [NASA ADS] [CrossRef] [Google Scholar]
- Aharonian, F. A., & Atoyan, A. M. 1996, A&A, 309, 917 [Google Scholar]
- Amato, E. 2011, Mem. Soc. Astron. It., 82, 806 [NASA ADS] [Google Scholar]
- Bell, A. R. 2004, MNRAS, 353, 550 [Google Scholar]
- Berezinskii, V. S., Bulanov, S. V., Dogiel, V. A., & Ptuskin, V. S. 1990, Astrophysics of Cosmic Rays (Amsterdam: North-Holland) [Google Scholar]
- Blasi, P. 2013, A&ARv, 21, 70 [Google Scholar]
- Blasi, P. 2017, MNRAS, 471, 1662 [NASA ADS] [CrossRef] [Google Scholar]
- Brahimi, L., Marcowith, A., & Ptuskin, V. S. 2020, A&A, 633, A72 [NASA ADS] [CrossRef] [EDP Sciences] [Google Scholar]
- Brennan, M. H., & Morrow, R. 1971, J. Phys. B, 4, L53 [NASA ADS] [CrossRef] [Google Scholar]
- Casanova, S., Jones, D. I., Aharonian, F. A., et al. 2010, PASJ, 62, 1127 [NASA ADS] [CrossRef] [Google Scholar]
- Casse, F., Lemoine, M., & Pelletier, G. 2002, Phys. Rev. D, 65, 023002 [Google Scholar]
- Cesarsky, C. J. 1980, ARA&A, 18, 289 [NASA ADS] [CrossRef] [Google Scholar]
- Chevalier, R. A. 1982, ApJ, 258, 790 [NASA ADS] [CrossRef] [Google Scholar]
- Cho, J., & Lazarian, A. 2002, Phys. Rev. Lett., 88, 245001 [Google Scholar]
- Cioffi, D. F., McKee, C. F., & Bertschinger, E. 1988, ApJ, 334, 252 [Google Scholar]
- Cowsik, R., & Madziwa-Nussinov, T. 2016, ApJ, 827, 119 [NASA ADS] [CrossRef] [Google Scholar]
- Dalgarno, A. 1958, Phil. Trans. R. Soc. London A, 250, 426 [CrossRef] [Google Scholar]
- D’Angelo, M., Blasi, P., & Amato, E. 2016, Phys. Rev. D, 94, 083003 [CrossRef] [Google Scholar]
- Draine, B. T. 1986, MNRAS, 220, 133 [NASA ADS] [Google Scholar]
- Drury, L. O. 1983, Rep. Progr. Phys., 46, 973 [Google Scholar]
- Evoli, C., Aloisio, R., & Blasi, P. 2019, Phys. Rev. D, 99, 103023 [CrossRef] [Google Scholar]
- Farmer, A. J., & Goldreich, P. 2004, ApJ, 604, 671 [NASA ADS] [CrossRef] [Google Scholar]
- Felice, G. M., & Kulsrud, R. M. 2001, ApJ, 553, 198 [NASA ADS] [CrossRef] [Google Scholar]
- Ferrière, K. 2019, Plasma Phys. Control. Fusion, 62, 014014 [Google Scholar]
- Ferrière, K. M. 2001, Rev. Mod. Phys., 73, 1031 [NASA ADS] [CrossRef] [Google Scholar]
- Flower, D. R., & Pineau des Forets, G. 1995, MNRAS, 275, 1049 [NASA ADS] [CrossRef] [Google Scholar]
- Fornieri, O., Gaggero, D., Cerri, S. S., De La Torre Luque, P., & Gabici, S. 2021, MNRAS, 502, 5821 [NASA ADS] [CrossRef] [Google Scholar]
- Gabici, S. 2011, Mem. Soc. Astron. It., 82, 760 [NASA ADS] [Google Scholar]
- Gabici, S., Aharonian, F. A., & Casanova, S. 2009, MNRAS, 396, 1629 [Google Scholar]
- Gabici, S., Krause, J., Morlino, G., & Nava, L. 2015, Eur. Phys. J. Web Conf., 105, 02001 [NASA ADS] [CrossRef] [EDP Sciences] [Google Scholar]
- Gabici, S., Evoli, C., Gaggero, D., et al. 2019, Int. J. Mod. Phys. D, 28, 1930022 [CrossRef] [Google Scholar]
- Glassgold, A. E., Krstić, P. S., & Schultz, D. R. 2005, ApJ, 621, 808 [NASA ADS] [CrossRef] [Google Scholar]
- Goffe, T. V., Shah, M. B., & Gilbody, H. B. 1979, J. Phys. B, 12, 3763 [NASA ADS] [CrossRef] [Google Scholar]
- Hodges, R. R., & Breig, E. L. 1991, J. Geophys. Res., 96, 7697 [NASA ADS] [CrossRef] [Google Scholar]
- Jean, P., Gillard, W., Marcowith, A., & Ferrière, K. 2009, A&A, 508, 1099 [NASA ADS] [CrossRef] [EDP Sciences] [Google Scholar]
- Jones, F. C., Lukasiak, A., Ptuskin, V., & Webber, W. 2001, ApJ, 547, 264 [Google Scholar]
- Krstić, P. S., & Schultz, D. R. 1999, J. Phys. B, 32, 3485 [CrossRef] [Google Scholar]
- Krstić, P. S., & Schultz, D. R. 2006, Phys. Plasmas, 13, 053501 [CrossRef] [Google Scholar]
- Kulsrud, R. M. 1978, in Astronomical Papers Dedicated to Bengt Stromgren, eds. A. Reiz, & T. Andersen, 317 [Google Scholar]
- Kulsrud, R. M. 2005, Plasma Physics for Astrophysics (Princeton: Princeton University Press) [Google Scholar]
- Kulsrud, R. M., & Cesarsky, C. J. 1971, Astrophys. Lett., 8, 189 [NASA ADS] [Google Scholar]
- Kulsrud, R., & Pearce, W. P. 1969, ApJ, 156, 445 [NASA ADS] [CrossRef] [Google Scholar]
- Kusakabe, T., Sakaue, H. A., & Tawara, H. 2011, Plasma Fus. Res., 6, 2401102 [NASA ADS] [CrossRef] [Google Scholar]
- Lazarian, A. 2016, ApJ, 833, 131 [NASA ADS] [CrossRef] [Google Scholar]
- Lipari, P. 2019, ArXiv e-prints [arXiv:1902.06173] [Google Scholar]
- Loreau, J., Ryabchenko, S., Burgos, J. M. M., & Vaeck, N. 2018, J. Phys. B, 51, 085205 [NASA ADS] [CrossRef] [Google Scholar]
- Mac Low, M.-M., & Klessen, R. S. 2004, Rev. Mod. Phys., 76, 125 [Google Scholar]
- Malkov, M. A., Diamond, P. H., Sagdeev, R. Z., Aharonian, F. A., & Moskalenko, I. V. 2013, ApJ, 768, 73 [NASA ADS] [CrossRef] [Google Scholar]
- Martin, P. J., Arnett, K., Blankenship, D. M., et al. 1981, Phys. Rev. A, 23, 2858 [NASA ADS] [CrossRef] [Google Scholar]
- Mertsch, P., Vittino, A., & Sarkar, S. 2021, Phys. Rev. D, 104, 103029 [NASA ADS] [CrossRef] [Google Scholar]
- Nava, L., & Gabici, S. 2013, MNRAS, 429, 1643 [NASA ADS] [CrossRef] [Google Scholar]
- Nava, L., Gabici, S., Marcowith, A., Morlino, G., & Ptuskin, V. S. 2016, MNRAS, 461, 3552 [NASA ADS] [CrossRef] [Google Scholar]
- Nava, L., Recchia, S., Gabici, S., et al. 2019, MNRAS, 484, 2684 [NASA ADS] [CrossRef] [Google Scholar]
- Newman, J. H., Cogan, J. D., Ziegler, D. L., et al. 1982, Phys. Rev. A, 25, 2976 [NASA ADS] [CrossRef] [Google Scholar]
- Ohira, Y., Murase, K., & Yamazaki, R. 2011, MNRAS, 410, 1577 [NASA ADS] [Google Scholar]
- Phaneuf, R. A., Meyer, F. W., & McKnight, R. H. 1978, Phys. Rev. A, 17, 534 [NASA ADS] [CrossRef] [Google Scholar]
- Piddington, J. H. 1956, MNRAS, 116, 314 [Google Scholar]
- Pinto, C., & Galli, D. 2008, A&A, 484, 17 [NASA ADS] [CrossRef] [EDP Sciences] [Google Scholar]
- Ptuskin, V. S., & Soutoul, A. 1990, A&A, 237, 445 [NASA ADS] [Google Scholar]
- Ptuskin, V. S., & Soutoul, A. 1998, Space Sci. Rev., 86, 225 [NASA ADS] [CrossRef] [Google Scholar]
- Ptuskin, V. S., Zirakashvili, V. N., & Plesser, A. A. 2008, Adv. Space Res., 42, 486 [NASA ADS] [CrossRef] [Google Scholar]
- Ptuskin, V., Strelnikova, O., & Sveshnikova, L. 2009, Astropart. Phys., 31, 284 [NASA ADS] [CrossRef] [Google Scholar]
- Reville, B., Giacinti, G., & Scott, R. 2021, MNRAS, 502, 4137 [NASA ADS] [CrossRef] [Google Scholar]
- Schroer, B., Pezzi, O., Caprioli, D., Haggerty, C., & Blasi, P. 2021, ApJ, 914, L13 [NASA ADS] [CrossRef] [Google Scholar]
- Schultz, D. R., Krstic, P. S., Lee, T. G., & Raymond, J. C. 2008, ApJ, 678, 950 [NASA ADS] [CrossRef] [Google Scholar]
- Schultz, D. R., Ovchinnikov, S. Y., Stancil, P. C., & Zaman, T. 2016, J. Phys. B, 49, 084004 [NASA ADS] [CrossRef] [Google Scholar]
- Shah, M. B., & Gilbody, H. B. 1985, J. Phys. B, 18, 899 [NASA ADS] [CrossRef] [Google Scholar]
- Shah, M. B., McCallion, P., & Gilbody, H. B. 1989, J. Phys. B, 22, 3037 [NASA ADS] [CrossRef] [Google Scholar]
- Skilling, J. 1975a, MNRAS, 172, 557 [CrossRef] [Google Scholar]
- Skilling, J. 1975b, MNRAS, 173, 255 [NASA ADS] [CrossRef] [Google Scholar]
- Squire, J., Hopkins, P. F., Quataert, E., & Kempski, P. 2021, MNRAS, 502, 2630 [NASA ADS] [CrossRef] [Google Scholar]
- Stancil, P. C., Gu, J. P., Havener, C. C., et al. 1998, J. Phys. B, 31, 3647 [NASA ADS] [CrossRef] [Google Scholar]
- Strong, A. W., Moskalenko, I. V., & Ptuskin, V. S. 2007, Annu. Rev. Nucl. Part. Sci., 57, 285 [NASA ADS] [CrossRef] [Google Scholar]
- Truelove, J. K., & McKee, C. F. 1999, ApJS, 120, 299 [Google Scholar]
- Wentzel, D. G. 1974, ARA&A, 12, 71 [NASA ADS] [CrossRef] [Google Scholar]
- Wiedenbeck, M. E., Binns, W. R., Cummings, A. C., et al. 2007, Space Sci. Rev., 130, 415 [NASA ADS] [CrossRef] [Google Scholar]
- Wiener, J., Zweibel, E. G., & Oh, S. P. 2013, ApJ, 767, 87 [NASA ADS] [CrossRef] [Google Scholar]
- Xu, S., Lazarian, A., & Yan, H. 2015, ApJ, 810, 44 [NASA ADS] [CrossRef] [Google Scholar]
- Xu, S., Yan, H., & Lazarian, A. 2016, ApJ, 826, 166 [Google Scholar]
- Yan, H., & Lazarian, A. 2004, ApJ, 614, 757 [NASA ADS] [CrossRef] [Google Scholar]
- Zweibel, E. G., & Shull, J. M. 1982, ApJ, 259, 859 [NASA ADS] [CrossRef] [Google Scholar]
Appendix A: Collisional coefficients
A.1. Collisions of H+ with H and He atoms
In the WNM and WIM, the relevant damping processes for Alfvén waves are collisions of H+ with either H or He atoms. The case of H+– H collisions is special because the proton that is elastically scattered by the H atom is indistinguishable from the recoiling proton that is produced by charge exchange (Krstić & Schultz 1999; Glassgold et al. 2005; Schultz et al. 2008, 2016). Therefore, the elastic scattering and the charge exchange channels for collisions of H+ with H, as for any collision between ions and their parent gas, cannot be separated in general. Only at collision energies Ecm ≳ 1 eV can the forward elastic and the backward charge exchange be approximately separated. In this limit, σmt ≈ 2σce (Dalgarno 1958), a frequently used approximation (see, e.g., Kulsrud & Cesarsky 1971).
Figure A.1 shows the m.t. cross section for H+– H collisions (Krstić & Schultz 1999; Glassgold et al. 2005) and the corresponding rate coefficient. The figure also shows the m.t. cross sections and rate coefficients derived from either charge exchange and elastic scattering in the distinguishable particle approach (Schultz et al. 2008, 2016), and the experimental determination of the m.t. cross section obtained by Brennan & Morrow (1971) by measuring the attenuation of Alfvén waves propagating in a partially ionized hydrogen plasma at Ecm ≈ 5 eV. Figure A.1 also shows the rate coefficients used by Kulsrud & Cesarsky (1971) and Zweibel & Shull (1982) that are also frequently adopted for other species by scaling the collision rate with the ratio mn/mi of the neutral and ion masses (see, e.g., (Zweibel & Shull 1982)). As shown in the following, this approximation is not generally correct because the rate coefficients in the case of other species exhibit a different dependence on the temperature than the H+– H collisions case.
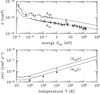 |
Fig. A.1. Top panel: cross sections for collisions of H+ with H vs. collision energy in the center-of-mass frame Ecm. Momentum transfer cross section from Krstić & Schultz (1999), Glassgold et al. (2005), and Schultz et al. (2008), and charge-exchange cross section from Hodges & Breig (1991) and Schultz et al. (2008). Dashed line: Langevin m.t. cross section. Experimental data for the c.e. cross section: Newman et al. (1982) (filled triangles). The empty circle shows the value of the m.t. cross section measured by Brennan & Morrow (1971). Bottom panel: Collisional rate coefficient for momentum transfer and charge exchange. The filled and empty circles show the rate coefficient adopted by Kulsrud & Cesarsky (1971) and Zweibel & Shull (1982), respectively. |
Figure A.2 shows the m.t. (Krstić & Schultz 1999, 2006) and c.e. (Loreau et al. 2018) cross sections for H+– He collisions and the corresponding rate coefficients. Charge exchange contributes to the transfer of momentum above collision energies ∼103 eV, corresponding to relative velocities of ∼500 km s−1, which is much higher than typical thermal or Alfvén speeds in the WNM and WIM.
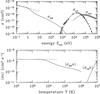 |
Fig. A.2. Top panel: Cross sections for collisions of H+ with He vs. collision energy in the center-of-mass frame Ecm. Momentum transfer cross section from Krstić & Schultz (1999, 2006), Langevin m.t. cross section (dashed line), charge exchange cross section from Loreau et al. (2018), and and ionization cross section from Shah & Gilbody (1985). Experimental data for the c.e. cross section: Martin et al. (1981) (empty triangles), Shah & Gilbody (1985) (filled triangles), Shah et al. (1989) (empty squares), and Kusakabe et al. (2011) (filled squares). Experimental data for the ionization cross section: Shah & Gilbody (1985) (empty circles). Bottom panel: Collisional rate coefficient for Langevin m.t. (dashed line), and for m.t. and c.e. (solid lines). |
A.2. Collisions of C+ with H and He atoms
In the CNM and DiM, ion-neutral damping is dominated by the collisions between neutral hydrogen and ionized carbon. Figure A.3 shows the cross sections and reaction rates for m.t. and c.e. in the case of collisions of C+ ions with H atoms. For collisions of C+ ions with He atoms, no theoretical or experimental are available. The m.t. transfer rate coefficient, according to the Langevin theory, is ⟨σmtv⟩C+, He = 1.33 × 10⁻⁹ cm3 s−1 (Pinto & Galli 2008). As in the case of H+– He collisions, the large difference with the rate coefficients used in this work resides in the assumption that the rate coefficient is the same for all species.
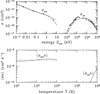 |
Fig. A.3. Top panel: Cross sections for collisions of C+ with H vs. collision energy in the center-of-mass frame Ecm: m.t. cross section computed by Flower & Pineau des Forets (1995) (filled triangles), fit from Pinto & Galli (2008) (solid line), and Langevin m.t. cross section (dashed line). Experimental data for the c.e. cross section: Phaneuf et al. (1978) (empty circles), Goffe et al. (1979) (empty squares), and Stancil et al. (1998) (filled triangles), and c.e. cross section recommended by Stancil et al. (1998) (solid line). Bottom panel: Collisional rate coefficients: Langevin m.t. (dashed line), and m.t. and c.e. (solid lines). |
All Tables
All Figures
|
Fig. 1. Damping rates |
| In the text | |
|
Fig. 2. Ion-neutral damping rate |
| In the text | |
|
Fig. 3. Case of WNM. Left panel: SNR age tesc (solid lines, left axis) and radius Resc (dashed lines, right axis) at the time of CR escape as a function of CR energy. Right panel: grammage (left axis) accumulated in a region of ∼100 pc around the source as a function of CR energy as deduced from the estimated residence time tres (right axis) in that region. The grammage accumulated during CR Galactic propagation as estimated by Ptuskin et al. (2009) (XP09, olive line) and by Evoli et al. (2019) (XE19, gray line) is also shown. Different colors are used for different values of the hydrogen ionization fraction f, while the helium-to-hydrogen ratio χ = 0.1. The parameters of the WNM are listed in Table 1. |
| In the text | |
|
Fig. 4. Case of WIM. Left panel: SNR age tesc (solid lines, left axis) and radius Resc (dashed lines, right axis) at the time of CR escape as a function of CR energy. Right panel: grammage (left axis) accumulated in a region of ∼100 pc around the source as a function of CR energy as deduced from the estimated residence time tres (right axis) in that region. The grammage accumulated during CR Galactic propagation as estimated by Ptuskin et al. (2009) (XP09, olive line) and by Evoli et al. (2019) (XE19, gray line) is also shown. The cyan curve is computed by assuming that particles of all energies escape at an SNR radius of 20 pc, as assumed by D’Angelo et al. (2016). Different colors are used for different values of the hydrogen ionization fraction f and helium-to-hydrogen ratio χ. The parameters of the WIM are listed in Table 1. |
| In the text | |
|
Fig. 5. Case of WNM (f = 0.05, χ = 0.1): CR spectrum and ratio D/D0 as a function of energy, where D0(E) = 1028(E/10 GeV)0.5 cm2 s−1. The different colors refer to different ages in yr (as marked). Left panels: refer to a location at 50 pc from the center of the SNR, and right panels: refer to the shock position. In this case, the spectrum of CRs that are still confined in the accelerator is also shown (dashed lines). |
| In the text | |
|
Fig. 6. Case of WIM (f = 0.9, χ = 0.1): CR spectrum and ratio D/D0 as a function of energy, where D0(E) = 1028(E/10 GeV)0.5 cm2 s−1. The different colors refer to different ages in yr (as marked). Left panels: refer to a location at 50 pc from the center of the SNR, and right panels: refer to the shock position. In this case, the spectrum of CRs that are still confined in the accelerator is also shown (dashed lines). |
| In the text | |
|
Fig. 7. Estimated B/C from Galactic propagation (dashed blue line) and from self-confinement in the source region (dash-dotted cyan line). The total B/C ratio (solid red line) is qualitatively compared to PAMELA (Adriani et al. 2014) and AMS02 data (Aguilar et al. 2016). |
| In the text | |
|
Fig. A.1. Top panel: cross sections for collisions of H+ with H vs. collision energy in the center-of-mass frame Ecm. Momentum transfer cross section from Krstić & Schultz (1999), Glassgold et al. (2005), and Schultz et al. (2008), and charge-exchange cross section from Hodges & Breig (1991) and Schultz et al. (2008). Dashed line: Langevin m.t. cross section. Experimental data for the c.e. cross section: Newman et al. (1982) (filled triangles). The empty circle shows the value of the m.t. cross section measured by Brennan & Morrow (1971). Bottom panel: Collisional rate coefficient for momentum transfer and charge exchange. The filled and empty circles show the rate coefficient adopted by Kulsrud & Cesarsky (1971) and Zweibel & Shull (1982), respectively. |
| In the text | |
|
Fig. A.2. Top panel: Cross sections for collisions of H+ with He vs. collision energy in the center-of-mass frame Ecm. Momentum transfer cross section from Krstić & Schultz (1999, 2006), Langevin m.t. cross section (dashed line), charge exchange cross section from Loreau et al. (2018), and and ionization cross section from Shah & Gilbody (1985). Experimental data for the c.e. cross section: Martin et al. (1981) (empty triangles), Shah & Gilbody (1985) (filled triangles), Shah et al. (1989) (empty squares), and Kusakabe et al. (2011) (filled squares). Experimental data for the ionization cross section: Shah & Gilbody (1985) (empty circles). Bottom panel: Collisional rate coefficient for Langevin m.t. (dashed line), and for m.t. and c.e. (solid lines). |
| In the text | |
|
Fig. A.3. Top panel: Cross sections for collisions of C+ with H vs. collision energy in the center-of-mass frame Ecm: m.t. cross section computed by Flower & Pineau des Forets (1995) (filled triangles), fit from Pinto & Galli (2008) (solid line), and Langevin m.t. cross section (dashed line). Experimental data for the c.e. cross section: Phaneuf et al. (1978) (empty circles), Goffe et al. (1979) (empty squares), and Stancil et al. (1998) (filled triangles), and c.e. cross section recommended by Stancil et al. (1998) (solid line). Bottom panel: Collisional rate coefficients: Langevin m.t. (dashed line), and m.t. and c.e. (solid lines). |
| In the text | |
Current usage metrics show cumulative count of Article Views (full-text article views including HTML views, PDF and ePub downloads, according to the available data) and Abstracts Views on Vision4Press platform.
Data correspond to usage on the plateform after 2015. The current usage metrics is available 48-96 hours after online publication and is updated daily on week days.
Initial download of the metrics may take a while.