Free Access
Fig. 7.
Download original image
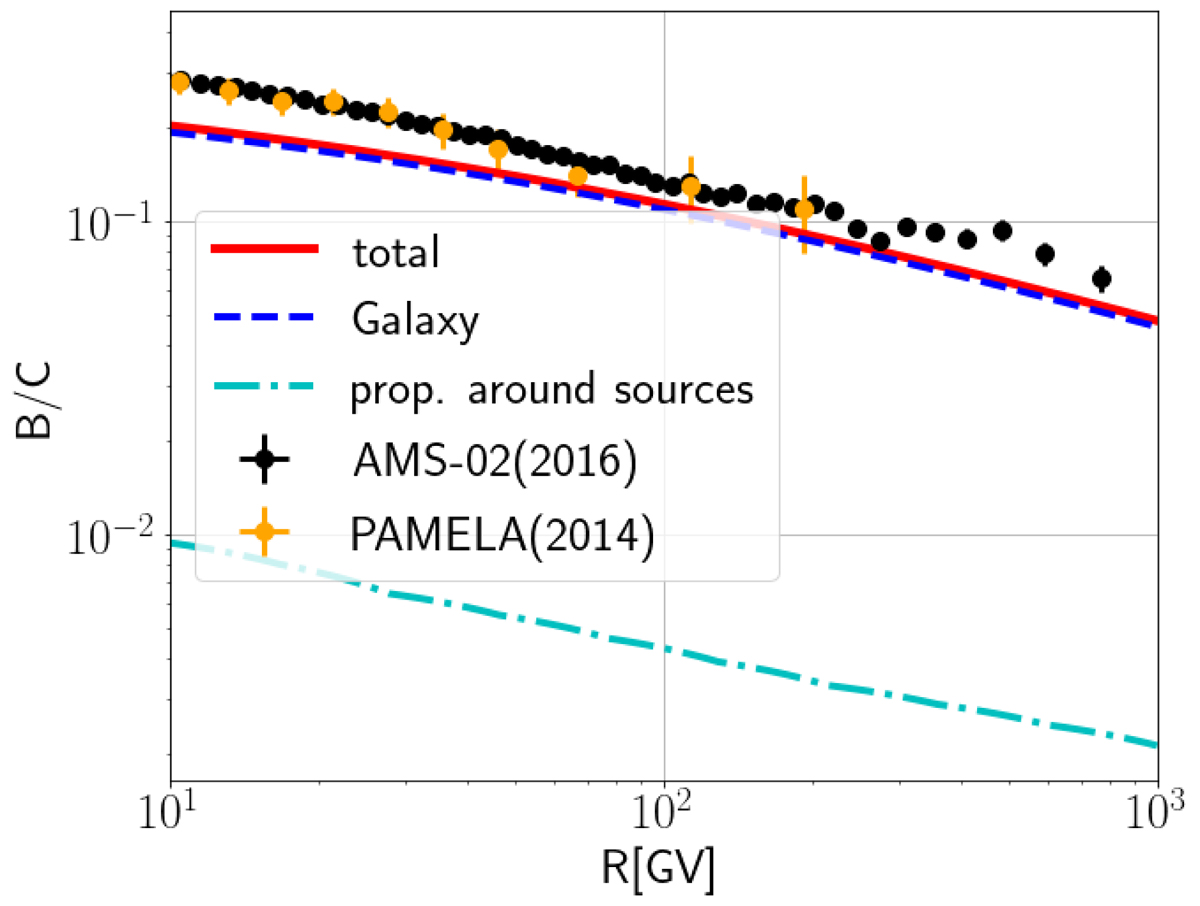
Estimated B/C from Galactic propagation (dashed blue line) and from self-confinement in the source region (dash-dotted cyan line). The total B/C ratio (solid red line) is qualitatively compared to PAMELA (Adriani et al. 2014) and AMS02 data (Aguilar et al. 2016).
Current usage metrics show cumulative count of Article Views (full-text article views including HTML views, PDF and ePub downloads, according to the available data) and Abstracts Views on Vision4Press platform.
Data correspond to usage on the plateform after 2015. The current usage metrics is available 48-96 hours after online publication and is updated daily on week days.
Initial download of the metrics may take a while.