Fig. 4.
Download original image
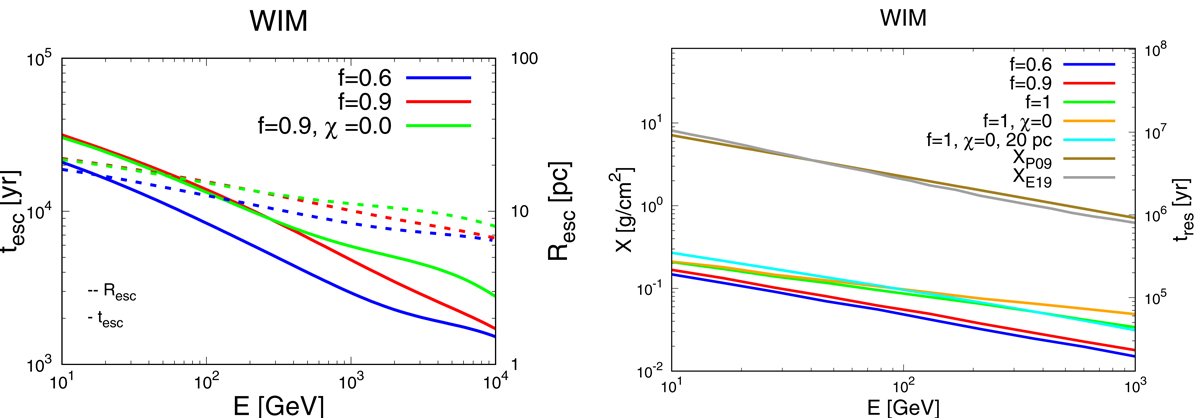
Case of WIM. Left panel: SNR age tesc (solid lines, left axis) and radius Resc (dashed lines, right axis) at the time of CR escape as a function of CR energy. Right panel: grammage (left axis) accumulated in a region of ∼100 pc around the source as a function of CR energy as deduced from the estimated residence time tres (right axis) in that region. The grammage accumulated during CR Galactic propagation as estimated by Ptuskin et al. (2009) (XP09, olive line) and by Evoli et al. (2019) (XE19, gray line) is also shown. The cyan curve is computed by assuming that particles of all energies escape at an SNR radius of 20 pc, as assumed by D’Angelo et al. (2016). Different colors are used for different values of the hydrogen ionization fraction f and helium-to-hydrogen ratio χ. The parameters of the WIM are listed in Table 1.
Current usage metrics show cumulative count of Article Views (full-text article views including HTML views, PDF and ePub downloads, according to the available data) and Abstracts Views on Vision4Press platform.
Data correspond to usage on the plateform after 2015. The current usage metrics is available 48-96 hours after online publication and is updated daily on week days.
Initial download of the metrics may take a while.