Fig. 9
Download original image
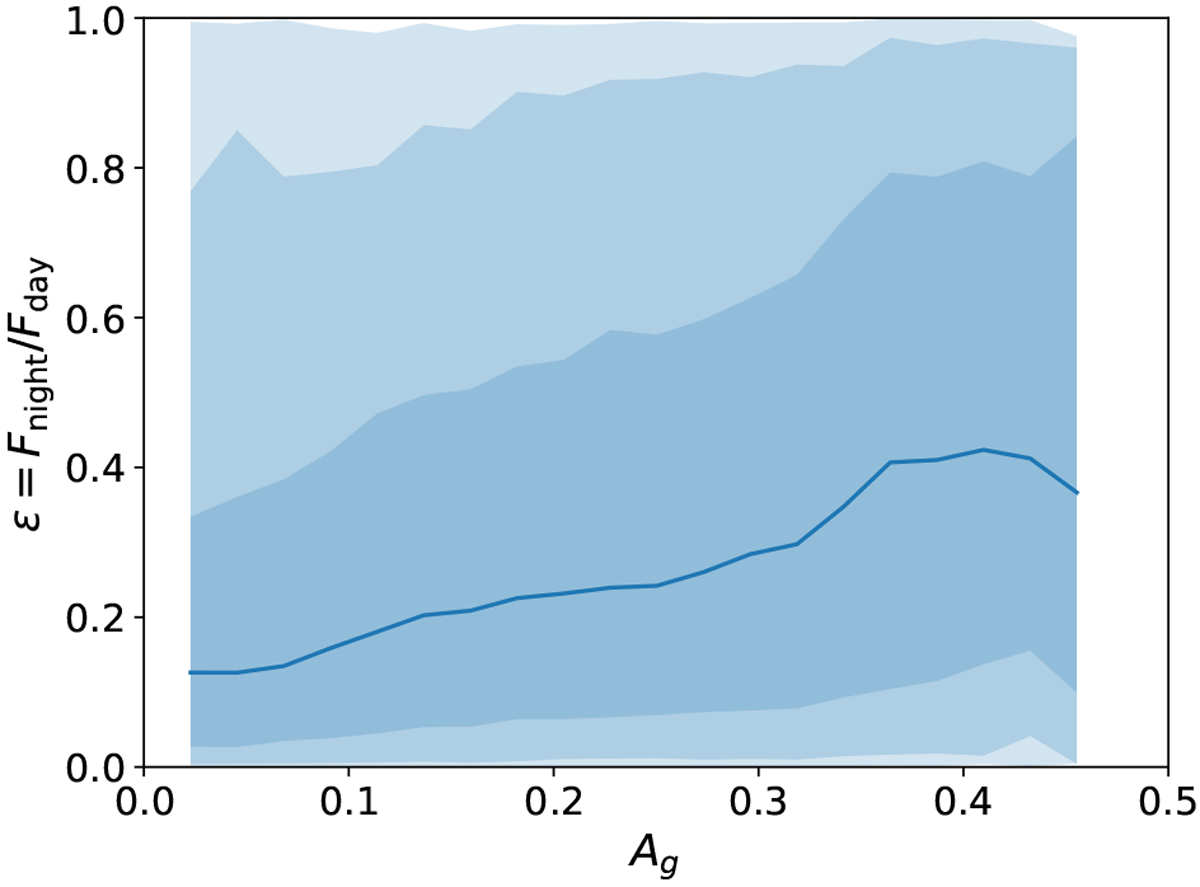
Heat redistribution efficiency ε as a functionof the geometric albedo Ag. The median value of ε is represented by the blue curve and the shaded areas highlight the 1 σ, 2 σ, and 3 σ uncertainty range. The value of ε is computed as the nightside-to-dayside flux ratio measured by CHEOPS. Low values of Ag indicates low reflectivity and a phase-curve amplitude mostly due to thermal emission. The thermal contribution gets smaller for higher Ag where reflected light starts to be important.
Current usage metrics show cumulative count of Article Views (full-text article views including HTML views, PDF and ePub downloads, according to the available data) and Abstracts Views on Vision4Press platform.
Data correspond to usage on the plateform after 2015. The current usage metrics is available 48-96 hours after online publication and is updated daily on week days.
Initial download of the metrics may take a while.