Fig. 7
Download original image
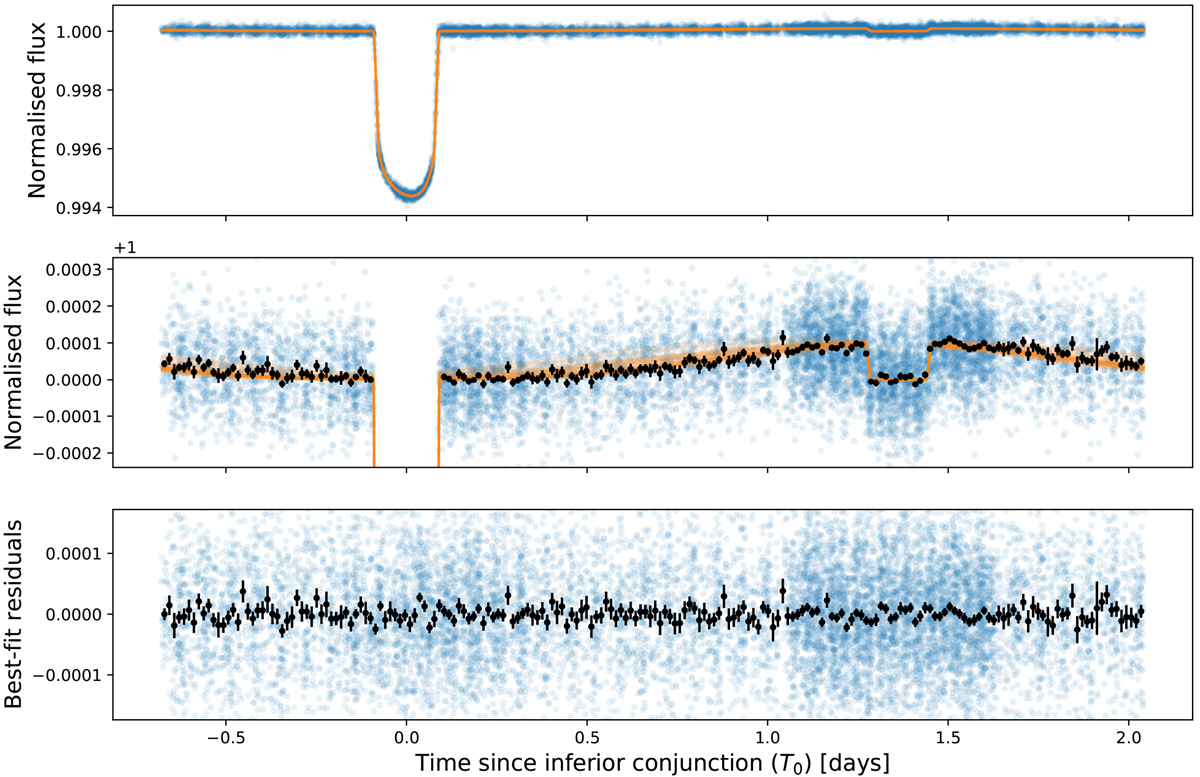
Phase-folded phase curve of WASP-189 b after correction of instrumental systematics and stellar activity. This data set is obtained from a model assuming the planet is a Lambertian reflector and approximating the thermal emission with a sinusoid function. The data points de-trended from all systematics and stellar variability are shown in blue in the two upper panels. The mid-panel shows a zoomed-in view of the upper one to better visualise the phase-curve signal. The lower panel shows the residual after subtraction of the best-fit planet model. The black points represent the binned data with 100 bins per orbital period, which corresponds to a bin duration of about 40 min. The faded orange lines are 100 samples drawn from the posterior probability obtained from the MCMC run, and thus highlight the uncertainty we obtain on the best-fit model.
Current usage metrics show cumulative count of Article Views (full-text article views including HTML views, PDF and ePub downloads, according to the available data) and Abstracts Views on Vision4Press platform.
Data correspond to usage on the plateform after 2015. The current usage metrics is available 48-96 hours after online publication and is updated daily on week days.
Initial download of the metrics may take a while.