Fig. 5
Download original image
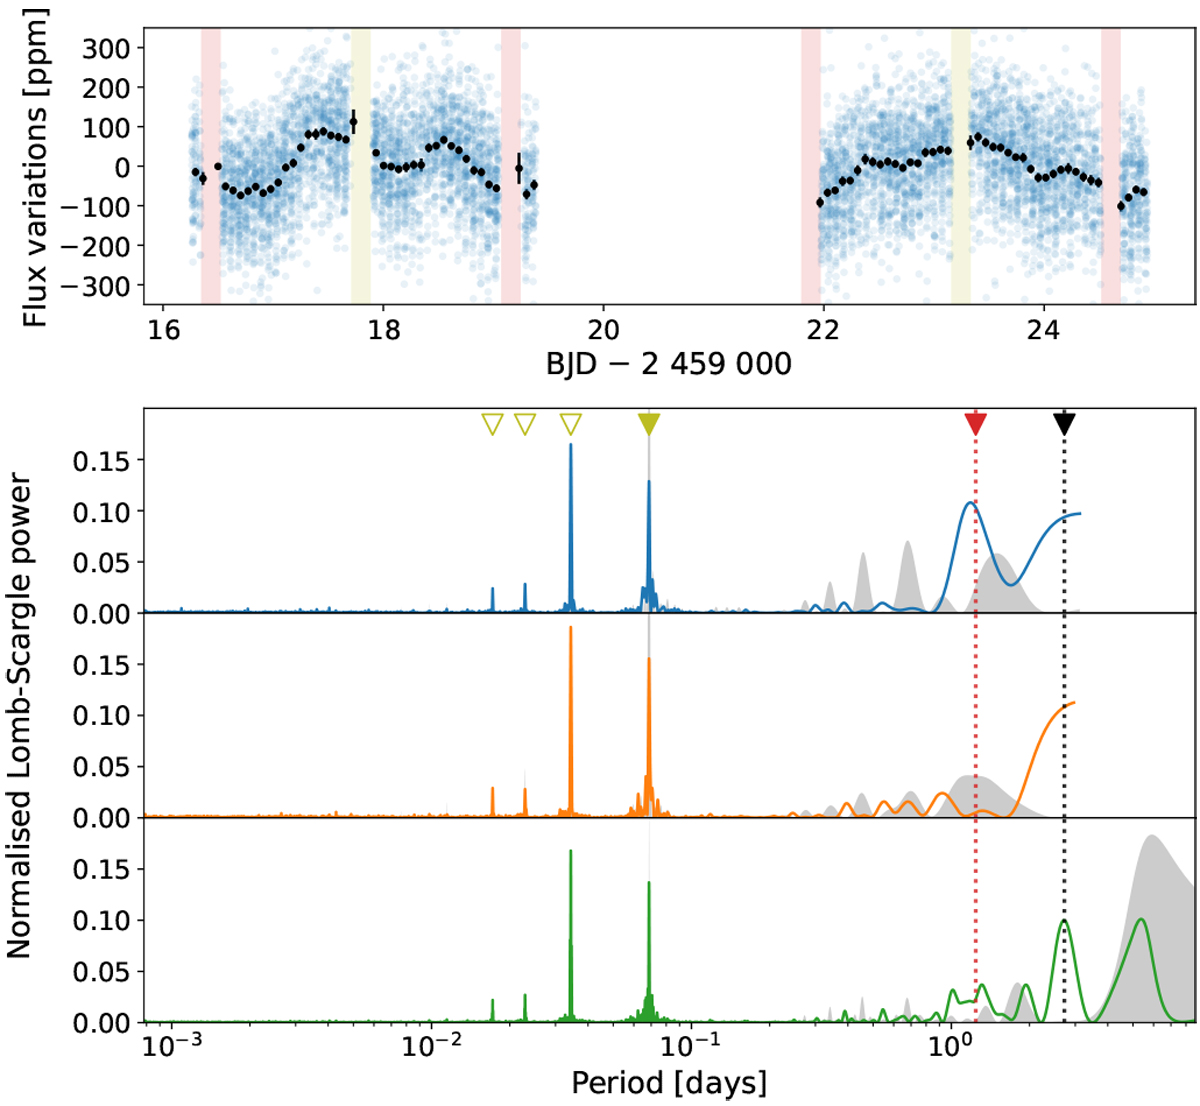
Photometric variability observed in the two WASP-189 b phase-curve time series. Top: raw flux (blue points) variations in ppm around the median value after removing outliers, de-trending for linear slope and hiding in-transit (light red shaded area) and in-eclipse (light yellow shaded area) data. Black points are raw flux variations binned once per CHEOPS orbit (98.90 min). Bottom: Lomb–Scargle periodograms of the raw flux variations shown above. The top panel represents the power spectrum of the first phase curve observed for BJD < 2 459 020, while the mid panel corresponds to the second phase-curve observation (BJD > 2 459 021). The bottom panel is the periodogram of the combined phase-curve time series. The period range covered by each periodogram goes from the Nyquist period (twice the sampling time) to the durationof the time series, and thus encompasses all detectable periodicities. The coloured triangles in the top panel mark the periods of interest. The four leftmost ones (yellow) represent the fundamental (filled triangle) and harmonic (empty triangles) frequencies of the CHEOPS orbital period. The rightmost triangle (black) and the associated vertical dashed line correspond to the orbital period of WASP-189 b. The red triangle and dashed line mark the stellar rotation period of 1.24 days computed from Lendl et al. (2020). The grey shaded area corresponds to the spectral window of the observation (spectral power induced by the sampling and the gaps of the data).
Current usage metrics show cumulative count of Article Views (full-text article views including HTML views, PDF and ePub downloads, according to the available data) and Abstracts Views on Vision4Press platform.
Data correspond to usage on the plateform after 2015. The current usage metrics is available 48-96 hours after online publication and is updated daily on week days.
Initial download of the metrics may take a while.