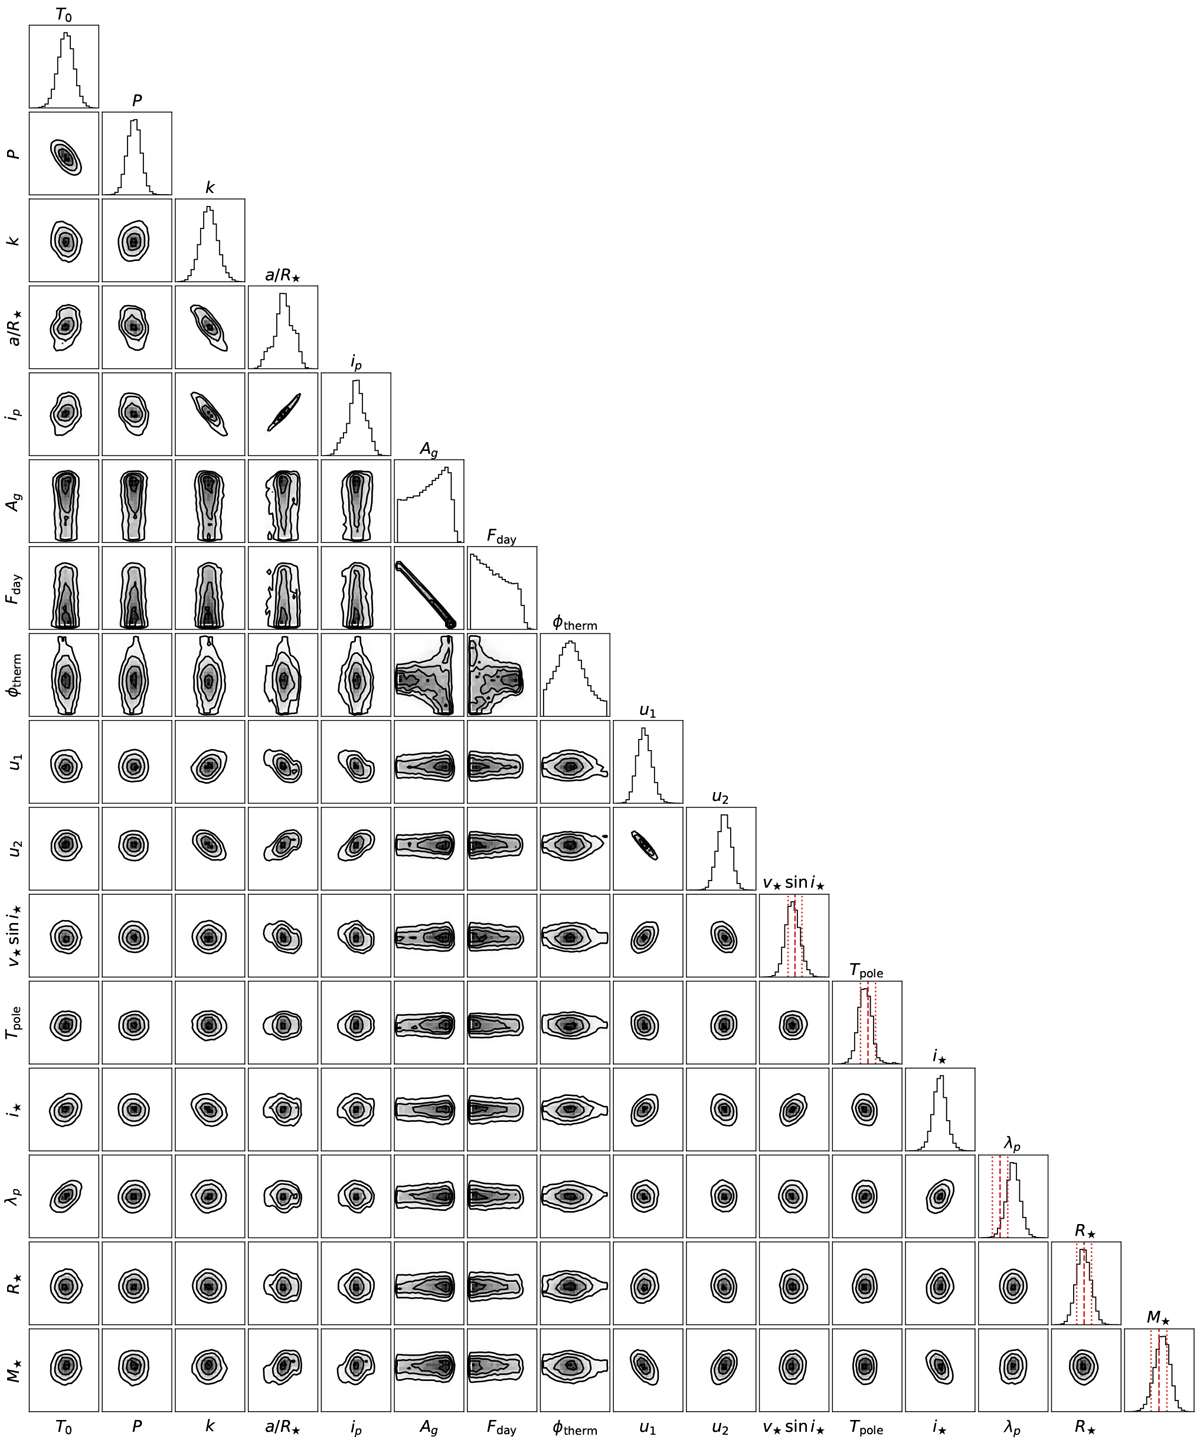
Fig. D.1
Download original image
Correlation plot of the parameters of the planet model made with the code corner (Foreman-Mackey 2016). The marginalised posterior distribution of each parameter is represented in the diagonal and the 2D histogram contours are shown below. The red vertical lines highlight the normal prior (if any), with the dashed line being the mean value and the dotted line being the ± 1σ interval. The values of the axes are not displayed as this plot aims only at revealing parameter correlations (values are reported in Table 3). The strong linear correlation between the geometric albedo Ag and the dayside thermal flux Fday is a result of the degeneracy between reflected light and thermal emission. The plot also shows that the hotspot offset ϕthem is well defined for high Fday values, as explained in Sect. 5.1.
Current usage metrics show cumulative count of Article Views (full-text article views including HTML views, PDF and ePub downloads, according to the available data) and Abstracts Views on Vision4Press platform.
Data correspond to usage on the plateform after 2015. The current usage metrics is available 48-96 hours after online publication and is updated daily on week days.
Initial download of the metrics may take a while.