Fig. 13
Download original image
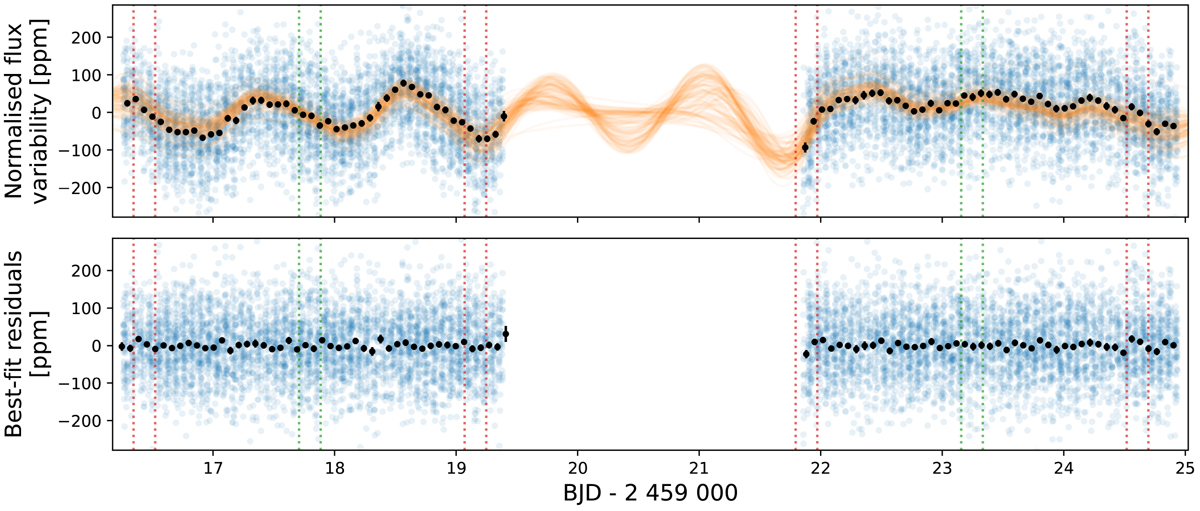
Photometric variability attributed to stellar rotation as fitted by the Gaussian process. The upper panel shows in blue the time series corrected for instrumental systematics and the planet model, including transit, eclipse, and phase-curve signal. The residuals of the best-fit are represented in the lower panel (blue points). The data points binned once per CHEOPS orbit are shown in black. The faded orange lines are GP models sampled from the posterior distribution highlighting the uncertainty of the fit. The vertical dotted lines mark the time interval of the planetary transits (red) and eclipses (green).
Current usage metrics show cumulative count of Article Views (full-text article views including HTML views, PDF and ePub downloads, according to the available data) and Abstracts Views on Vision4Press platform.
Data correspond to usage on the plateform after 2015. The current usage metrics is available 48-96 hours after online publication and is updated daily on week days.
Initial download of the metrics may take a while.