Fig. 12
Download original image
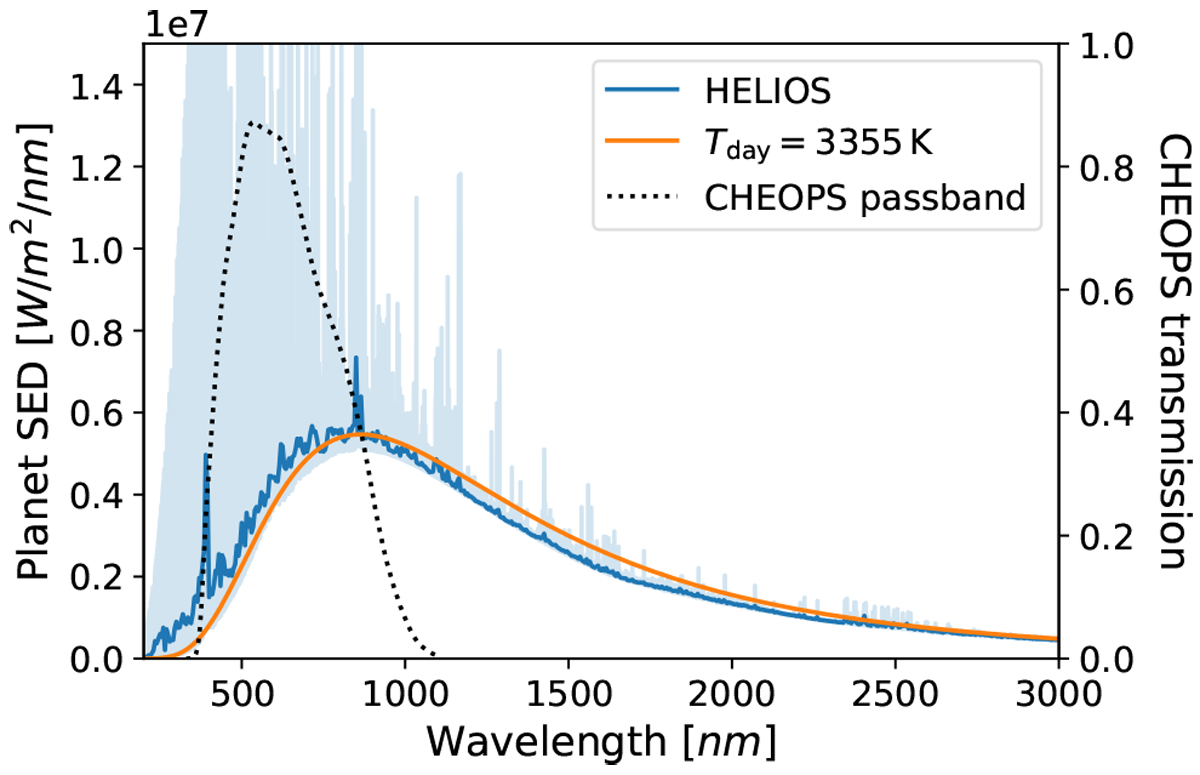
Spectral energy distribution of the planet WASP-189 b. The high-resolution synthetic SED computed with HELIOS (Malik et al. 2017, 2019) is represented in light blue and assumes the irradiating power is fully absorbed and not redistributed (AB = ε = 0). The dark blue line is the HELIOS data averaged over bins of 5 nm. The black-body profile of the maximum dayside temperature Tday, max is shown inorange. We note that accounting for emission lines in the planetary spectrum leads to a different SED with respectto the black-body approximation, with more energy in the blue end. This affects the flux measured in the CHEOPS passband (black dotted line), with the dayside of WASP-189 b appearing slightly brighter.
Current usage metrics show cumulative count of Article Views (full-text article views including HTML views, PDF and ePub downloads, according to the available data) and Abstracts Views on Vision4Press platform.
Data correspond to usage on the plateform after 2015. The current usage metrics is available 48-96 hours after online publication and is updated daily on week days.
Initial download of the metrics may take a while.