Fig. 1
Download original image
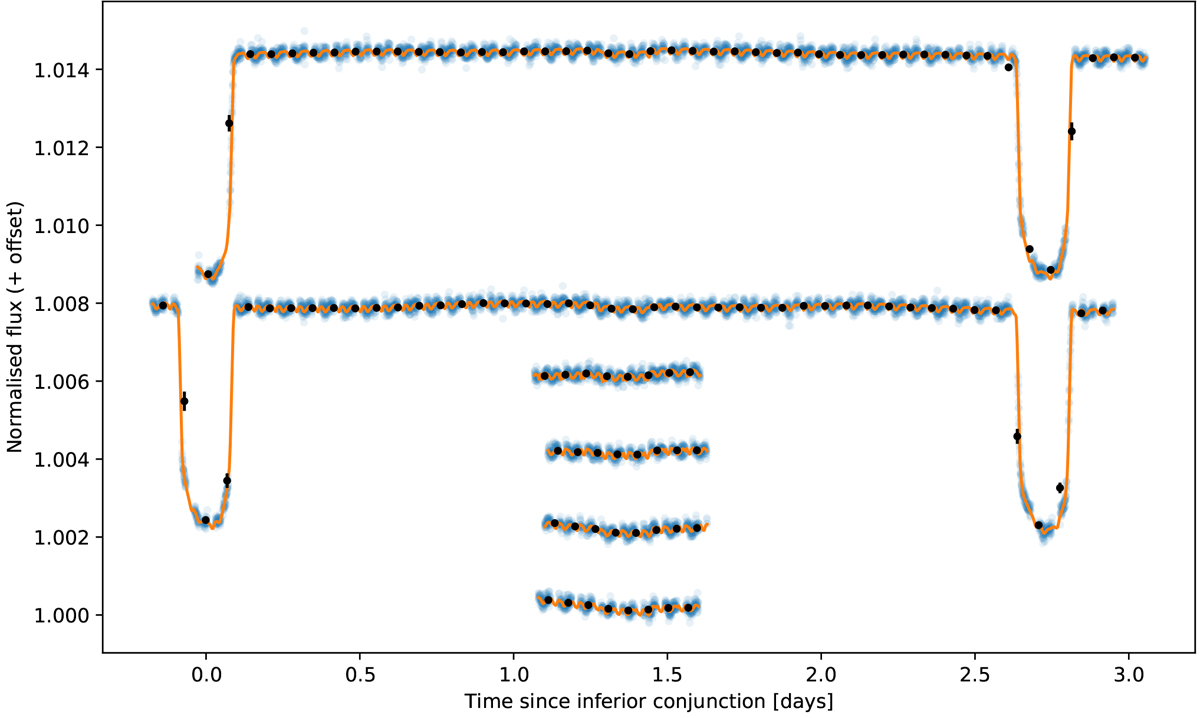
Raw light curves of the four eclipses and the two phase curves measured by CHEOPS. The represented data were extracted byaperture photometry by the mission data reduction pipeline for a circular aperture radius of 25 pixels. Each data set is shifted upward with respect to the one observed before for visualisation purposes. The raw data points are shown in blue and binned once per CHEOPS orbit (black). The orange solid line is the best-fit model obtained with the modelling described in Sect. 4. The six observations are represented as a function of time since inferior conjunction according to the best-fit parameter values.
Current usage metrics show cumulative count of Article Views (full-text article views including HTML views, PDF and ePub downloads, according to the available data) and Abstracts Views on Vision4Press platform.
Data correspond to usage on the plateform after 2015. The current usage metrics is available 48-96 hours after online publication and is updated daily on week days.
Initial download of the metrics may take a while.