| Issue |
A&A
Volume 659, March 2022
|
|
|---|---|---|
| Article Number | A4 | |
| Number of page(s) | 20 | |
| Section | Planets and planetary systems | |
| DOI | https://doi.org/10.1051/0004-6361/202142306 | |
| Published online | 25 February 2022 | |
New view of the Balmer-Kapteyn region: Cryptomare distribution and formation
1
State Key Laboratory of Information Engineering in Surveying, Mapping and Remote sensing,
Wuhan,
PR China
e-mail: This email address is being protected from spambots. You need JavaScript enabled to view it.
2
Hubei Subsurface Multi-scale Imaging Key Laboratory, Institute of Geophysics and Geomatics, China University of Geosciences,
Wuhan,
PR China
Received:
25
September
2021
Accepted:
14
January
2022
Abstract
Context. The cryptomare in the Balmer-Kapteyn region is the oldest one on the Moon. Determining the extent and formation of this feature can deepen our understanding of early mare volcanism and help establish temporal and spatial constraints on lunar thermal and volcanic history.
Aims. This paper focuses on the identification of lunar cryptomaria and figuring out their formation processes.
Methods. We used the Global WAC digital terrain model to analyze the terrain. We built a mathematical model using support vector machines and input Kaguya Multiband Imager data to estimate oxide concentrations in the Balmer-Kapteyn region. We used the Chandrayaan-1 Moon Mineralogy Mapper (M3) to analyze the minerals. We improved the cryptomare identification model to increase the accuracy of basalt identification in the cryptomare region. Finally, we used three methods to estimate the ejecta thickness of the target basin to the Balmer-Kapteyn region.
Results. New Al2O3, CaO, FeO, MgO, and TiO2 maps were generated using the Kaguya Multiband Imager and a novel machine-learning model. As a result, the extent of the cryptomare in the Balmer-Kapteyn region was redefined and the formation process of the cryptomare in the Balmer-Kapteyn region was divided into five formation stages: Balmer basin formation, ejecta coverage from the Pre-Nectarian and Nectarian large impact basins, mare basalt filling, ejecta secondary coverage of high-albedo materials, and exposure of mare basalts.
Conclusions. We found that the bottom of the Crater Vendelinus is likely to hide ancient mare basalt. Moreover, the high-aluminum mare basalt of the cryptomare is different from the composition of the exposed mare basalts in Mare Fecunditatis and Crater Vendelinus. The high-albedo material covering the cryptomare in the Balmer-Kapteyn region could have come from the Langrenus, Petavius, Humboldt, La Perouse, and Ansgarius Craters, along with some from the Orientale Basin impact event or potentially from the Imbrium Basin impact event.
Key words: planetary systems / Moon / planets and satellites: composition / planets and satellites: formation / planets and satellites: surfaces
© ESO 2022
1 Introduction
Cryptomaria are a special geographic unit found on the surface of the Moon. Lunar cryptomaria are hidden basalt deposits buried under layers of craters and basin ejecta (Antonenko et al. 1995; Head III & Wilson 1992). Cryptomaria are considered as a product of early (~4.01 Ga) mare basalt volcanisms (Terada et al. 2007; Whitten & Head 2015b). Therefore, researching cryptomaria can help us understand the thermal and volcanic history of the Moon (Head III & Wilson 1992; Whitten & Head 2015a; Wang & Qiu 2018). However, there are questions related to cryptomaria that require further study, such as their extent, chemical components, mineral composition, and the source of their high-albedo ejecta.
We selected the Balmer-Kapteyn (B-K) region as the research focus in this work. The B-K region is the oldest cryptomare area on the lunar nearside (Whitten & Head 2015b) and it provides significant clues about the formation and evolution of the cryptomaria (Wang & Qiu 2018). The B-K region located in the southeast of the mare Fecunditatis and southwest of the mare Smythii on the lunar nearside. A large number of craters appear in this zone, ranging in size from tens of meters to hundreds of kilometers (Fig. 1). As shown in Fig. 1a, the B-K region is rich in topographical features such as craters, highlands, and flat areas that are termed “mare”. The double ring morphological feature of the Balmer basin can be clearly seen in the elevation map (Fig. 1b), denoted by the dashed lines, indicating the extent of a large-scale impact event in the distant past.
There have already been a series of studies carried out on the chemical composition and lithology of the cryptomare in the B-K region. Hawke et al. (2005) indicated that some of the buried mare basalts may be high-alumina (Al2O3 > 11 wt.%) mare basalts in the B-K region. Wang & Qiu (2018) further verified that almost all the buried mare basalts in this region may be high-alumina ones through the measurement results of dark-haloed crater (DHC). Whitten & Head (2015a) analyzed the mineral content using the Moon Mineralogy Mapper (M3) in the B-K region, and further concluded that only the mare basalts of the ancient igneous rocks are consistent with the cryptomaria in absorption band centers and FeO and Th concentrations. Based on the chemical composition and lithology in the B-K region, the source of high albedo ejecta can be inferred.
The buried thickness of the hidden mare basalt under the higher albedo has always been an issue warranting special attention and it has been researched using gravity data or from DHC features in spectral data. Hartmann & Wood (1971) used gravity data to infer the mean thickness of the mare basalt with 2.5 km. Maxwell & Andre (1981) presented a detailed introduction to the positive gravity anomaly in the B-K region and argued that the hidden mare basalt was not a simple thin veneer as other researchers suggested. Hawke et al. (1989) further studied DHCs and concluded that the thicknesses of the hidden mare basalt may be <0.6 km in most regions, but the hidden mare basalt might reach a thickness of several kilometers in the central region of the Balmer Basin. Wang & Qiu (2018) noted the DHC, and indicated the buried thickness of the cryptomare may be more than ~1.8 km. One part of exploring the formation processes of the cryptomare in the B-K region includes determining the thickness and source of high-albedo ejecta.
The B-K region has undergone complex geological evolution processes. The Balmer Basin, one of the ancient basins that have since disappeared, was formed 4.1 Ga to 4.2 Ga (Wilhelms 1970) in the Pre-Nectarian period. Afterward, the B-K region experienced a variety of geological processes, such as being filled by mare basalt and covered by impact basins and crater ejecta (Hawke & Spudis 1980; Hawke et al. 1989). The substances within the Balmer Basin were buried or obscured by the ejecta from the basins or craters. Whitten & Head (2015b) argue that the surface age of the B-K region is ~3.8 Ga and that the superposed basin ejecta were generated by impact events in the Serenitatis, Smythii, and Nectaris Basins.
At the present stage, there still some limitations in the cryptomare research. There is a restriction with determination of exogenic DHCs. Because the cryptomare is covered by the higher albedo materials, exogenic DHCs that refer to the impact-generated craters is the main basis for identifying cryptomaria (Antonenko et al. 1995; Antonenko 2013; Campbell & Hawke 2005; Giguere et al. 2006; Hawke et al. 2015; Schultz & Spudis 1979; Shearer et al. 2006). However, not all impact-generated DHCs have complete halo features and terrain shadows often lead to the misidentification of DHCs as well as impeding the identification of the cryptomare. This uncertainty in cryptomare identification is based on exogenic DHCs and mare basalt exposure (Antonenko et al. 1995; Whitten & Head 2015b). The mare basalt identified using the DHC may be mafic impact-melt breccias or pyroclastic deposits rather than a cryptomare (Shearer et al. 2006). Since the formation of the Balmer Basin, the B-K region experienced the filling and covering of the mare basalt by the ejecta from impacts (Whitten & Head 2015b). In previous studies, it was assumed that impacts in the vicinity of the B-K region was the source of high-albedo ejecta and the coverage sequence of the high albedo ejecta was not considered. Determining the source and coverage sequence of high-albedo ejecta can help us estimate the activity time and buried thickness of the cryptomare and this is the focus of the present work.
We made the following analytical improvements. We improved the identification method for cryptomare: to identify the exposed mare basalt more accurately, we used Kaguya Multiband Imager (MI) data with a higher resolution and no terrain shadow. The areas identified near the fresh craters with characteristics of high-FeO and clinopyroxene was treated as exposed mare basalt. We also studied the chemical component and mineral composition of the exposed mare basalt. We constructed a new concrete method of the essential oxide contents (CaO, FeO, Al2O3, MgO, TiO2) to research the chemical component in the B-K region. The spectrum of the exposed mare basalt was analyzed to determine its mineral composition. Finally, we investigated the source of high-albedo materials of the B-K region and reconstructed the formation process model of the B-K region. We used three models developed by McGetchin et al. (1973), Pike (1974), and Petro & Pieters (2006) to estimate the ejecta thickness from the target basin to the B-K region. Combined with the buried thickness of the cryptomare in B-K region, the source of the high-albedo ejecta was inferred and the formation process model was constructed.
This work employs multivariate data (see Sect. 2) to investigate the extent, chemical component, mineral composition, topographical features, and formation process of the cryptomare in the B-K region. Some new viewpoints on the following are proposed which consider: (1) the improvements in the new method for identifying cryptomare; (2) the distribution of the cryptomare in the B-K region identified by the new method and the change in extent; (3) the abundances and distributions of chemical components (CaO, FeO, Al2O3, MgO, TiO2) in the B-K region outputted by the novel support vector machines (SVM) model; (4) the chemical components and mineral composition of the buried mare basalt in the B-K region; (5) the origins of the high-albedo ejecta in B-K region and the thickness of the ejecta in different periods; and (6) the formation process of the cryptomare in the B-K region.
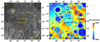 |
Fig. 1 Image of Balmer-Kapteyn region (data ID: WAC_GLOBAL_E300N0450_100M.IMG). Several craters in the area are marked (a). Elevation map of the Balmer-Kapteyn region (data ID: WAC_GLD100_E300S0450_100M.IMG) (b). The outer ring and inner ring of the Balmer-Kapteyn region is marked out by the black dotted line. |
 |
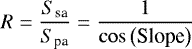
Fig. 2 Diagram of surface roughness calculation. |
2 Data and methods
In this work, in order to investigate the extent, chemical components, mineral composition, topographical features, and formation processes of the cryptomare in the B-K region, we used the following tools and datasets: (1) Kaguya Multiband Imager (Ohtake et al. 2013) was used to invert the abundance of CaO, FeO, Al2O3, MgO and TiO2. The MI data has a higher resolution compared to other spectral data (e.g., Clementine, Chang’E-1), and the data is not affected by terrain shadows. This facilitated the identification of smaller exposed basalt and reduced the influence of topographic factors on the identification accuracy; (2) Lunar Reconnaissance Orbiter Camera (LROC) Wide Angle Camera (WAC) mosaic images, Wide Angle Camera Normalized Reflectance images (643 nm) without shadows (WACNS) mosaic images (Speyerer et al. 2012), LROC Narrow Angle Camera (NAC) images (Klem et al. 2014; Mattson et al. 2012), Global WAC digital terrain model (GLD 100) (Scholten et al. 2011), Chandrayaan-1 Moon Mineralogy Mapper (M3) (Pieters et al. 2009) data, and the optical maturity (OMAT) parameter generated by the MI data (Lucey et al. 2000; Lemelin et al. 2016) were used to identify fresh exposed mare basalt; (3) Lunar Prospector (LP) gamma-ray spectrometer (GRS) data (Prettyman 2012; Prettyman et al. 2006) combined with the abundance of oxides and M3 data were used to investigate the chemical components and mineral composition of the fresh exposed mare basalt; and (4) LROC WAC mosaic images, WACNS mosaic images, LROC NAC images, and GLD 100 were employed to reveal geometrical topographical features and combined with the ejecta thickness method to deduce the formation process.
2.1 Topography
LROC WAC mosaic images and GLD 100 (100 m pixel−1) were used to analyze topographic and geomorphologic features. In this work, slope and roughness maps were calculated using the GLD 100. The terrain slope was calculated from the GLD 100 data and the ratio of surface area to its projected area on the horizontal plan was used as a parameter to express roughness. Figure 2 illustrates the process of calculating this parameter. The image data acquired as raster data due to detection accuracy limitations and one raster represents an area.
The surface area of the lunar surface (Ssa) is not directly represented on the raster image, the raster size shows the projected area (Spa) of the region. The calculation of terrain roughness can be simplified by a transformation of the formula (Cord et al. 2007; Burrough et al. 2015):
 (1)
(1)
where Ssa is the surface area of lunar surface, Spa is the projected area of lunar surface on a horizontal plane, Slope is slope value, and R is surface roughness.
2.2 Major oxide inversion
The Kaguya MI and Lunar sampling data were used to invert the abundance of major oxides (CaO, FeO, Al2O3, MgO and TiO2). The MI data were acquired by the SELenological and Engineering Explorer (SELENE) Kaguya mission. The data cover the surface between 65°N and 65°S with a spatial resolution of 59 meter per pixel. The spectral range includes 415, 750, 900, 950, and 1001 nm (UVVIS camera) and 1000, 1050, 1250, and 1550 nm (NIR camera). Therefore, eight bands (415, 750, 900, 950, 1001, 1050, 1250, and 1550 nm) are used in this work. In addition, we use 38 returned lunar samples as the ground truth, which covers Apollo and Luna landing sites, and the in situ composition measurement from the Chang’E-3 Yutu rover (Zhang et al. 2015). The reflectance values were matched to the real composition extracted at each sample-returned site, we adopted a 2 × 2 pixel reflectance average value at each sample-returned site with a resolution of ~120 m as the input spectral parameter. The specific locations, MI reflectance values, and measured oxide abundances of the 38 sample-returned sites are shown in Table A.1.
Chemical compositions affect the albedo values, and there is a potential correlation between spectra and oxides abundance (Lucey et al. 1995, 1998, 2000; Pieters et al. 2002; Wu 2012; Bhatt et al. 2019; Xia et al. 2019). The conventional method summarizes the analytical formula by combining bands to invert the oxide (Lucey et al. 1995, 1998, 2000; Sato et al. 2017). With the development of computer technology, the ability to mine data information has further improved. Models built by machine learning algorithms were used in the inversion of lunar surface oxide abundances (Korokhin et al. 2008; Wu 2012; Sun et al. 2016; Xia et al. 2019). As shown in Figs. B.1–B.5, the trend between spectral reflectance values and oxide contents were correlated. Therefore, we used machine learning algorithms to construct a set of models to describe the complex nonlinear correlation between spectral reflectance and oxide abundances to implement oxide inversions. As shown in Fig. 3, in order to describe the internal relationship between spectral reflectance values of ground truth sites and oxides abundance at lunar sampling sites, we built a mathematical model using SVM (Cortes & Vapnik 1995; Vapnik & Lerner 1963) and input MI data to estimate the oxide concentrations in the B-K region. This inversion model takes advantage of the correlation between spectral reflectance and oxide contents. An estimation of oxide concentrations relies on the SVM model, which is based on the reflectance values and lunar samples of the ground truth sites (Xia et al. 2019). The results of oxide concentration (59 m pixel−1) have a higher resolution than Clementine data (100 m pixel−1). It is not only FeO and TiO2, but also other major oxides (CaO, Al2O3, MgO) that can be described by the SVM model, which provides a wide range of applications for a variety of oxides. In addition, we employed a particle swarm optimizer (PSO) (Kennedy & Eberhart 1995; Zhong et al. 2014)algorithm to find the optimal parameters in classification model training in this study. The prediction accuracies of the five oxide contents by the PSO-SVM model were evaluated by determining the coefficient (R2) and the root-mean-square errors (RMSE) based on leave-one-out cross-validation (LOOCV) (Kohavi 1995). The MI data in the B-K region were input into each PSO-SVM model to obtain the distribution maps of the five oxide abundances in the B-K region.
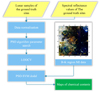 |
Fig. 3 Flowchart of the Particle Swarm Optimizer Support Vector Machines model for estimating the five oxide contents. The Kaguya Multiband Imager data shown in the graph exhibit a false color composition (R: absorption depth at 950 nm; G: absorption depth at 1050 nm; B absorption depth at 1250 nm). |
2.3 Mineralogy
The M3 data used inthis work are calibrated data archived in the Planetary Data System (version 1 of Level 2) that have been radiometrically corrected (Green et al. 2011), geometrically corrected (Boardman & Kruse 2011), thermally corrected (Clark et al. 2011), and photometrically corrected (Besse et al. 2013). Since the optical period OP2C data covers the most extent of the B-K region, this work used this optical period data, and the optical period OP1B data was used as supplement for the missing extent.
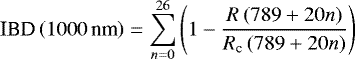
Mineral spectral parameters were used to assist the analysis of the distribution of the basic minerals on the lunar surface and the most commonly used are the integrated band depth (IBD) near the 1000 and 2000 nm bands, as well as the reflectance at the 1580 nm band of the lunar surface spectrum (Cheek et al. 2011). The algorithms for IBD 1000 and IBD 2000 are defined as follows:
 (2)
(2)
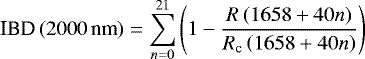 (3)
(3)
where R is the reflectance at a given wavelength, Rc refers to the continuum reflectance value (continuum is defined as a slope line across the absorption band), 789 and 1658 are the starting wavelength in nanometer, n is the number of bands to be covered by the absorption features, and 20 and 40 are the spectral sampling interval in nanometer (Mustard et al. 2011).
2.4 Cryptomare identification
Exogenic DHCs surrounded by excavated mare basalts are used to identify cryptomaria visually (Antonenko 2013; Antonenko et al. 1995; Schultz & Spudis 1979; Whitten & Head 2015b). However, this method has some limitations: (1) some exposed mare surrounding DHCs may be pyroclastic material or deposits of low-albedo impact melt (Hawke & Head 1977; Hawke et al. 1989, 2005; Schultz & Spudis 1979); (2) the image quality may affect DHC recognition, mistaking terrain shadows for DHC (Wang & Qiu 2018); (3) not all excavated mare basalts showed complete dark-haloed feature (most dark deposits occur only in or around the crater and do not appear annular). To overcome these problems, in this work, the criteria for cryptomare determination include the following conditions: (1) the presence of a high Fe content area (FeO > 12 wt.%, Northeast Africa 001-B1B is the sample of mare basalt with the lowest content of FeO, 12.21 wt.%; Snape et al. 2011) determined from the FeO abundance maps; (2) the exposure of DHCs at the site of high Fe content area determined from image data from OMAT, M3, WACNS, and WAC. Since FeO and TiO2 content can be affected by weathering, using the OMAT data to identify the exposed around the fresh impact crater can ensure the accuracy of the subsequent statistics (oxide content).The potential mare basalt located around the DHC, which is fresh (a characteristic of pyroxene and dark deposits) and the influence of terrain shadow can be further limited by comparing the WACNS image; (3) the oxide contents and spectrum of exposed mare were further analyzed to judge its mineral composition, which can be used to exclude the influence of mafic impact-melt breccias.
In the B-K region, the influence of KREEP basalt on the recognition of mare basalt can be eliminated because the maximum Th content in the B-K region is 2.35 ug g−1 (see Sect. 3.3), which is on a low-Th level. The mare basalt and highland material can be distinguished on the basis of the difference in FeO content (Haskin & Warren 1991). Mare basalt excavated by the impact crater is identified as cryptomare using this model.
2.5 Ejecta thickness
The cryptomare in the B-K region was buried by several crater ejecta (Hawke et al. 2005; Whitten & Head 2015b; Wang & Qiu 2018). For a while, it was thought that the ejecta that covered cryptomare came from the Petavius, Humboldt, Ansgarius, and La Perouse Craters (Hawke et al. 2005). However, Whitten & Head (2015b) indicated that the large impact events of Nectaris and Imbrium produced ejecta that could affect the whole moon. The part of the ejecta in the B-K region may come from the impact event with Serenitatis Basin, Smythii Basin, and Nectaris Basin. Here, we used three methods to estimate the ejecta thickness of target basin in the B-K region. The algorithm for ejecta thickness is defined by McGetchin et al. (1973) as follows:
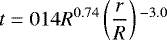 (4)
(4)
where R is the radius of a crater, r is the radial range measured from the center of the crater, and t is average ejecta thickness at the radial range r.
The algorithm for ejecta thickness is defined by Pike (1974) as follows:
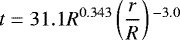 (5)
(5)
where the variables are the same as defined above.
And the algorithm for ejecta thickness is defined by Petro & Pieters (2006) as follows:
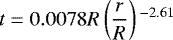 (6)
(6)
where the variables are the same as defined above.
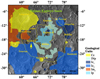 |
Fig. 4 Main geological units map of the Balmer-Kapteyn region. The background is the Wide Angle Camera Global Morphologic basemap (data ID: WAC_GLOBAL_E300N0450_100M.IMG). Cc, material of rayed craters; Ip, light-colored plains material; INp, light-colored plains material (Imbrian or Nectarian); Ic1, material of moderately subdued circular craters; Ic2, material of moderately fresh circular craters; Im2, younger mare material. |
2.6 Geological units
The Balmer Basin, with a diameter of ~250 km, is a typical double-ring basin located in the southeast of the Mare Fecunditatis and the southwest of the Mare Smythii (Hawke et al. 2005). Several large impact craters (greater than 50 km in diameter) were developed surrounding the Balmer Basin, including Langrenus, Petavius, Humboldt, Ansgarius, and La Perouse. In addition, there are several small impact pits in the basin, among which Lame, Kapteyn, Kapteyn B, and Holden T are the representatives. Between Langrenus and Petavius, there is Crater Vendelinus, with a diameter of >100 km, which developed at the junction of the Balmer Basin and the Mare Fecunditatis. There is a lot of mare basalt exposed in the craters (Fig. 4).
According to the difference of reflectivity, genesis and impact craters density, as well as the superposition relation among geological units, the B-K region is divided into Ic1, Ic2, Cc, INp, Ip and Im2 as shown in Fig. 4 (Wilhelms et al. 1987). The INp and Ip are light-colored plains, the high-albedo and level structure. The former indicates areas formed in the Pre-Imbrian or Late-Nectarian age, and the latter indicates a middle Imbrian age. The Ip is concentrated in the inner ring region of the Balmer Basin, which is younger than the outer ring region. The Ic1 (older than the Orientale basin and younger than the Imbrium Basin), the Ic2 (older than younger mare material and younger than or about the same age as the Orientale basin) and the Cc (Copernican age) are located around the Balmer Basin. The Cc forms a distinct ejecta material, indicating that the ejecta from the craters have an important influence on the formation of the cryptomare in the B-K region. In addition, there are younger mare material (Im2) in crater Vendelinus and the B-K region, which were formed in the Post-Imbrian period. The magmatic activity and impact events in the B-K region form rich geological units. The earliest craters in the B-K region can be traced back to the Nectarian and Pre-Nectarian age, but such early craters are degraded or filled with ejecta (Hawke et al. 2005). The crater Vendelinus has been filled with mare basalt, only retaining the outer ring structure. It is located in the transition zone between the Mare Fecunditatis and the potential cryptomare, which is an important control area for research on the cryptomare. The large craters produce sufficient ejecta, which accelerates the degradation of the impact craters in the B-K region and even covers up the smaller ones.
3 Results
3.1 Regional topography
The inner ring area of the Balmer Basin, the center of the B-K region, shows clear signs of terrain subsidence and the average elevation is ~1000 m lower than that of the outer ring area. The terrain of the outer ring region of the basin is uplifted, and the uplift height is the largest in the northeast direction of the basin, showing the tectonics of the multi-ring basin formed by the impact. As a whole, the average elevation of the mare area in Crater Vendelinus is approximately −2600 m. In addition, the Mare Fecunditatis area in the northwest of Balmer Basin is the lowest, with an average elevation of approximately −2000 m. The highest area is around Crater Ansgarius and Crater La Perouse, with an average elevation of 600 m. The regional topography in the B-K region is presented in Fig. 5.
The internal slope of the Balmer Basin is very small, and the inner ring area of the basin is basically less than 2°, as shown in Fig. 5a. The larger slope area is mostly located at the wall of the impact crater or the central peak of the impact crater. As shown in Fig. 5b, the overall terrain roughness of the B-K region is small, the roughness value of over 90% of the region is less than 1.5, indicating that the region has small topographic relief. In addition, there are a few large rocks, whichare likely to be affected by the coverage of high-reflectivity ejecta, making the surface within the region smoother.
3.2 Chemical composition
This work uses Kaguya MI data and the PSO-SVM algorithm to invert the content of five oxides in the B-K region and usec to produce abundance maps of CaO, FeO, Al2O3, MgO, and TiO2. The contentprediction accuracies for five oxides are shown in Fig. B.6. The measured values are derived from lunar sample and the sampling point information is shown in Table A.1 (Xia et al. 2019). The estimated values are derived from the PSO-SVM models. The R2 of validation for CaO, FeO, Al2O3, MgO, and TiO2 are 0.837, 0.941, 0.948, 0.802, and 0.8871, respectively. The RMSE values for the validation of CaO, FeO, Al2O3, MgO, and TiO2 are 0.82, 1.17, 1.33, 0.85 and 1.00 wt.%, respectively. On this basis, a Mg# ([Mg/(Mg+Fe)], a percentage of mole ratio) map was drawn for the B-K region, and a Th element content map obtained by the LP GRS data inversion was used to analyze the chemical composition characteristics of the B-K region (Prettyman et al. 2006; Prettyman 2012). The chemical composition maps are presented in Fig. 6. In addition, the FeO and TiO2 content maps measured by LP (Lawrence et al. 2002) and the FeO content map produced by Lemelin et al. (2015) were used to compare with our maps. As shown in Figs. B.7–B.9, our results are close to the LP measurements and our estimated FeO content is relatively low compared to the result from Lemelin et al. (2015). Comparing the results of LP data, the PSO-SVM model produced results with ~0.6 wt.% higher FeO content and ~0.3 wt.% higher TiO2 content. The inversion results of the PSO-SVM model are similar to those of the LP measurements. This demonstrates the viability of the PSO-SVM model to invert the content of chemical components.
From Fig. 6a, we can see that the inner ring area of Balmer Basin, its western and southern areas, and Mare Fecunditatisarea, whose FeO abundance was higher than other regions. About 90% of the inner ring area of Balmer Basin and its western and southern area had FeO abundances greater than 10 wt.%, up to 15.5 wt.%, which is close to established FeO abundance of the Mare Fecunditatis (Kramer et al. 2008). The FeO abundance of the mare area in Crater Vendelinus was ~13.5 wt.%, and the FeO abundance of the Mare Fecunditatis, in the west of Balmer Basin, was generally greater than 14 wt.%. The abundance increased from south to north, with the maximum value reaching 16.3 wt.%. From Mare Fecunditatis to the Crater Vendelinus and then to the inner ring area of the Balmer Basin, FeO abundance showed a decreasing trend, and probably influenced by ejecta materials from the newer craters (low-Fe ejecta from Langrenus, Petavius, Humboldt, Ansgarius, and La Perouse).
The TiO2 content in the B-K region was lower than 5 wt.% (as shown in Fig. 6b). About 90% of the area had a TiO2 content higher than 1% in Mare Fecunditatis and Vendelinus regions. The mean content of TiO2 was 1.3 wt.% in the B-K inner ring area. In addition, the TiO2 content in surrounding areas of Balmer Basin was all lower than 0.5 wt.%. Combined with the results of previous works (Hawke et al. 2005), it can be determined that the mare basalts in the Mare Fecunditatis and Vendelinus area are low-Ti mare basalts. Furthermore, the FeO and TiO2 abundances in the B-K region are basically similar in spatial distribution, showing a positive correlation, which may be due to the fact that ilmenite is generally contained in the mare basalts.
Overall, Al2O3 abundance as shown in Fig. 6d was negatively correlated with FeO and TiO2 abundance and Al2O3 abundance was relatively low in areas with high FeO and TiO2 abundances. The Al2O3 abundance in Vendelinus area was higher than 16 wt.%, and the mean abundance of Al2O3 was 15 wt.% in Mare Fecunditatis. The Al2O3 abundance in about 90% of the inner ring of Balmer Basin was higher than 19 wt.%, but still lower than 25 wt.% in the highland zone. The CaO abundance (as shown in Fig. 6e) was also negatively correlated with FeO and TiO2 abundances, the CaO content in the Balmer Basin zone was at a low level, but both were above 11.98 wt.%. In addition, the Mg# in the eastern highlands (as shown in Fig. 6f) of the B-K region is higher than 75, which places it the range of a magnesian suite.
The Th content was at a low level varying from 0 to 2.25 ppm in the B-K region (as shown in Fig. 6g). The southwestern area has a low Th content and the OMAT value was high in this zone (as shown in Fig. 6h). This indicates that the low-Th material is likely to have originated from new crater ejecta. The Th values were higher in the northern part of the B-K region. A small high-value circular zone can be clearly observed on the OMAT map (as shown in Fig. 6h) in the Balmer Basin, providing a basis for identifying newer craters. The mare basalts in Mare Fecunditatis and Vendelinus area are composed of high-Al basalts (FeO is 12-18 wt.%, TiO2 is 1-5 wt.%, Th is 0-4 wt.%; Kramer et al. 2008). Moreover, the Vendelinus area and Balmer Basin were affected by the ejecta from the surrounding craters, as ejecta stripes could be clearly observed in the oxide content and Mg# maps (Fig. 6f, marked black lines).
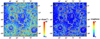 |
Fig. 5 Maps of the regional topography in the Balmer-Kapteyn region: (a) slope map of Balmer-Kapteyn region. (b) Roughness map of Balmer-Kapteyn region. The greater the roughness, the greater the surface fluctuation. |
3.3 Mineralogy
To research the mineral composition of the B-K region, we used Chandrayaan-1 M3 data for further analysis of the lunar mineral spectrum. The M3 spectral analysis of the B-Kr region is presented in Fig. 7.
The color composite maps shown in Fig. 7a describe the mineral distribution in the B-K region. The region is dominated by plagioclase signatures in a wide extent of blues (Lucey et al. 2006). Mare Fecunditatis and Vendelinus area are characterized by pyroxene signatures, with pyroxene outcroppings in the Balmer Basin (Fig. 7, marks c and d, for example). New craters in the Balmer Basin are bright yellow, indicating that pyroxene-rich material was excavated by the impacts (Lucey et al. 2006). The spectra of new craters in Mare Fecunditatis, Vendelinus, B-K inner ring zone, B-K outer ring zone, and the eastern highlands zone as shown in Figs. 5b,c. The sampling points (a, b, c, d) all show absorptions around 1000 and 2000 nm, indicating that clinopyroxene is exposed. However, in the eastern highlands zone, the weak absorptions near 1000 and 2000 nm indicate that clinopyroxene is probably mixed with highland materials.
3.4 MMare basalt identification
We identified 409 exposed mare units around the fresh dark material craters (DMCs) based on the model discussed in Sect. 2.4. These mare units are located within the Balmer Basin and the Crater Vendelinus, Petavius, and Humboldt (as presented in Fig. 8a). As illustrated in Figs. 8b,c, these are distributed around the DMCs and a part of the exposed mare basalt. Some of the exposed mare are only in or around craters and do not appear annular. Hawke et al. (2005) identified 25 DHC in the B-K region using the Clementine images (100–200 m pixel−1), but unlike their results, our work using the Kaguya MI data and new cryptomare identification model indicates smaller, more numeous mare basalt units.
Combined with the Al2O3, CaO, FeO, MgO, and TiO2 abundances maps in the B-K region, we analyzed the oxide contents of the exposed mare basalt. The oxide abundances values for 409 exposedmare basalt units are shown in Table 1.
The mare basalt exposed units are in accordance with the chemical composition of high-Al mare basalts, with FeO values from 12.59 wt.% to 14.43 wt.%, and TiO2 values from 0.55 wt.% to 2.96 wt.%. These units are similar in composition to mare basalts in Mare Fecunditatis units in the west of Balmer Basin (FeO value from 14 wt.% to 16 wt.%, TiO2 value from 1.5 wt.% to 3 wt.%), but the overall value is low. This indicates that the mare basalt exposed in the Balmer Basin is likely to be mixed with ejecta from impact craters. Comparisons of the chemical composition between the mare basalt exposed units and other rock types are shown in Fig. 9.
The exposed mare basalt units exhibit high-Al2O3, low-TiO2, low-FeO, and middle-MgO features, similarly to the NEA001 B1b sample. The exposed mare basalt units from the cryptomare fall into the zone of mare basalt. These indicated that the mare basalt exposed from the cryptomare is a high-Al mare basalt in terms of chemical composition. We calculated the band centers of 1000 and 2000 nm band wavelength of the mare basalt exposed units for OP2C1 and OP1B M3 data, and compared them with the synthetic pyroxenes measured in the laboratory (Klima et al. 2007, 2011; Mustard et al. 2011) as illustrated in Fig. 10.
The 1000 nm absorption band centers of synthetic orthopyroxene were less than 950 nm, while the 2000 nm absorption band centers were less than 2100 nm. Moreover, the 1000 nm absorption band centers of synthetic clinopyroxene were more than 950 nm, while the 2000 nm absorption band centers were more than 2050 nm. The mare basalt exposed from the cryptomare fall into the band centers of clinopyroxene. From the results of the chemical compositions and spectral characterizations, it is inferred that a high alumina mare basalt was buried in the B-K region. It is also inferred that the buried basalt formed during the same period from chemical compositions. However, there is no evidence with two periods of mare volcanism in the region and it also stands in contrast to Wang & Qiu (2018). We deduce that this difference is due to the different data used, so we compared it with the work of Hawke et al. (2005) and found that our results to be consistent. As shown in Fig. B.10, DHC-53 in the Fig. B.10a corresponds to DHC-14 in Fig. B.10b. The FeO content is ~8.16 wt.%, the TiO2 content is ~2.10 wt.%, and the Al2O3 content is 22.48 wt.% at the DHC-53 measured by the Chang’E-1 interference imaging spectrometer (IIM) data (Wang & Qiu 2018). A basalt sample with such low FeO content were not found in the this work. However, the FeO content is ~15.6 wt.%, the TiO2 content is ~1.7 wt.% measured by Clementine (Hawke et al. 2005). It is in consistent with our results (FeO, 15.1 wt.%) and the FeO content is 18.1 wt.% from Lemelin et al. (2015) in the same area. The misidentification of DHC-53 may be due to the low data precision of the IIM data on the local areas. Therefore, it is inferred that the cryptomare basalt are from the same period of mare volcanism in the B-K region.
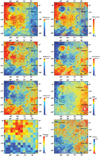 |
Fig. 6 Maps of the chemical components in the Balmer-Kapteyn region: (a) FeO abundance. (b) TiO2 abundance. (c) MgO abundance. (d) Al2O3 abundance. (e) CaO abundance. (f) Mg# map. (g) Th content. (h) OMAT map. The maps of oxide abundances were generated from the Kaguya Multiband Imager data (Ohtake et al. 2013), and the Th map was determined based on data from the Lunar Prospector Gamma-Ray and Neutron Spectrometers (Prettyman et al. 2006; Prettyman 2012). |
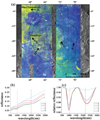 |
Fig. 7 M3 spectral analysis of the Balmer-Kapteyn region: (a) M3 color composite map of the Balmer-Kapteyn region (R: IBD 1000, G: IBD 2000, B: 1580 nm reflectance). The M3 in the figure uses the optical period OP2C data (data ID: M3G20090604T023806_V01_ L2_MAP, M3G20090603T050442_V01_L2_MAP, M3G20090603T134223_V01_L2_MAP, M3G20090603T174502_V01_L2_MAP, M3G20090603T221232_V01_L2_MAP). The background is the Wide Angle Camera Global Morphologic basemap (data ID: WAC_GLOBAL_E300N0450_100M.IMG). (b) M3 reflectance spectra extracted from the area pointed by black arrows in panel a. (c) M3 continuum-removed spectra of the same spots. Plagioclase-rich material is blue and pyroxene-rich material is yellow on the M3 color composite map. |
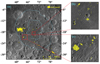 |
Fig. 8 Maps of the mare basalt exposed units in the Balmer-Kapteyn region. The background is the Wide Angle Camera Global Morphologic basemap (data ID: WAC_GLOBAL_E300N0450_100M.IMG). The yellow patches are mare basalt exposed. (a) Exposed mare in the Balmer-Kapteyn region. (b) and (c) Some areas of exposed mare. |
Oxide abundances statistics for 409 mare basalt exposed units in the Balmer-Kapteyn region.
3.5 Ejecta source
Initial analyses were carried out for the Nectaris Basin, the Smythii Basin, the Crisium Basin, the Imbrium Basin, and the Orientale Basin to evaluate the contribution of their ejecta to the B-K region using the three models developed by McGetchin et al. (1973), Pike (1974) and Petro & Pieters (2006). These basins are close to the B-K region and indicative of the geologic history of this region (Hawke et al. 2005). Among them, the Crisium Basin is considered to be the last basin formed in the Nectarian age. The age estimates of the Crisium Basin impact event is ~4.07 Ga (Orgel et al. 2017). The Imbrium basin-forming event is estimated to have occurred at ~3.87 Ga (Orgel et al. 2017). The Orientale Basin is the youngest large basin formed during the Imbrian age, with a basin-forming event estimated to be ~3.81 Ga (Orgel et al. 2017). The ejecta thicknesses of these five basins in the B-K region are shown in Table 2.
The results of three models indicated that the Smythii, the Nectaris, and the Crisium basin-forming events could provide ejecta in excess of a hundred metres in thickness for the B-K region. By comparison, the results obtained from the models by McGetchin et al. (1973) and Pike (1974) are similar, the result obtained from the model by Petro & Pieters (2006) differs by a factor of several. In this work, we use the results from McGetchin et al. (1973) and Petro & Pieters (2006) for a combined analysis. The ejecta thickness from the Crisium basin-forming event could be up to ~246.08 m (ejecta thickness-A), ~567.79 m (ejecta thickness-C), which are far greater than the shallowest DHC (~33 m) in the B-K region (Wang & Qiu 2018). This indicates that the ejecta of Crisium Basin did not cover the mare basalt buried in the B-K region. Furthermore, the ejecta of other basin-forming events that formed earlier than Crisium Basin did not cover the mare basalt in the B-K region. However, these ejecta deposits did cover and accelerate the degradation of the Balmer Basin. The Imbrium Basin and Orientale Basin are far from the B-K region but the formation time was close to the absolute model age of the B-K region surface, ~3.84 Ga Whitten & Head (2015b). In the B-K region, the thickness of the ejecta from the Imbrium Basin is ~19.39 m while the ejecta from the Orientale Basin is ~1.81 m obtained from the model by McGetchin et al. (1973), in contrast to this the results for the model by Petro & Pieters (2006) are ~64.27 and ~7.76 m. This indicates that Orientale Basin ejecta buried the cryptomare in the B-K region. To determine the superposition buried thickness between the ejecta of Imbrium Basin and cryptomare in the B-K region, it is necessary to further confirm the active time of mare basalt in the cryptomare.
In addition to the ejecta of ancient basin-forming events, the ejecta of craters formed around the Balmer Basin is a major source of high reflectivity material on the cryptomare (Hawke et al. 2005). The ejecta of Crater Vendelinus, Lame, and Hecataeus, formed in the Pre-Nectarian or Nectarian periods, did not contribute material that would effectively bury the cryptomare. Using the ejecta thickness model by McGetchin et al. (1973), the threshold value of ejecta thickness was set to 5 m. The scope of crater ejecta around the Balmer Basin from each crater are shown in Table 3.
It can be seen in these results that the thickness of the ejecta from these five impact craters exceeds 25 m. The ejecta of craters affected a range of hundreds of kilometers and covered the entire B-K region. This indicates that most of the ejecta deposits covering the cryptomare came from these five craters. Therefore, the ejecta from outside to the B-K region can be divided into the ejecta buried beneath the mare basalt and ejecta overlying the mare basalt. The ejecta from the Smythii Basin, the NectarisBasin, and the Crisium Basin were buried under mare basalt. The thickness of these buried ejecta may be 774 m (ejecta thickness-A) or 1666 m (ejecta thickness-C). The ejecta from the Imbrium Basin, the Orientale Basin, the Crater Langrenus, the Crater Petavius, the Crater Humboldt, the Crater La Perouse, and the Crater Angarus covered with the mare basalt. Of these, the ejecta from the Imbrium Basin and the Orientale Basin can be up to 21 m (ejecta thickness-A) or 72 m (ejecta thickness-C) thick. The ejecta from the Crater Langrenus, the Crater Petavius, the Crater Humboldt, the Crater La Perouse, and the Crater Angarus all exceed 5 m in thickness.
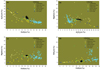 |
Fig. 9 Chemical comparisons of the mare basalt exposed units in the Balmer-Kapteyn region with other rock types: (a) comparison in the FeO-Al2O3 content space. (b) Comparison in the Al2O3-MgO content space. (c) Comparison in the FeO-MgO content space. (d) Comparison in the FeO-TiO2 content space. Two sets of lunar rock samples are involved: one is 125 returned lunar rock samples by the Apollo and Luna missions and the other is 30 lunar meteorite samples, including 26 unbrecciated basalts from the meteorites of Yamato 793169, La Paz Icefield (LAP) 02005, 02224, 02226, 02436, 03632, Northwest Africa (NWA) 032/479, NWA 4734, NWA4898, and Northeast Africa (NEA) 003, 3 mare basalt clasts of Northeast Africa (NEA) 001 and one KREEP clast of Sayh al Uhaymir (SaU)169. The chemical components of the Apollo and Luna samples are reported by Wieczorek et al. (2006); Zeigler et al. (2006); Fagan & Neal (2016). The chemical components of the meteorites were reported by Warren & Kallemeyn (1993); Gnos et al. (2004); Zeigler et al. (2005); Day et al. (2006); Greshake et al. (2008); Elardo et al. (2014); Haloda et al. (2006, 2009). |
Ejecta thickness of ancient basins to the Balmer-Kapteyn region.
3.6 Distribution of cryptomare
The results of this current research expand the extent of identified cryptomare (Fig. 9). Whitten & Head (2015a) identified the distribution of cryptomare are shown in Fig. 11a. In our work, according to the map of the mare basalt exposed units and the maps of the chemical components, the distribution extent of the cryptomare in the B-K region is shown in Fig. 11b. Both Figs. 9a,b show that the extent of cryptomare overlaps with part of the contour of the B-K basin.
The cryptomare is mainly distributed in the inner ring of the Balmer Basin and to the south and southwest of the inner ring. This phenomenon is most likely influenced by the local topography. As shown in Figs. 11c,d, elevation rise hindered the expansion of early mare basalts. Moreover, it is possible that ancient mare basalts of cryptomare were buried at the Vendelinus area. The Vendelinus area is low-lying within the Balmer Basin and adjacent to the cryptomare, with favorable conditions for mare basalt infilling. The ancient mare basalts were buried at the bottom of the Crater Vendelinus and later covered with young mare basalts from the Mare Fecunditatis: (1) as the surrounding area is higher than the Vendelinus crater, the ancient mare basalts likely spread out from Mare Fecunditatis and the bottom of the Crater Vendelinus would be filled with basalts; (2) the mare basalts in the Crater Vendelinus and the Mare Fecunditatis have similar chemical compositions and reflectivity, and the Vendelinus area is lower than Mare Fecunditatis, thus making it possible that the mare basalts in the Crater Vendelinus had spread from the Mare Fecunditatis.
As shown in Fig. 11b, the total area of the newly marked cryptomare area and the Vendelinus area has increased significantly compared to the findings from previous works (Whitten & Head 2015a). The new cryptomare identification model and the use of high-resolution MI data have greatly assisted in the delineation of the extent of the cryptomare. In addition, a comprehensive analysis in the context of the topography of the region is also an integral part of circumscribing the extent of the cryptomare.
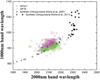 |
Fig. 10 Comparison of the 1000 and 2000 nm band centers for spectral pairs of the optical period OP2C1 and OP1B M3 data. The band centers measured in the laboratory for synthetic pure pyroxene (Klima et al. 2007, 2011). |
Scope of crater ejecta around the Balmer Basin.
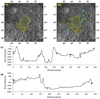 |
Fig. 11 Maps of the cryptomare distribution in the Balmer-Kapteyn region: (a) The result of Whitten & Head (2015a). The yellow zone represents the cryptomare. (b) The result in this work. The yellow zone represents the cryptomare and the green zone represents mare basalt exposed. (c) Topographic profile of the AA’ in panel b. (d) Topographic profile of the BB’ in panel b. |
3.7 Composition and lithology of the cryptomare
The compositions of the exposed mare basalt units shown in Fig. 8 were used to investigate the composition of the cryptomare. The FeO and TiO2 values range between 12.59 wt.% and 14.43 wt.% for FeO and from 0.55 wt.% to 2.96 wt.% for TiO2. The maximum values are close to the mare basalts on the lunar nearside (Lucey et al. 2000; Shkuratov et al. 1999). The mare exposed basalts unit in Crater Vendelinus (14.43 wt.%) have FeO abundances that are higher than those of the cryptomare. The difference in composition of mare basalt between Crater Vendelinus and cryptomare may be due to the difference of quantity from ejecta or the different genesis of the mare basalts. The oxide content comparisons of exposed mare basalt in the cryptomare fall into the zone of mare basalt with high-Al2O3 (Fig. 9). Their band centers fall into the band centers of clinopyroxene (Fig. 10). The chemical composition and spectrum indicate that the buried cryptomare in the Balmer Basin contains high-Al mare basalt. Hawke et al. (1985) suggested that the buried mare basalts in the Balmer Basin have composition similar to that of the Apollo 17 sample 72275 (Ryder et al. 1977; Ryder & Spudis 1980). The absolute model age of the B-K region surface is ~3.84 Ga, and the B-K region experienced multiple periods of ejecta coverage, the hidden high-Al mare basalt is also much older. Therefore, these high-Al mare basalt samples are related to ancient mare activity, suggesting that the cryptomare is an ancient hidden mare.
4 Formation processes of cryptomare
Based on the cryptomare formation stages described by various researchers and the discovery in this work, the possible evolution of cryptomare in the B-K region could be summarized in the following buried thickness of events, as shown in Fig. 12.
From Fig. 12, we can find the flowing sequence for the possible formation of cryptomare:(a) formation of the Balmer Basin. Many ancient basins, including Balmer Basin, formed during the Pre-Nectarian. Wilhelms et al. (1987) estimated that the Balmer Basin was formed at ~4.2 Ga. The formation of the Balmer Basin thinned the lunar crust in the B-K region, which provided favorable conditions for future underplating or eruption of the mare basalt. The basin structure is more conductive to the storage of mare basalt; (b) ejecta coverage of large basins in the Nectarian and Pre-Nectarian. According to the analysis of the ejecta sources presented in Sect. 3.6, basin-forming events earlier than the Crisium Basin have no covering effect on the cryptomare in the B-K region. High-albedo ejecta will cover the original basin structure, and the ejecta deposits formed by multiple basins can even be several kilometers thick. The high-albedo ejecta will later mix with intrusive or eruptible basalt; (c) underplating or eruption of the mare basalt. In the Pre-Imbrian, the magma movement in the B-K region became active (Schultz & Spudis 1979). These activities occurred after the formation of the ejecta from the Crisium Basin, 3.89 Ga (Swindle et al. 1991), but before the surface dating result for the B-K region, 3.84 Ga (Whitten & Head 2015b). An analysis of the topography shows that the mare basalt originated from the underplating or eruption of the mare basalt, but not from mare basalt flows outside the basin; (d) coverage of ejecta material. Under the influence of the ejecta from the basin-forming events in Imbrium and Orientale Basins and the continuous ejecta from the Langrenus, Petavius, Humboldt, La Perouse, and Angarus craters around the Balmer Basin: the mare basalt that filled the basin was covered with high-albedo ejecta materials, forming the cryptomare;(e) exposed mare basalt: a large number of impact events in the later period excavated the buried mare basalt and distributed this material within or around the crater to form the DMC. The high-albedo ejecta from the large carters around the Balmer Basin has multiple periods of covering processes, so only young impact carters excavate the buried mare basalt. The high-albedo ejecta material in the B-K region was not only from the proximal craters, but also from distant large ancient basins. Moreover, due to the multistage covering process of the ejecta, it is possible that some of mare basalts excavated by caters were again covered by younger ejecta. It is also reasonable to conclude that the existence of deep crater excavations did not expose buried mare basalts. The B-K region was affected by many periods of ejecta from craters, among which the Crater Langrenus is the youngest, formed in Copernican period. The ejecta will accelerate the degradation of the lunar surface structure in the B-K region. These results suggest that the CSFD model is possibly flawed and does not represent the actual formation time of the B-K region as the real time is ~3.8 Ga (Whitten & Head 2015a). Current estimates for the thickness of buried basalt in the cryptomaria have also been shown to be problematic. As shown in Fig. 12b, the high-albedo ejectas buried in the very bottom of Balmer Basin, this suggests that there is a significant error in estimating the thickness of the cryptomare basalt based on the dimensions of the basin (Yingst & Head 1997) – as the early ejecta could be mistaken for basalt, it would result in a greater burial thickness and volume of the cryptomare basalt than the true value. As shown in Fig. 12c, the upward movement of magma could change the topography of the basin floor and the exotic high albedo ejecta would mix vertically with the local basalt. This could lead to errors in the estimation of the cryptomare basalt thickness using impact crater excavation depths (Hartmann & Wood 1971; Wang & Qiu 2018). This would also explain the fact that the fresh impacts with the same excavation depth can expose basalt in some cases and not in others. At this stage, there are obvious shortcomings in using morphological methods to estimate the thickness and volume of cryptomare basalt and new methods need to be proposed to address the problem in the future. For example, an attempt to use the gravity data with high resolution to study the density anomalies below the lunar surface would be of great help in estimating the thickness and volume of the cryptomare.
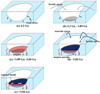 |
Fig. 12 Formation of cryptomare in the Balmer-Kapteyn region: (a) formation of the Balmer Basin, ~4.2 Ga. (b) Ejecta coverage of large basins in the Nectarian and Pre-Nectarian after the formation of the Balmer Basin until the mare basalt filled. (c) Underplating or eruption of the mare basalt, where the mare basalt was exposed on the lunar surface and may have mixed with early basin ejecta, with the activity time between ~3.89 and 3.84 Ga. (d) Coverage of ejecta material, the mare basalt was covered with high-albedo ejecta materials. (e) Exposed mare basalt. The crater excavated the buried mare basalt, which formed the present stage of the cryptomare. The processes in(d) and (e) are interlaced and have a broad time span. For example, the ejecta of Crater Angraus were formed in the Imbrian while Crater Langrenus was formed in the Copernican. |
5 Conclusions
This work employs Kaguya MI, LROC WAC, WACNS, NAC, GLD 100, Chandrayaan-1 M3, OMAT, and LP GRS data to reveal the extent, chemical component, mineral composition, topographical features, and the processes of formation of the cryptomare in the B-K region. The conclusions of this paper are as follows:
- (1)
The MI and lunar sample data were adopted to obtain the high-resolution content data of Al2O3, CaO, FeO, MgO, and TiO2 by the POS-SVM model. The R2 values of Al2O3, CaO, MgO, TiO2, and FeO are 0.9479, 0.8373, 0.8020, 0.8871, and 0.941, respectively. These maps, based on MI data at a relatively high precision of 59 m pixel−1, discard the influence of terrain shadow.
- (2)
We identified the mare basalt exposed in the B-K region. The FeO content is 12.59–14.43 wt.%, located near the fresh craters and displays the characteristics of high-calcium pyroxene. We concluded that a cryptomare is present in the B-K region, and its distribution extent was determined based on characteristics of the exposed mare basalts in the vicinity of the fresh craters.
- (3)
Thiswork improves the method for identifying the cryptomare, which eliminates the influence of pyroclastic materials and mafic impact-melt breccias, and without the influence of terrain shadow. Using this method, the exposed mare basalt around the DMC in the B-K region was identified. Based on the chemical components maps, together with topographic data, the extent of the cryptomare was redefined. Compared with the results of Whitten & Head (2015a), the extent of cryptomare identified to date has been expanded thanks to this work. The extent and volume of buried cryptomare basalt is bigger than previously thought. It is implied that the ancient volcanic activity was longer in duration and extent than previously estimated. The cryptomare basalt in the B-K region probably filled the Vendelinus Crater, but was covered by younger mare basalt from Mare Fecunditatis.
- (4)
The buried mare basalt in the B-K region are high-Al basalts. These high-Al basalts are derived from the same period of volcanism. The high-Al basalt of cryptomare is different from the composition of exposed mare basalts in Mare Fecunditatis and Crater Vendelinus. This may be due to the different of quantity from ejecta, or the different genesis of the mare basalts. The ancient mare basalts were possibly buried at the bottom of the Crater Vendelinus and later covered with young mare basalts from the Mare Fecunditatis.
- (5)
The source of the high-albedo ejecta materials in the B-K region are inferred from the thickness model of the crater ejecta. The high-albedo material covering the cryptomare in the B-K region was mainly from the Langrenus, Petavius, Humboldt, La Perouse, and Angarus Craters, and partly from the Orientale Basin impact event, and potentially from the Imbrium Basin impact event. Combined with the surrounding topography and stratigraphic relationships, it is likely that the process of formation of the cryptomare in the B-K region was divided into the five formation stages of Balmer Basin formation, ejecta coverage of large basins in the Nectarian and Pre-Nectarian periods, underplating or eruption of the mare basalt, and coverage of ejecta material and exposed mare basalt. At this stage, there is a shortcomingin the estimation of the thickness and volume of the cryptomare basalt using morphological methods compared to the true values. Using high -resolution gravity data may be a good solution to the problem in the future.
Acknowledgements
We appreciate the Japan Aerospace Exploration Agency and the University of Hawaii for providing the Kaguya Multiband Imager (https://planetarymaps.usgs.gov/mosaic/Lunar_MI_ multispectral_maps/). We also appreciate the LROC team for providing the LROC WAC, WACNS, NAC and GLD 100 data (http://wms.lroc.asu.edu/lroc/rdr_product_select#_ui-id-1), the Lunar Prospector team for providing the LP GRS data (https://pds-geosciences.wustl.edu/lunar/lp-l-grs-5-elem-abundance-v1/), and the M3 team for providing the M3 reflectance data (https://pds-imaging.jpl.nasa.gov/volumes/m3.html). F.L. is supported by the National Natural Science Foundation of China (42030110, 41874010), and J.Y. is supported by Innovation Group of Natural Fund of Hubei Province (2018CFA087).
Appendix A Tables
Lunar sample information.
Appendix B Figures
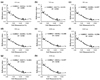 |
Fig. B.1 Nonlinear relations between FeO contents and the reflectance values of Kaguya Multiband Imager (a) 414 nm, (b) 749 nm, (c) 901 nm, (d) 950 nm, (e) 1000 nm, (f) 1049 nm, (g) 1248 nm, and (h) 1548 nm. |
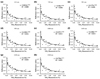 |
Fig. B.2 Nonlinear relations between TiO2 contents and the reflectance values of Kaguya Multiband Imager (a) 414 nm, (b) 749 nm, (c) 901 nm, (d) 950 nm, (e) 1000 nm, (f) 1049 nm, (g) 1248 nm, and (h) 1548 nm. |
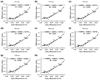 |
Fig. B.3 Nonlinear relations between Al2O3 contents and the reflectance values of Kaguya Multiband Imager (a) 414 nm, (b) 749 nm, (c) 901 nm, (d) 950 nm, (e) 1000 nm, (f) 1049 nm, (g) 1248 nm, and (h) 1548 nm. |
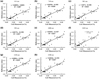 |
Fig. B.4 Linear relations between CaO contents and the reflectance values of Kaguya Multiband Imager (a) 414 nm, (b) 749 nm, (c) 901 nm, (d) 950 nm, (e) 1000 nm, (f) 1049 nm, (g) 1248 nm and, (h) 1548 nm. |
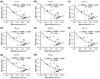 |
Fig. B.5 Nonlinear relations between MgO contents and the reflectance values of Kaguya Multiband Imager (a) 414 nm, (b) 749 nm, (c) 901 nm, (d) 950 nm, (e) 1000 nm, (f) 1049 nm, (g) 1248 nm, and (h) 1548 nm. |
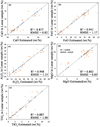 |
Fig. B.6 Scatter plots of the Lunar sample and estimated values for (a) CaO, (b) FeO, (c) Al2O3, (d) MgO, and (e) TiO2. |
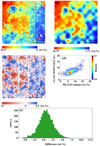 |
Fig. B.7 Comparison of the FeO content between Support Vector Machines (SVM) Kaguya Multiband Imager (MI) and Lunar Prospector (LP): (a) the FeO content from SVM MI. (b) the FeO content from LP. (c) Diagram of the difference between SVM MI and LP. A value >0 indicates a higher value of FeO content from SVM MI. (d) Comparative scatter plot of SVM MI and LP. (e) Histogram of differences in (c). The MI data is resampledto the same resolution as the LP data for comparison between two data. |
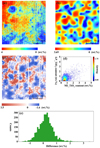 |
Fig. B.8 Comparison of the TiO2 content between Support Vector Machines (SVM) Kaguya Multiband Imager (MI) and Lunar Prospector (LP): (a) the TiO2 content fromSVM MI. (b) the TiO2 content from LP. (c) Diagram of the difference between SVM MI and LP. A value >0 indicates a higher value of TiO2 content from SVM MI. (d) Comparative scatter plot of SVM MI and LP. (e) Histogram of differences in (c). |
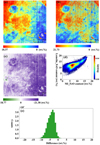 |
Fig. B.9 Comparison of the FeO content between Support Vector Machines (SVM) Kaguya Multiband Imager (MI) and the analysis of Lemelin et al. (2015) MI: (a) the FeO content from SVM MI. (b) the FeO content from Lemelin et al. (2015). (c) Diagram of the difference between SVM MI and Lemelin et al. (2015) MI. A value >0 indicates a higher value of FeO content fromSVM MI. (d) Comparative scatter plot of SVM MI and Lemelin et al. (2015) MI. (e) Histogram of differences in (c). |
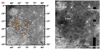 |
Fig. B.10 Balmer-Kapteyn region image maps from (a) Wang & Qiu (2018) and (b) Hawke et al. (2005). The DHC 53 in (a) corresponds to the DHC 14 in (b). |
References
- Antonenko, I. 2013, LPI, 2607 [Google Scholar]
- Antonenko, I., Head, J. W., Mustard, J. F., & Ray Hawke, B. 1995, Earth Moon Planets, 69, 141 [NASA ADS] [CrossRef] [Google Scholar]
- Besse, S., Sunshine, J., Staid, M., et al. 2013, Icarus, 222, 229 [NASA ADS] [CrossRef] [Google Scholar]
- Bhatt, M., Wöhler, C., Grumpe, A., Hasebe, N., & Naito, M. 2019, A&A, 627, A155 [NASA ADS] [CrossRef] [EDP Sciences] [Google Scholar]
- Boardman, J. W., & Kruse, F. A. 2011, IEEE Trans. Geosci. Remote Sens., 49, 4138 [NASA ADS] [CrossRef] [Google Scholar]
- Burrough, P. A., McDonnell, R., McDonnell, R. A., & Lloyd, C. D. 2015, Principles of Geographical Information Systems (Oxford: Oxford university press) [Google Scholar]
- Campbell, B. A., & Hawke, B. R. 2005, J. Geophys. Res. Planets, 110, E09002 [CrossRef] [Google Scholar]
- Cheek, L. C., Pieters, C. M., Boardman, J. W., et al. 2011, J. Geophys. Res. Planets, 116, E6 [CrossRef] [Google Scholar]
- Clark, R. N., Pieters, C. M., Green, R. O., Boardman, J. W., & Petro, N. E. 2011, J. Geophys. Res. Planets, 116, E6 [CrossRef] [Google Scholar]
- Cord, A., Baratoux, D., Mangold, N., et al. 2007, Icarus, 191, 38 [NASA ADS] [CrossRef] [Google Scholar]
- Cortes, C., & Vapnik, V. 1995, Mach. learn., 20, 273 [NASA ADS] [Google Scholar]
- Day, J. M. D., Taylor, L. A., Floss, C., et al. 2006, Geochim. Cosmochim. Acta, 70, 1581 [NASA ADS] [CrossRef] [Google Scholar]
- Elardo, S. M., Shearer Jr, C. K., Fagan, A. L., et al. 2014, Meteor. Planet. Sci., 49, 261 [CrossRef] [Google Scholar]
- Fagan, A. L., & Neal, C. R. 2016, Geochim. Cosmochim. Acta, 173, 352 [NASA ADS] [CrossRef] [Google Scholar]
- Giguere, T. A., Hawke, B. R., Gaddis, L. R., et al. 2006, J. Geophys. Res. Planets, 111, E06009 [CrossRef] [Google Scholar]
- Gnos, E., Hofmann, B. A., Al-Kathiri, A., et al. 2004, Science, 305, 657 [NASA ADS] [CrossRef] [Google Scholar]
- Green, R. O., Pieters, C., Mouroulis, P., et al. 2011, J. Geophys. Res. Planets, 116, E10 [CrossRef] [Google Scholar]
- Greshake, A., Irving, A. J., Kuehner, S. M., et al. 2008, LPI, 1631 [Google Scholar]
- Haloda, J., Korotev, R. L., Tycova, P., Jakes, P., & Gabzdyl, P. 2006, LPI, 2269 [Google Scholar]
- Haloda, J., Týcová, P., Korotev, R. L., et al. 2009, Geochim. Cosmochim. Acta, 73, 3450 [NASA ADS] [CrossRef] [Google Scholar]
- Hartmann, W. K., & Wood, C. A. 1971, The Moon, 3, 3 [NASA ADS] [CrossRef] [Google Scholar]
- Haskin, L., & Warren, P. 1991, Lunar Sourcebook (Cambridge: Cambridge University Press), 4, 357 [NASA ADS] [Google Scholar]
- Hawke, B. R., & Head, J. W. 1977, in Impact and explosion cratering: Planetary and Terrestrial Implications (New York: Pergamon Press, Inc.), 815 [Google Scholar]
- Hawke, B. R., & Spudis, P. D. 1980, in Lunar Highlands Crust (Amsterdam: Elsevier), 467 [Google Scholar]
- Hawke, B. R., Spudis, P. D., & Clark, P. E. 1985, Earth Moon Planets, 32, 257 [NASA ADS] [CrossRef] [Google Scholar]
- Hawke, B. R., Coombs, C. R., Gaddis, L. R., Lucey, P. G., & Owensby, P. D. 1989, Lunar Planet. Sci. Conf. Proc., 19, 255 [Google Scholar]
- Hawke, B. R., Gillis, J. J., Giguere, T. A., et al. 2005, J. Geophys. Res. Planets, 110, E6 [CrossRef] [Google Scholar]
- Hawke, B. R., Giguere, T. A., Peterson, C. A., et al. 2015, LPI, 1310 [Google Scholar]
- Head III, J. W., & Wilson, L. 1992, Geochim. Cosmochim. Acta, 56, 2155 [CrossRef] [Google Scholar]
- Kennedy, J., & Eberhart, R. 1995, in Proceedings of ICNN’95-International Conference on Neural Networks, 4 (IEEE), 1942 [CrossRef] [Google Scholar]
- Klem, S. M., Henriksen, M. R., Stopar, J., Boyd, A., & Robinson, M. S. 2014, LPI, 2885 [Google Scholar]
- Klima, R. L., Pieters, C. M., & Dyar, M. D. 2007, Meteor. Planet. Sci., 42, 235 [NASA ADS] [CrossRef] [Google Scholar]
- Klima, R. L., Dyar, M. D., & Pieters, C. M. 2011, Meteor. Planet. Sci., 46, 379 [NASA ADS] [CrossRef] [Google Scholar]
- Kohavi, R. 1995 Montreal Canada, 14, 1137 [Google Scholar]
- Korokhin, V. V., Kaydash, V. G., Shkuratov, Y. G., Stankevich, D. G., & Mall, U. 2008, Planet. Space Sci., 56, 1063 [NASA ADS] [CrossRef] [Google Scholar]
- Kramer, G. Y., Jolliff, B. L., & Neal, C. R. 2008, Icarus, 198, 7 [NASA ADS] [CrossRef] [Google Scholar]
- Lawrence, D. J., Feldman, W. C., Elphic, R. C., et al. 2002, J. Geophys. Res. E Planets, 107, E12 [Google Scholar]
- Lemelin, M., Lucey, P. G., Song, E., & Taylor, G. J. 2015, J. Geophys. Res. Planets, 120, 869 [NASA ADS] [CrossRef] [Google Scholar]
- Lemelin, M., Lucey, P. G., Gaddis, L. R., Hare, T., & Ohtake, M. 2016, LPI, 2994 [Google Scholar]
- Lucey, P. G., Taylor, G. J., & Malaret, E. 1995, Science, 268, 1150 [NASA ADS] [CrossRef] [Google Scholar]
- Lucey, P. G., Taylor, G. J., Hawke, B. R., & Spudis, P. D. 1998, J. Geophys. Res. Planets, 103, 3701 [NASA ADS] [CrossRef] [Google Scholar]
- Lucey, P. G., Blewett, D. T., & Jolliff, B. L. 2000, J. Geophys. Res. Planets, 105, 20297 [CrossRef] [Google Scholar]
- Lucey, P., Korotev, R. L., Gillis, J. J., et al. 2006, Rev. Mineral. Geochem., 60, 83 [CrossRef] [Google Scholar]
- Mattson, S., McEwen, A. S., Robinson, M. S., Speyerer, E., & Archinal, B. 2012, Eur. Planet. Sci. Congress, 7, 2012 [Google Scholar]
- Maxwell, T. A., & Andre, C. G. 1981, in Proceedings of the 12th Lunar and Planetary Science Conference [Google Scholar]
- McGetchin, T., Settle, M., & Head, J. 1973, Earth Planet. Sci. Lett., 20, 226 [Google Scholar]
- Mustard, J. F., Pieters, C. M., Isaacson, P. J., et al. 2011, J. Geophys. Res. Planets, 116, E6 [CrossRef] [Google Scholar]
- Ohtake, M., Pieters, C. M., Isaacson, P., et al. 2013, Icarus, 226, 364 [NASA ADS] [CrossRef] [Google Scholar]
- Orgel, C., Michael, G. G., & Kneissl, T. 2017, LPI, 1033 [Google Scholar]
- Petro, N. E., & Pieters, C. M. 2006, J. Geophys. Res., 111, E09005 [NASA ADS] [Google Scholar]
- Pieters, C. M., Stankevich, D. G., Shkuratov, Y. G., & Taylor, L. A. 2002, Icarus, 155, 285 [NASA ADS] [CrossRef] [Google Scholar]
- Pieters, C. M., Boardman, J., Buratti, B., et al. 2009, Curr. Sci., 96, 500 [Google Scholar]
- Pike, R. J. 1974, Earth Planet. Sci. Lett., 23, 265 [Google Scholar]
- Prettyman, T. H. 2012, Lunar prospector Gamma Ray spectrometer elemental abundance, Technical Report [Google Scholar]
- Prettyman, T. H., Hagerty, J. J., Elphic, R. C., et al. 2006, J. Geophys. Res. Planets, 111, E12 [Google Scholar]
- Ryder, G., & Spudis, P. 1980, in Lunar highlands crust (Amsterdam: Elsevier), 353 [Google Scholar]
- Ryder, G., Stoeser, D. B., & Wood, J. A. 1977, Earth Planet. Sci. Lett., 35, 1 [Google Scholar]
- Sato, H., Robinson, M. S., Lawrence, S. J., et al. 2017, Icarus, 296, 216 [NASA ADS] [CrossRef] [Google Scholar]
- Scholten, F., Oberst, J., Matz, K.-D., et al. 2011, LPI, 2046 [Google Scholar]
- Schultz, P. H., & Spudis, P. D. 1979, Proc. Lunar Planet. Sci. Conf., 10, 2899 [Google Scholar]
- Shearer, C. K., Hess, P. C., Wieczorek, M. A., et al. 2006, Rev. Mineral. Geochem., 60, 365 [CrossRef] [Google Scholar]
- Shkuratov, Y. G., Kaydash, V. G., & Opanasenko, N. V. 1999, Icarus, 137, 222 [NASA ADS] [CrossRef] [Google Scholar]
- Snape, J. F., Joy, K. H., & Crawford, I. A. 2011, Meteor. Planet. Sci., 46, 1288 [NASA ADS] [CrossRef] [Google Scholar]
- Speyerer, E., Robinson, M. S., Boyd, A., & Sato, H. 2012, AGUFM, 2012, P43B [Google Scholar]
- Sun, Y., Babu, P., & Palomar, D. P. 2016, IEEE Trans. Signal Process., 65, 794 [Google Scholar]
- Swindle, T., Spudis, P., Taylor, G., et al. 1991, Lunar Planet. Sci. Conf. Proc., 21, 167 [Google Scholar]
- Terada, K., Anand, M., Sokol, A. K., Bischoff, A., & Sano, Y. 2007, Nature, 450, 849 [NASA ADS] [CrossRef] [Google Scholar]
- Vapnik, V., & Lerner, A. Y. 1963, Avtomat. i Telemekh, 24, 774 [Google Scholar]
- Wang, X., & Qiu, D. 2018, J. Geophys. Res. Planets, 123, 3238 [NASA ADS] [Google Scholar]
- Warren, P. H., & Kallemeyn, G. W. 1993, Antarctic Meteor. Res., 6, 35 [Google Scholar]
- Whitten, J., & Head, J. W. 2015a, Planet. Space Sci., 106, 67 [NASA ADS] [CrossRef] [Google Scholar]
- Whitten, J. L., & Head, J. W. 2015b, Icarus, 247, 150 [NASA ADS] [CrossRef] [Google Scholar]
- Wieczorek, M. A., Jolliff, B. L., Khan, A., et al. 2006, Rev. Mineral. Geochem., 60, 221 [Google Scholar]
- Wilhelms, D. E. 1970, Summary of Lunar Stratigraphy: Telescopic Observations; Contributions to Astrogeology (US Geological Survey) [Google Scholar]
- Wilhelms, D. E., John, F., & Trask, N. J. 1987, The geologic history of the Moon, Technical Report [Google Scholar]
- Wu, Y. 2012, Geochim. Cosmochim. Acta, 93, 214 [NASA ADS] [CrossRef] [Google Scholar]
- Xia, W., Wang, X., Zhao, S., et al. 2019, Icarus, 321, 200 [NASA ADS] [CrossRef] [Google Scholar]
- Yingst, R. A.,& Head, J. W. 1997, J. Geophys. Res. E Planets, 102, 10909 [NASA ADS] [CrossRef] [Google Scholar]
- Zeigler, R. A., Korotev, R. L., Jolliff, B. L., & Haskin, L. A. 2005, Meteorit. Planet. Sci., 40, 1073 [NASA ADS] [CrossRef] [Google Scholar]
- Zeigler, R. A., Korotev, R. L., Haskin, L. A., Jollif, B. L., & Gillis, J. J. 2006, Meteorit. Planet. Sci., 41, 263 [NASA ADS] [CrossRef] [Google Scholar]
- Zhang, J., Yang, W., Hu, S., et al. 2015, Proc. Natl. Acad. Sci., 112, 5342 [NASA ADS] [CrossRef] [Google Scholar]
- Zhong, Z., Li, F., Yan, J., Yan, P., & Dohm, J. M. 2014, Adv. Space Res., 54, 770 [NASA ADS] [CrossRef] [Google Scholar]
All Tables
Oxide abundances statistics for 409 mare basalt exposed units in the Balmer-Kapteyn region.
All Figures
|
Fig. 1 Image of Balmer-Kapteyn region (data ID: WAC_GLOBAL_E300N0450_100M.IMG). Several craters in the area are marked (a). Elevation map of the Balmer-Kapteyn region (data ID: WAC_GLD100_E300S0450_100M.IMG) (b). The outer ring and inner ring of the Balmer-Kapteyn region is marked out by the black dotted line. |
| In the text | |
|
Fig. 2 Diagram of surface roughness calculation. |
| In the text | |
|
Fig. 3 Flowchart of the Particle Swarm Optimizer Support Vector Machines model for estimating the five oxide contents. The Kaguya Multiband Imager data shown in the graph exhibit a false color composition (R: absorption depth at 950 nm; G: absorption depth at 1050 nm; B absorption depth at 1250 nm). |
| In the text | |
|
Fig. 4 Main geological units map of the Balmer-Kapteyn region. The background is the Wide Angle Camera Global Morphologic basemap (data ID: WAC_GLOBAL_E300N0450_100M.IMG). Cc, material of rayed craters; Ip, light-colored plains material; INp, light-colored plains material (Imbrian or Nectarian); Ic1, material of moderately subdued circular craters; Ic2, material of moderately fresh circular craters; Im2, younger mare material. |
| In the text | |
|
Fig. 5 Maps of the regional topography in the Balmer-Kapteyn region: (a) slope map of Balmer-Kapteyn region. (b) Roughness map of Balmer-Kapteyn region. The greater the roughness, the greater the surface fluctuation. |
| In the text | |
|
Fig. 6 Maps of the chemical components in the Balmer-Kapteyn region: (a) FeO abundance. (b) TiO2 abundance. (c) MgO abundance. (d) Al2O3 abundance. (e) CaO abundance. (f) Mg# map. (g) Th content. (h) OMAT map. The maps of oxide abundances were generated from the Kaguya Multiband Imager data (Ohtake et al. 2013), and the Th map was determined based on data from the Lunar Prospector Gamma-Ray and Neutron Spectrometers (Prettyman et al. 2006; Prettyman 2012). |
| In the text | |
|
Fig. 7 M3 spectral analysis of the Balmer-Kapteyn region: (a) M3 color composite map of the Balmer-Kapteyn region (R: IBD 1000, G: IBD 2000, B: 1580 nm reflectance). The M3 in the figure uses the optical period OP2C data (data ID: M3G20090604T023806_V01_ L2_MAP, M3G20090603T050442_V01_L2_MAP, M3G20090603T134223_V01_L2_MAP, M3G20090603T174502_V01_L2_MAP, M3G20090603T221232_V01_L2_MAP). The background is the Wide Angle Camera Global Morphologic basemap (data ID: WAC_GLOBAL_E300N0450_100M.IMG). (b) M3 reflectance spectra extracted from the area pointed by black arrows in panel a. (c) M3 continuum-removed spectra of the same spots. Plagioclase-rich material is blue and pyroxene-rich material is yellow on the M3 color composite map. |
| In the text | |
|
Fig. 8 Maps of the mare basalt exposed units in the Balmer-Kapteyn region. The background is the Wide Angle Camera Global Morphologic basemap (data ID: WAC_GLOBAL_E300N0450_100M.IMG). The yellow patches are mare basalt exposed. (a) Exposed mare in the Balmer-Kapteyn region. (b) and (c) Some areas of exposed mare. |
| In the text | |
|
Fig. 9 Chemical comparisons of the mare basalt exposed units in the Balmer-Kapteyn region with other rock types: (a) comparison in the FeO-Al2O3 content space. (b) Comparison in the Al2O3-MgO content space. (c) Comparison in the FeO-MgO content space. (d) Comparison in the FeO-TiO2 content space. Two sets of lunar rock samples are involved: one is 125 returned lunar rock samples by the Apollo and Luna missions and the other is 30 lunar meteorite samples, including 26 unbrecciated basalts from the meteorites of Yamato 793169, La Paz Icefield (LAP) 02005, 02224, 02226, 02436, 03632, Northwest Africa (NWA) 032/479, NWA 4734, NWA4898, and Northeast Africa (NEA) 003, 3 mare basalt clasts of Northeast Africa (NEA) 001 and one KREEP clast of Sayh al Uhaymir (SaU)169. The chemical components of the Apollo and Luna samples are reported by Wieczorek et al. (2006); Zeigler et al. (2006); Fagan & Neal (2016). The chemical components of the meteorites were reported by Warren & Kallemeyn (1993); Gnos et al. (2004); Zeigler et al. (2005); Day et al. (2006); Greshake et al. (2008); Elardo et al. (2014); Haloda et al. (2006, 2009). |
| In the text | |
|
Fig. 10 Comparison of the 1000 and 2000 nm band centers for spectral pairs of the optical period OP2C1 and OP1B M3 data. The band centers measured in the laboratory for synthetic pure pyroxene (Klima et al. 2007, 2011). |
| In the text | |
|
Fig. 11 Maps of the cryptomare distribution in the Balmer-Kapteyn region: (a) The result of Whitten & Head (2015a). The yellow zone represents the cryptomare. (b) The result in this work. The yellow zone represents the cryptomare and the green zone represents mare basalt exposed. (c) Topographic profile of the AA’ in panel b. (d) Topographic profile of the BB’ in panel b. |
| In the text | |
|
Fig. 12 Formation of cryptomare in the Balmer-Kapteyn region: (a) formation of the Balmer Basin, ~4.2 Ga. (b) Ejecta coverage of large basins in the Nectarian and Pre-Nectarian after the formation of the Balmer Basin until the mare basalt filled. (c) Underplating or eruption of the mare basalt, where the mare basalt was exposed on the lunar surface and may have mixed with early basin ejecta, with the activity time between ~3.89 and 3.84 Ga. (d) Coverage of ejecta material, the mare basalt was covered with high-albedo ejecta materials. (e) Exposed mare basalt. The crater excavated the buried mare basalt, which formed the present stage of the cryptomare. The processes in(d) and (e) are interlaced and have a broad time span. For example, the ejecta of Crater Angraus were formed in the Imbrian while Crater Langrenus was formed in the Copernican. |
| In the text | |
|
Fig. B.1 Nonlinear relations between FeO contents and the reflectance values of Kaguya Multiband Imager (a) 414 nm, (b) 749 nm, (c) 901 nm, (d) 950 nm, (e) 1000 nm, (f) 1049 nm, (g) 1248 nm, and (h) 1548 nm. |
| In the text | |
|
Fig. B.2 Nonlinear relations between TiO2 contents and the reflectance values of Kaguya Multiband Imager (a) 414 nm, (b) 749 nm, (c) 901 nm, (d) 950 nm, (e) 1000 nm, (f) 1049 nm, (g) 1248 nm, and (h) 1548 nm. |
| In the text | |
|
Fig. B.3 Nonlinear relations between Al2O3 contents and the reflectance values of Kaguya Multiband Imager (a) 414 nm, (b) 749 nm, (c) 901 nm, (d) 950 nm, (e) 1000 nm, (f) 1049 nm, (g) 1248 nm, and (h) 1548 nm. |
| In the text | |
|
Fig. B.4 Linear relations between CaO contents and the reflectance values of Kaguya Multiband Imager (a) 414 nm, (b) 749 nm, (c) 901 nm, (d) 950 nm, (e) 1000 nm, (f) 1049 nm, (g) 1248 nm and, (h) 1548 nm. |
| In the text | |
|
Fig. B.5 Nonlinear relations between MgO contents and the reflectance values of Kaguya Multiband Imager (a) 414 nm, (b) 749 nm, (c) 901 nm, (d) 950 nm, (e) 1000 nm, (f) 1049 nm, (g) 1248 nm, and (h) 1548 nm. |
| In the text | |
|
Fig. B.6 Scatter plots of the Lunar sample and estimated values for (a) CaO, (b) FeO, (c) Al2O3, (d) MgO, and (e) TiO2. |
| In the text | |
|
Fig. B.7 Comparison of the FeO content between Support Vector Machines (SVM) Kaguya Multiband Imager (MI) and Lunar Prospector (LP): (a) the FeO content from SVM MI. (b) the FeO content from LP. (c) Diagram of the difference between SVM MI and LP. A value >0 indicates a higher value of FeO content from SVM MI. (d) Comparative scatter plot of SVM MI and LP. (e) Histogram of differences in (c). The MI data is resampledto the same resolution as the LP data for comparison between two data. |
| In the text | |
|
Fig. B.8 Comparison of the TiO2 content between Support Vector Machines (SVM) Kaguya Multiband Imager (MI) and Lunar Prospector (LP): (a) the TiO2 content fromSVM MI. (b) the TiO2 content from LP. (c) Diagram of the difference between SVM MI and LP. A value >0 indicates a higher value of TiO2 content from SVM MI. (d) Comparative scatter plot of SVM MI and LP. (e) Histogram of differences in (c). |
| In the text | |
|
Fig. B.9 Comparison of the FeO content between Support Vector Machines (SVM) Kaguya Multiband Imager (MI) and the analysis of Lemelin et al. (2015) MI: (a) the FeO content from SVM MI. (b) the FeO content from Lemelin et al. (2015). (c) Diagram of the difference between SVM MI and Lemelin et al. (2015) MI. A value >0 indicates a higher value of FeO content fromSVM MI. (d) Comparative scatter plot of SVM MI and Lemelin et al. (2015) MI. (e) Histogram of differences in (c). |
| In the text | |
|
Fig. B.10 Balmer-Kapteyn region image maps from (a) Wang & Qiu (2018) and (b) Hawke et al. (2005). The DHC 53 in (a) corresponds to the DHC 14 in (b). |
| In the text | |
Current usage metrics show cumulative count of Article Views (full-text article views including HTML views, PDF and ePub downloads, according to the available data) and Abstracts Views on Vision4Press platform.
Data correspond to usage on the plateform after 2015. The current usage metrics is available 48-96 hours after online publication and is updated daily on week days.
Initial download of the metrics may take a while.