Fig. 7
Download original image
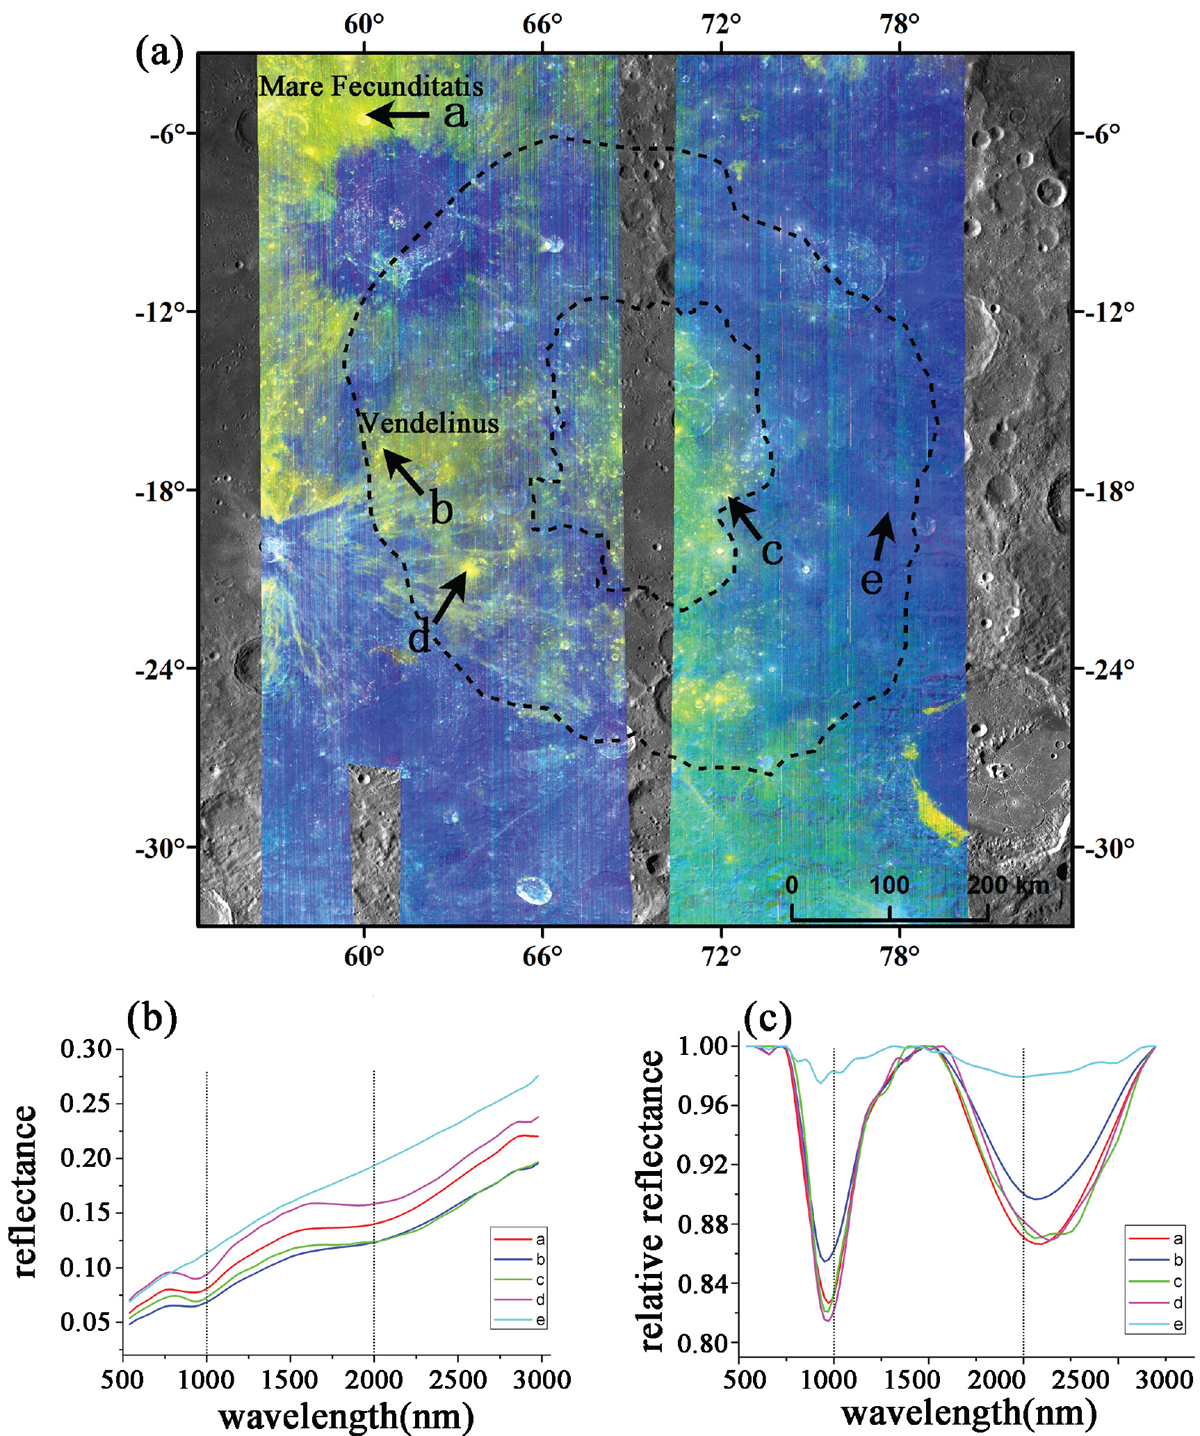
M3 spectral analysis of the Balmer-Kapteyn region: (a) M3 color composite map of the Balmer-Kapteyn region (R: IBD 1000, G: IBD 2000, B: 1580 nm reflectance). The M3 in the figure uses the optical period OP2C data (data ID: M3G20090604T023806_V01_ L2_MAP, M3G20090603T050442_V01_L2_MAP, M3G20090603T134223_V01_L2_MAP, M3G20090603T174502_V01_L2_MAP, M3G20090603T221232_V01_L2_MAP). The background is the Wide Angle Camera Global Morphologic basemap (data ID: WAC_GLOBAL_E300N0450_100M.IMG). (b) M3 reflectance spectra extracted from the area pointed by black arrows in panel a. (c) M3 continuum-removed spectra of the same spots. Plagioclase-rich material is blue and pyroxene-rich material is yellow on the M3 color composite map.
Current usage metrics show cumulative count of Article Views (full-text article views including HTML views, PDF and ePub downloads, according to the available data) and Abstracts Views on Vision4Press platform.
Data correspond to usage on the plateform after 2015. The current usage metrics is available 48-96 hours after online publication and is updated daily on week days.
Initial download of the metrics may take a while.