Fig. B.7
Download original image
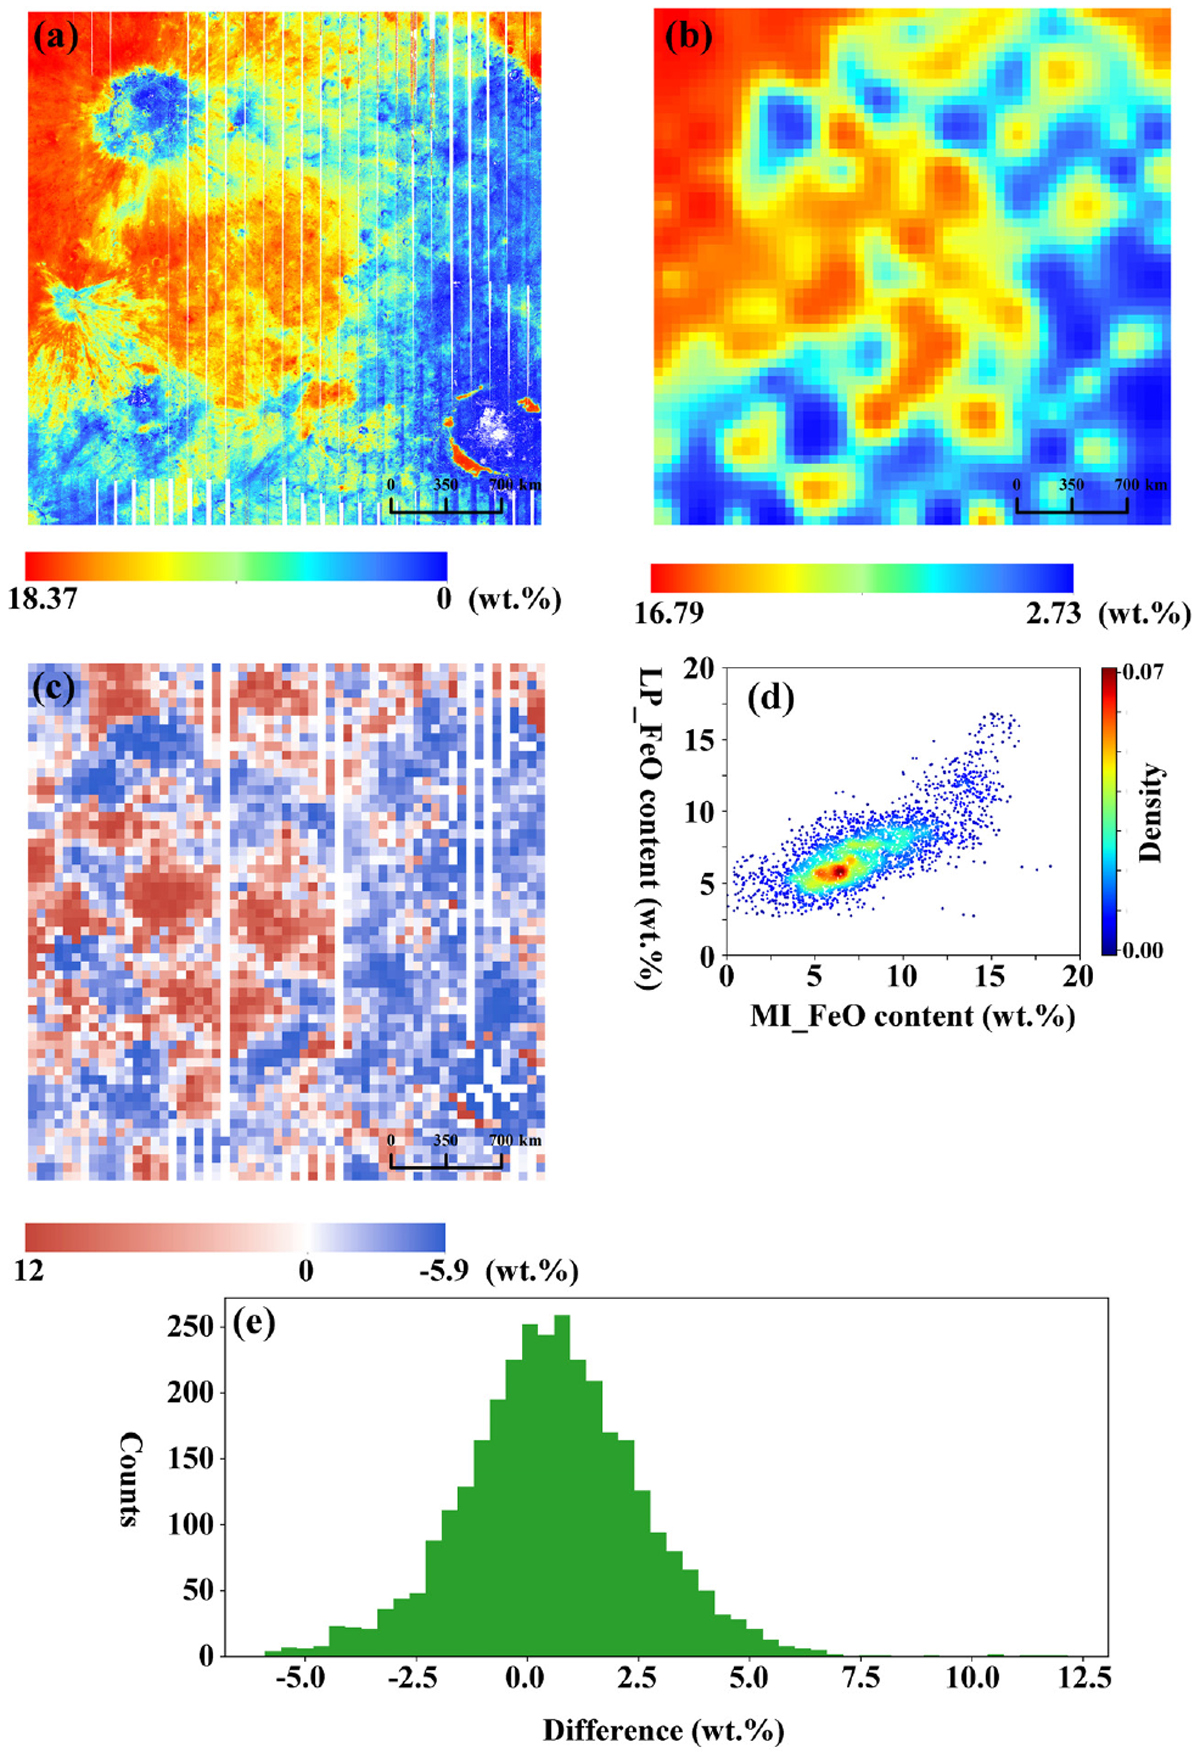
Comparison of the FeO content between Support Vector Machines (SVM) Kaguya Multiband Imager (MI) and Lunar Prospector (LP): (a) the FeO content from SVM MI. (b) the FeO content from LP. (c) Diagram of the difference between SVM MI and LP. A value >0 indicates a higher value of FeO content from SVM MI. (d) Comparative scatter plot of SVM MI and LP. (e) Histogram of differences in (c). The MI data is resampledto the same resolution as the LP data for comparison between two data.
Current usage metrics show cumulative count of Article Views (full-text article views including HTML views, PDF and ePub downloads, according to the available data) and Abstracts Views on Vision4Press platform.
Data correspond to usage on the plateform after 2015. The current usage metrics is available 48-96 hours after online publication and is updated daily on week days.
Initial download of the metrics may take a while.