Free Access
Fig. 3
Download original image
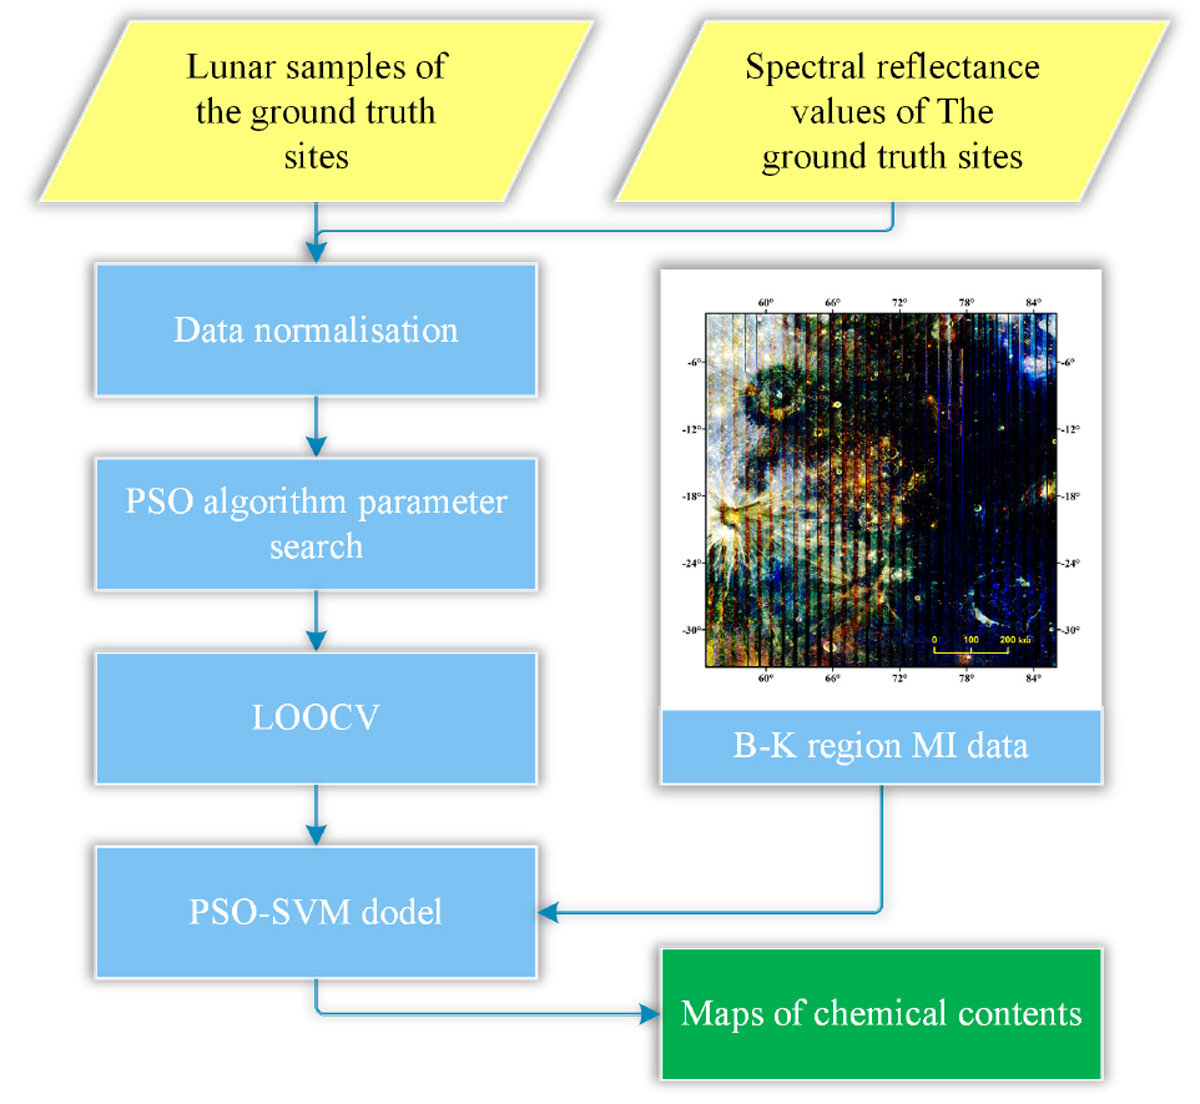
Flowchart of the Particle Swarm Optimizer Support Vector Machines model for estimating the five oxide contents. The Kaguya Multiband Imager data shown in the graph exhibit a false color composition (R: absorption depth at 950 nm; G: absorption depth at 1050 nm; B absorption depth at 1250 nm).
Current usage metrics show cumulative count of Article Views (full-text article views including HTML views, PDF and ePub downloads, according to the available data) and Abstracts Views on Vision4Press platform.
Data correspond to usage on the plateform after 2015. The current usage metrics is available 48-96 hours after online publication and is updated daily on week days.
Initial download of the metrics may take a while.