Fig. 6
Download original image
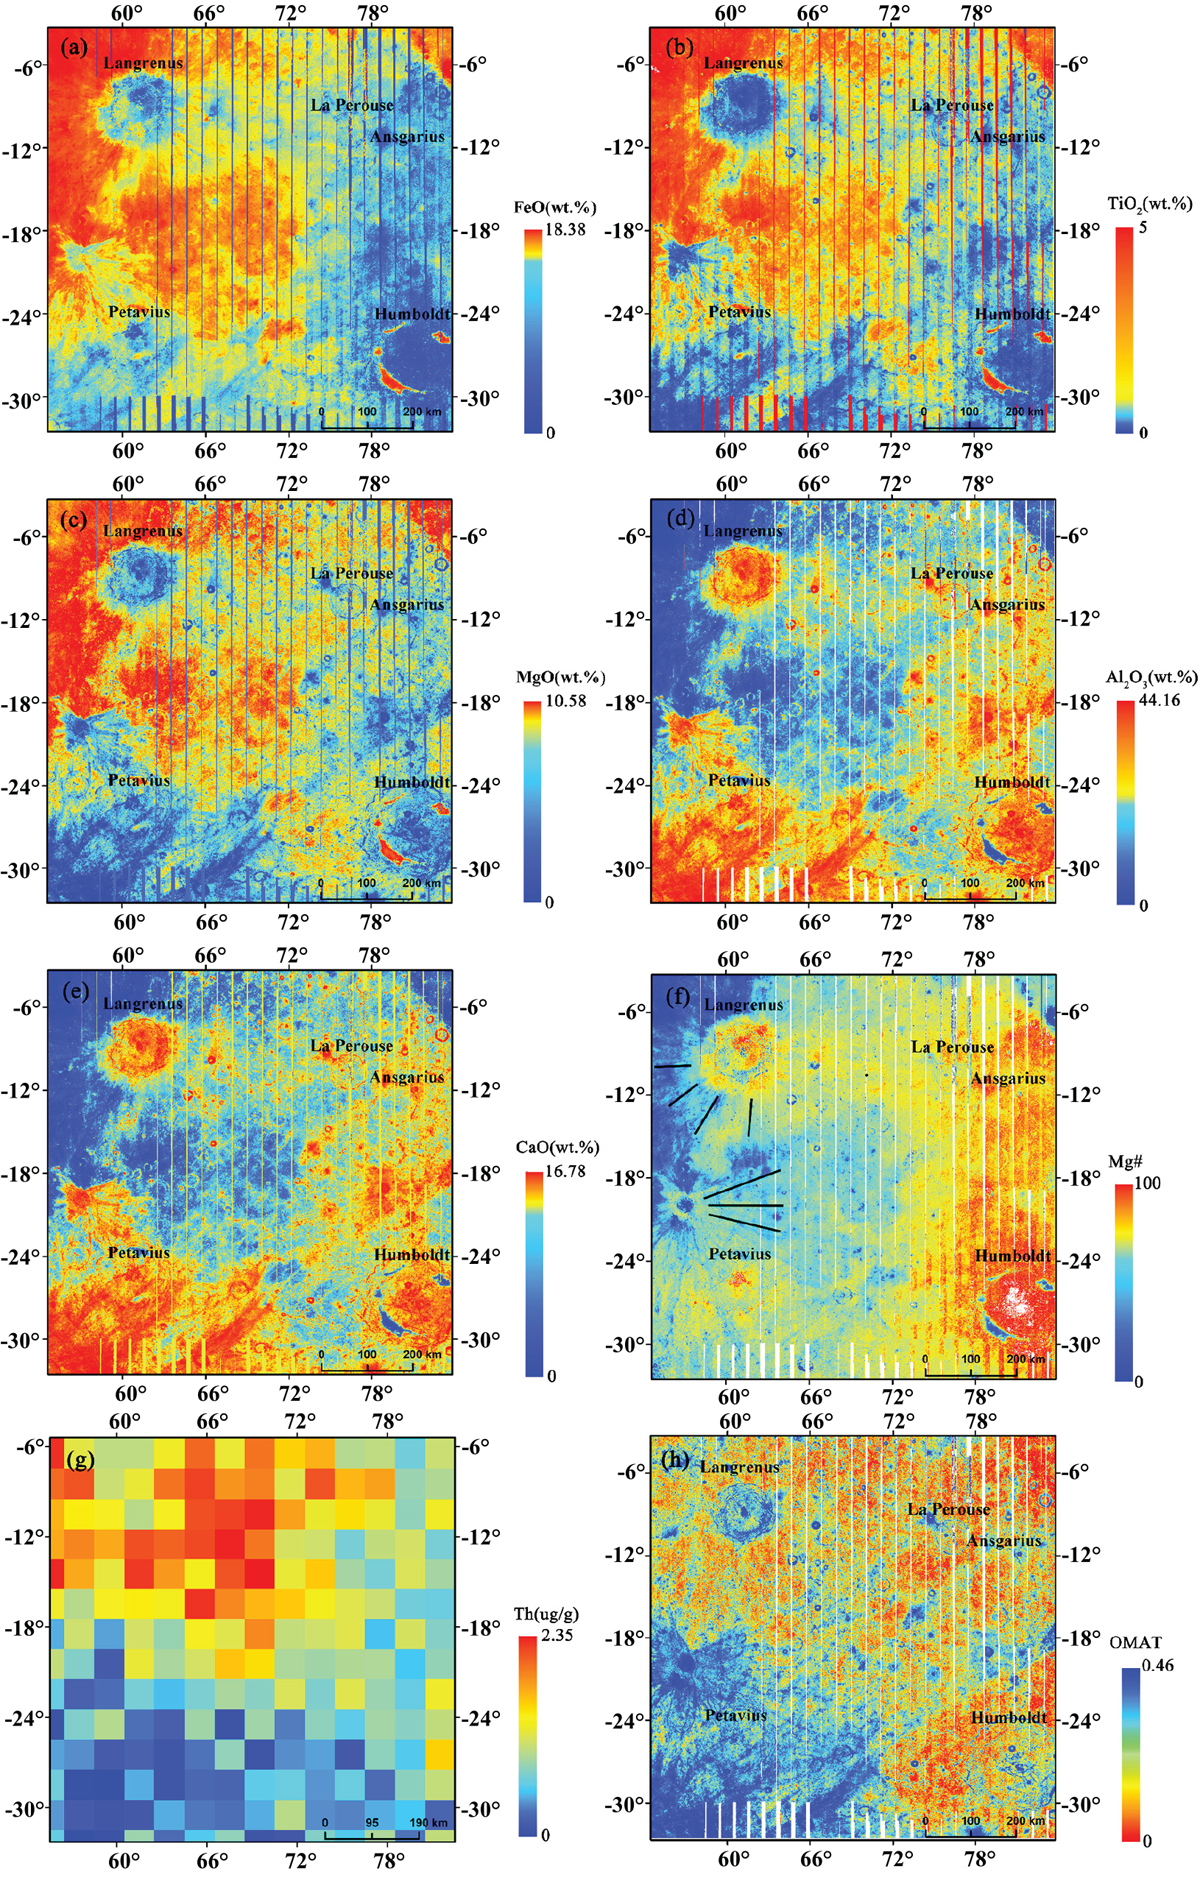
Maps of the chemical components in the Balmer-Kapteyn region: (a) FeO abundance. (b) TiO2 abundance. (c) MgO abundance. (d) Al2O3 abundance. (e) CaO abundance. (f) Mg# map. (g) Th content. (h) OMAT map. The maps of oxide abundances were generated from the Kaguya Multiband Imager data (Ohtake et al. 2013), and the Th map was determined based on data from the Lunar Prospector Gamma-Ray and Neutron Spectrometers (Prettyman et al. 2006; Prettyman 2012).
Current usage metrics show cumulative count of Article Views (full-text article views including HTML views, PDF and ePub downloads, according to the available data) and Abstracts Views on Vision4Press platform.
Data correspond to usage on the plateform after 2015. The current usage metrics is available 48-96 hours after online publication and is updated daily on week days.
Initial download of the metrics may take a while.