Fig. 11
Download original image
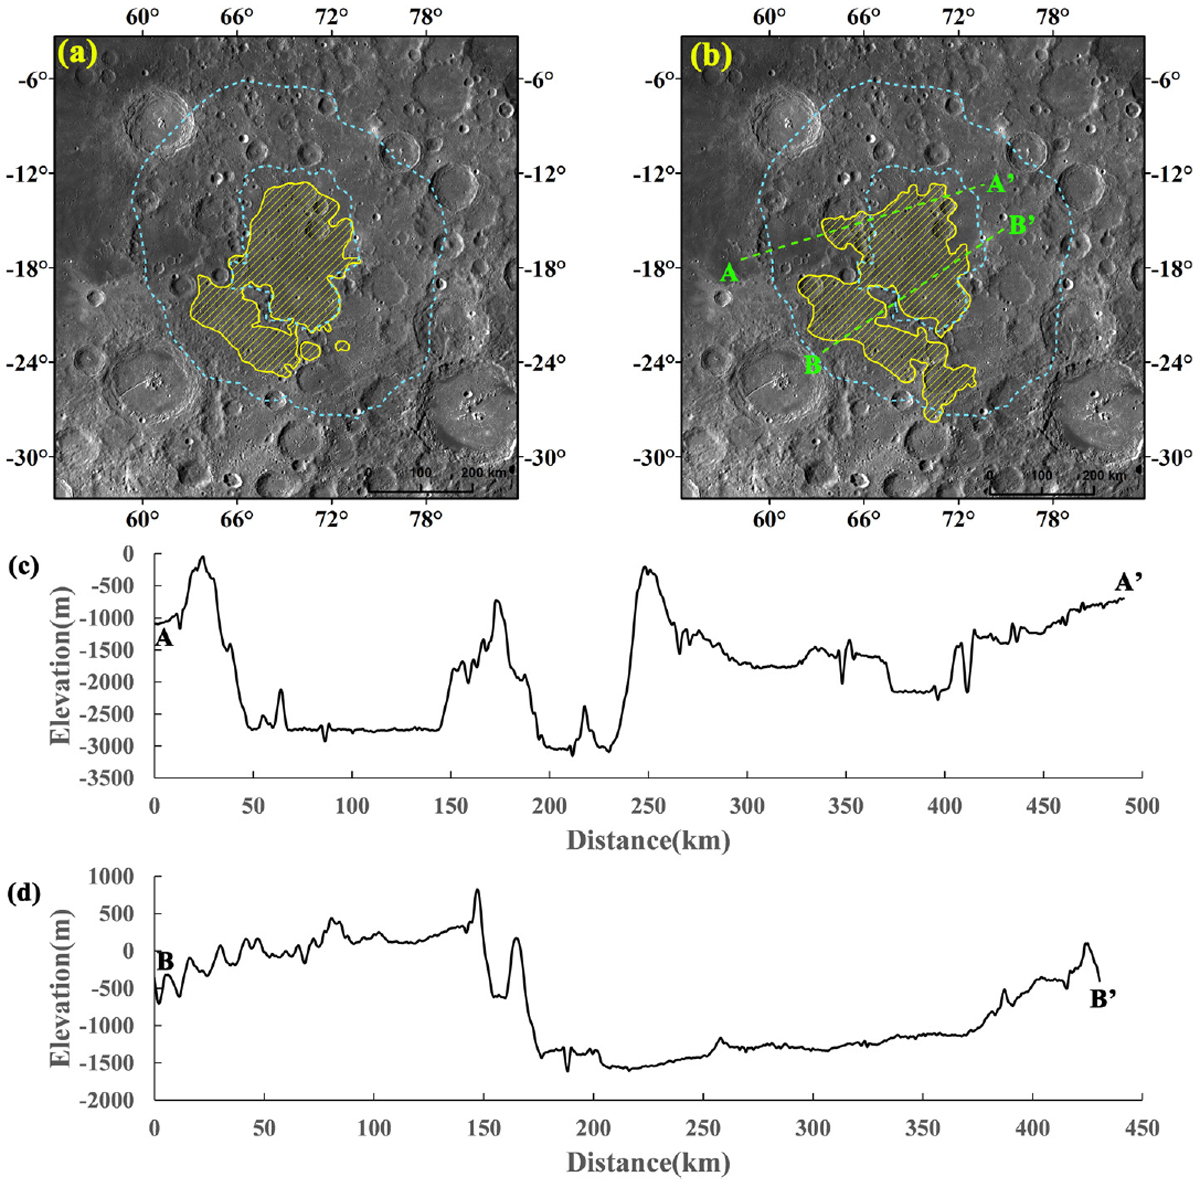
Maps of the cryptomare distribution in the Balmer-Kapteyn region: (a) The result of Whitten & Head (2015a). The yellow zone represents the cryptomare. (b) The result in this work. The yellow zone represents the cryptomare and the green zone represents mare basalt exposed. (c) Topographic profile of the AA’ in panel b. (d) Topographic profile of the BB’ in panel b.
Current usage metrics show cumulative count of Article Views (full-text article views including HTML views, PDF and ePub downloads, according to the available data) and Abstracts Views on Vision4Press platform.
Data correspond to usage on the plateform after 2015. The current usage metrics is available 48-96 hours after online publication and is updated daily on week days.
Initial download of the metrics may take a while.