| Issue |
A&A
Volume 657, January 2022
|
|
|---|---|---|
| Article Number | L15 | |
| Number of page(s) | 6 | |
| Section | Letters to the Editor | |
| DOI | https://doi.org/10.1051/0004-6361/202141870 | |
| Published online | 21 January 2022 | |
Molecular gas properties of Q1700-MD94: A massive main-sequence galaxy at z ≈ 2⋆
1
Departamento de Astronomía, Facultad de Ciencias Físicas y Matemáticas, Universidad de Concepción, Av. Esteban Iturra s/n Barrio Universitario, Casilla 160 Concepción, Chile
e-mail: kathehenriquez@udec.cl
2
Max-Planck-Institut für extraterrestische Physik (MPE), Giessenbachstr., 85748 Garching, Germany
3
Department of Astronomy, University of Maryland, College Park, MD, 20742
USA
4
Departamento de Astronomía, Universidad de Chile, Casilla 36-D, Santiago, Chile
Received:
23
July
2021
Accepted:
1
September
2021
We use a combination of new NOrthern Extended Millimeter Array (NOEMA) observations of the pair of [CI] transitions, the CO(7-6) line, and the dust continuum, in addition to ancillary CO(1-0) and CO(3-2) data, to study the molecular gas properties of Q1700-MD94. This is a massive, main-sequence galaxy at z ≈ 2. We find that for a reasonable set of assumptions for a typical massive star-forming galaxy, the CO(1-0), the [CI](1-0) and the dust continuum yield molecular gas masses that are consistent within a factor of ∼2. The global excitation properties of the molecular gas as traced by the [CI] and CO transitions are similar to those observed in other massive star-forming galaxies at z ∼ 2. Our large velocity gradient modeling using RADEX of the CO and [CI] spectral line energy distributions suggests the presence of relatively warm (Tkin = 41 K), dense (nH2 = 8 × 103 cm−3) molecular gas, comparable to the high-excitation molecular gas component observed in main-sequence star-forming galaxies at z ∼ 1. The galaxy size in the CO(1-0) and CO(7-6) line emission is comparable, which suggests that the highly excited molecular gas is distributed throughout the disk, powered by intense star formation activity. A confirmation of this scenario will require spatially resolved observations of the CO and [CI] lines, which can now be obtained with NOEMA upgraded capabilities.
Key words: galaxies: high-redshift / galaxies: ISM / galaxies: evolution
Data cubes are only available at the CDS via anonymous ftp to cdsarc.u-strasbg.fr (130.79.128.5) or via http://cdsarc.u-strasbg.fr/viz-bin/cat/J/A+A/657/L15
© ESO 2022
1. Introduction
Understanding galaxy evolution requires studying the complex interplay between multiple physical processes. One of the most important processes is star formation, which is connected to the reservoir of available molecular gas (H2), and the physical conditions that set the efficiency at which the gas is converted into stars (e.g., Kennicutt & Evans 2012). Despite its importance, measuring the amount of molecular gas in galaxies across cosmic time remains a challenge (e.g., Tacconi et al. 2020). The most common tracer of H2 gas is the first rotational transition of CO (J = 1 − 0), which becomes progressively harder to observe as the redshift of the source increases (e.g., Carilli & Walter 2013). In addition, to convert the CO(1-0) luminosity into a molecular gas mass, a conversion factor (αCO) needs to be assumed. This factor is strongly dependent on the metallicity because in low-extinction regions, the interstellar radiation field can strongly photodissociate CO molecules (e.g., Bolatto et al. 2013).
The pair of neutral carbon (C) fine-structure transitions, [CI](1-0) at 492.161 GHz and [CI](2-1) at 809.344 GHz, has emerged as an alternative to the use of the CO lines as a tracer of the molecular gas, in particular for high-redshift galaxies where the [CI] lines shift into the millimeter bands. In contrast to what is expected from the classical onion-like structure of photodissociation regions (PDRs; e.g., Hollenbach & Tielens 1999), more recent simulations suggest that neutral carbon emission appears to be widespread in H2 clouds (e.g., Offner et al. 2014; Glover & Clark 2016; Bisbas et al. 2017). Observations that support this scenario include large-scale maps of the CO isotopologs and [CI] lines of star-forming regions in the Small and Large Magellanic Clouds (Requena-Torres et al. 2016; Okada et al. 2019) and in the ρ Ophiuchi (Kulesa et al. 2005) and Orion giant molecular clouds. For the latter, the [CI](1-0) emission is measured to be optically thin (τ[CI] ∼ 0.1 − 0.3), and coincident with the emission of the 12CO line and 13CO(1-0) lines (Ikeda et al. 2002; Shimajiri et al. 2013). In nearby star-forming galaxies and starbursts, kiloparsec-scale observations suggest that [CI] may be as good a tracer of the cold H2 gas as CO, but it is not superior to CO (e.g., Israel et al. 2015; Crocker et al. 2019).
With the advent of the Atacama Large Millimeter/submillimeter Array (ALMA) and the boosted capabilities of NOrthern Extended Millimeter Array IRAM/NOEMA, the number of galaxies at high redshift observed in the [CI] lines is rapidly increasing (e.g., Bothwell et al. 2017; Harrington et al. 2021; Lee et al. 2021), and observations of the [CI] lines are no longer restricted to bright quasars or submillimeter galaxies (e.g., Weiß et al. 2003, 2005; Walter et al. 2011). In the first systematic study of the [CI] line emission of main-sequence galaxies and starbursts at z ≳ 1, Valentino et al. (2018, 2020b) reported that the [CI](1-0) transition is a good tracer of the molecular gas mass, similar to low-J CO lines and dust, and that the gas temperature traced by the [CI] lines does not strongly vary across galaxy types and redshift.
In combination with multiple CO transitions, the pair of [CI] lines can be used to constrain the physical properties of the molecular gas. Valentino et al. (2020a), based on large velocity gradient (LVG) modeling of the CO+[CI] spectral line energy distributions (SLEDs), found that to reproduce the observed SLEDs of z ∼ 1 main-sequence galaxies at least two molecular gas components are necessary: one that is relatively diffuse (nH2 ≈ 102 cm−3, Tkin ≈ 45 K), and another that is dense (nH2 ≈ 104 cm−3, Tkin ≈ 45 K). In a similar analysis of BX610, a massive main-sequence galaxy at z ≈ 2, Brisbin et al. (2019) also reported that two molecular gas components are an option, with the high-density component heated either by intense star formation or low-velocity C shocks. There is certainly much more work to be done to constrain the molecular gas properties of galaxies across cosmic time, and the combination of CO+[CI] SLEDs is one promising tool to achieve this goal.
In this Letter, we add to the limited number of studies of the molecular gas properties of main-sequence galaxies at high redshift based on observations of the pair of [CI] lines, CO(1-0) and some mid-J CO lines. The subject of our study is Q1700-MD94 (hereafter MD94), a massive (M⋆ = 1.5 × 10¹¹ M⊙) star-forming (SFR = 271 M⊙ yr−1) system at z = 2.333 (Tacconi et al. 2013) located at the massive end of the main sequence of galaxies at z ∼ 2 (e.g., Whitaker et al. 2012). MD94 is located at a declination of +64d 11m 24.2s and has previously been observed in CO(1-0) (Bolatto et al. 2015) and CO(3-2) line emission as part of the Plateau de Bure high-z Blue Sequence Survey (PHIBBS) (Tacconi et al. 2013).
2. Observations
We observed MD94 with NOEMA, wich is located in the French Alps. On August 31, 2017, we used the 2 mm band for a total of 7.5 hours to target the [CI](1-0) line, wich is located at an observed frequency of νobs = 147.8 GHz. Then, starting on September 1, 2017, we used the 1 mm band for a total of 14.3 hours to observe the [CI](2-1) and CO(7-6) lines, which are centered at an observed frequency of νobs = 243.0 GHz. All observations were carried out in NOEMA D-array configuration, which is the most compact configuration.
The data were calibrated in CLIC with help from the staff in Grenoble. After calibration, we used the software MAPPING21 to clean and image the data using natural weighting. For the [CI](1-0), cube the resulting synthesized beam was 3.0″×2.2″ (∼24.9 × 18.2 kpc) and the noise level was 0.25 m Jy beam−1 in 100 km s−1. For the [CI](2-1) and CO(7-6), cube the resulting beam was 1.7″×1.3″ (∼14.1 × 10.7 kpc) and the noise level was 0.31 m Jy beam−1 in 75 km s−1. In the latter cube, we detected continuum emission, which was subtracted from the spectra before any line analysis was made.
3. Results
3.1. Detection of the [CI](1-0), [CI](2-1), and CO(7-6) transitions and the dust continuum
The spectra of the [CI](1-0), [CI](2-1), and CO(7-6) lines observed in MD94 are shown in the top panel of Fig. 1. The continuum emission detected below the [CI](2-1) and CO(7-6) lines was determined and subtracted based on the emission from the frequency channels below and above the CO(7-6) and [CI](2-1) lines, respectively. The continuum flux measured at (rest frame) 240 GHz is 2.5 ± 0.8 mJy. The [CI](1-0), [CI](2-1) and CO(7-6) lines are detected with signal-to-noise ratios of S/N ≈ 4, 6, and 10, respectively. We fit a single-Gaussian profile to each line. The measured line widths (full width at half maximum, FWHM) and integrated fluxes are listed in Table 1. The redshift of the source derived from the central frequency of the Gaussian fit is similar to the value of z = 2.33 measured from observations of the Hα and CO(3-2) lines by Tacconi et al. (2013).
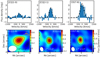 |
Fig. 1. Top: From left to right, [CI](1-0), [CI](2-1), and CO(7-6) spectra of MD94. The dashed black lines show the single-Gaussian fit to the spectra. The FWHM and integrated fluxes are listed in Table 1. Bottom: From left to right, integrated intensity maps of the [CI](1-0), [CI](2-1), and CO(7-6) emission of MD94. Contours start at 2σ and increase in steps of 1σ. The NOEMA-synthesized beam is shown in the lower left corner. |
Q1700-MD94 derived values.
The bottom panels of Fig. 1 show the integrated intensity maps. We (barely) spatially resolve MD94 in the [CI](2-1) and CO(7-6) line emission. Similar to the spatial distribution observed in the CO(1-0) line emission by Bolatto et al. (2015), the source is elongated in the N-S direction. The deconvolved sizes are 1.4″×0.7″ and 1.2″×0.61″ for the [CI](2-1) and CO(7-6) lines, respectively. These sizes are comparable to the deconvolved source size of 1.3″×1.0″ measured from the CO(1-0) line emission (Bolatto et al. 2015).
We calculated the luminosities of the [CI] and CO lines following Solomon & Vanden Bout (2005). For the luminosity distance and other physical parameters, we used a standard cosmology (H0 = 67.4 km s−1 Mpc−1, ΩM = 0.315, ΩΛ = 0.685 Planck Collaboration VI 2020).
3.2. The molecular gas mass of MD94
The molecular gas mass of MD94 can be measured from available observations of the CO(1-0) line (Bolatto et al. 2015), the dust continuum, and the pair of [CI] lines (this work). In all cases, it is necessary to make assumptions about the abundance of the tracer to convert the luminosity into a molecular gas mass.
According to the mass-metallicity relation and parameterization in Genzel et al. (2015), MD94 has a metallicity of 12 + log(O/H) = 8.64, which is roughly the solar value (Asplund et al. 2004). Following Tacconi et al. (2018), for the metallicity of MD94, the CO(1-0) metallicity-dependent conversion factor is αCO = 4.5 M⊙ (K km s−1 pc2)−1 (this includes the 1.36 helium correction factor). Based on this and the CO(1-0) luminosity in Bolatto et al. (2015), the molecular gas mass in MD94 is Mmol = 1.7 × 10¹¹ M⊙.
Alternatively, the interstellar medium (ISM) gas mass can be estimated from the single dust continuum measurement at (rest frame) 240 GHz (see Table 1). Following Eq. (15) in Scoville et al. (2016), we measure a gas mass in MD94 of MISM ≈ 7 × 10¹⁰ M⊙2. This total gas mass is within factor of ∼2 of the CO-based molecular gas mass, which is expected given the multiple assumptions both methods require.
Finally, the atomic carbon mass based on the [CI](1-0) line can be calculated following, for instance Weiß et al. (2005):
![$$ \begin{aligned} M_{\rm [CI]} = 5.706 \times 10^{-4} Q( T_{\rm ex})\frac{1}{3} \mathrm{e}^{\frac{23.6}{T_{\rm ex}}} L^{{\prime }}_{\rm [CI](1-0)}\,M_{\odot }, \end{aligned} $$](/articles/aa/full_html/2022/01/aa41870-21/aa41870-21-eq1.gif)
where Tex is the excitation temperature and Q(Tex)=1 + 3e−T1/Tex + 5e−T2/Tex is the partition function. Here T1 = 23.6 K and T2 = 62.5 K are the energies above ground state.
The advantage of having detected the pair of [CI] lines in MD94 is that we can use their brightness ratio to directly measure the excitation temperature Tex in the optically thin limit. In MD94 we measure a [CI] line ratio of }}/L^\prime_{\mathrm{[CI](1-0)}}=0.7 $](/articles/aa/full_html/2022/01/aa41870-21/aa41870-21-eq2.gif) . Following Stutzki et al. (1997), the excitation temperature in MD94 is
. Following Stutzki et al. (1997), the excitation temperature in MD94 is
This value is close to the average [CI] excitation temperature of Tex ≈ 30 K measured in the sample of dusty starbursts and quasi-stellar objects in Walter et al. (2011), and about ∼10 K warmer than the average excitation temperature measured in main-sequence galaxies at z ∼ 1 (Valentino et al. 2020b). In the absence of one of the two [CI] lines, it is a common approach to assume the dust temperature as a proxy for the excitation temperature. In the case of MD94, the [CI]-based Tex is comparable to the typical dust temperature of Tdust ≈ 32 K measured in massive (M⋆ ≈ 1011 − 1011.5 M⊙), main-sequence star-forming galaxies at z ≈ 2 (Magnelli et al. 2014; Genzel et al. 2015; Schreiber et al. 2018).
From Eq. (1) and the excitation temperature in Eq. (2), the resulting atomic carbon mass in MD94 is M[CI] = 9.2 × 10⁶ M⊙. To convert this quantity into a molecular gas mass, we need to assume an atomic carbon abundance relative to H2, that is, XCI = MCI/6MH2. A wide range of XCI values has been indirectly measured or assumed for different galaxy types and cosmic epochs. Valentino et al. (2018), using a homogenized method to compare the molecular gas masses derived from archival dust, low-J CO, and [CI](1-0) line observations, reported that XCI varies from ∼1 − 3 × 10⁻⁵ in z ∼ 1 main-sequence galaxies, ∼3 − 8 × 10⁻⁵ in SMGs at z ∼ 2, and ∼3 − 10 × 10−5 in nearby galaxies (we note that the MH2 values in Valentino et al. 2018 do not include the helium contribution). When we compare the atomic carbon mass to the average molecular gas mass from the CO(1-0) line and dust continuum estimates, we find XCI, MD94 ≈ 1.3 × 10⁻⁵ for MD94. This value is within the range of abundances derived by Valentino et al. (2018) and is comparable to the typically assumed abundance for massive, high-redshift systems of XCI ≈ 3 × 10⁻⁵ (e.g., Weiß et al. 2005; Alaghband-Zadeh et al. 2013; Popping et al. 2017). In summary, for reasonable assumptions for αCO, dust-to-gas ratio, and XCI for a massive galaxy with near solar metallicity such as MD94, we find that the molecular gas mass measurements based on the CO(1-0), dust continuum, and [CI](1-0) transitions are comparable (e.g., within a factor of ∼2).
Finally, the molecular gas mass in MD94 implies that this galaxy has a molecular gas fraction of μ = Mmol/M⋆ ≈ 1 and a molecular gas depletion timescale of tdep = Mmol/SFR ≈ 0.5 Gyr. Both quantities are characteristic of massive, main-sequence galaxies at z ∼ 2 (Tacconi et al. 2018).
3.3. [CI] and CO spectral line energy distributions
The analysis of the SLED of the pair of [CI] and CO lines can provide valuable insights into the physical conditions of the molecular gas. Figure 2 shows the CO and [CI] SLEDs of MD94 compared to other nearby and high-redshift galaxies. Based on the strong link observed between the shape of the SLED and the SFR surface density ΣSFR[e.g.,][]narayanan2014, we include galaxies that have ΣSFR values that range from ∼1× (e.g., BX610, mean BzK z ∼ 1.5 galaxies) to ∼150× (e.g., Cloverleaf quasar) that of MD94 (ΣSFR ≈ 2 M⊙ yr−1 kpc−2; Tacconi et al. 2013).
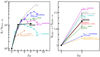 |
Fig. 2. CO (left) and [CI] (right) SLEDs of MD94 (black) and other nearby and high-redshift systems. We indicate (when available) the SFR surface density in terms of the value measured in MD94 (ΣSFR ≈ 2 M⊙ yr−1 kpc−2). The references for the ancillary data shown are the following: Mrk 231 (van der Werf et al. 2010), M82 (Kamenetzky et al. 2012), and Cloverleaf (Barvainis et al. 1997). In addition to these, we added BX610 (Brisbin et al. 2019; Aravena et al. 2014), average values for (U)LIRGs and starbursts (Israel et al. 2015), and the mean value for main-sequence galaxies at z ∼ 1 (Valentino et al. 2020b), and BzK main-sequence galaxies at z ∼ 1.5 (Daddi et al. 2015). The dashed dark gray line shows constant brightness temperature on the Rayleigh–Jeans scale (S ∝ ν2). |
The integrated flux (SCOΔv) ratio between the J = 3 − 2 and J = 1 − 0 in MD94 is ∼10 (Bolatto et al. 2015), which is consistent with its high levels of star formation activity, similar to the examples of M82 (in the figure) and NGC253 (Bradford et al. 2003). It is also consistent with the high integrated line ratios observed in AGN galaxies, such as Mrk 231 and the Cloverleaf quasar (in the figure). It is important to note that based on the observed broad Hα line profile (Erb et al. 2006), MD94 could host an AGN that might be accompanied by an outflow.
The inclusion of the CO(7-6) line is key to further differentiate the gas excitation conditions in MD94 from that of other systems, and also to search for an additional denser and/or warmer component of molecular gas present. In this sense, the (partially complete) SLED of MD94 from J = 1 to J = 7 better resembles the shape of the SLED of nearby AGN galaxy Mrk 231 (ΣSFR ∼ 30 × ΣSFR, MD94) than that of the nearby starburst M82 (ΣSFR ∼ 10 × ΣSFR, MD94), which peaks at J = 4 and then declines. It is also similar to the SLED of BX610, another massive main-sequence galaxy at z ≈ 2 with a comparable value of ΣSFR that shows no or weak signs of AGN activity (Aravena et al. 2014; Bolatto et al. 2015; Brisbin et al. 2019). For the latter, LVG models suggest that at least a second higher-density PDR component or a low-velocity C shock-heated component is needed to better reproduce the CO+[CI] SLED (Brisbin et al. 2019).
The right panel of Fig. 2 shows the [CI] SLED of MD94. We also include most of the systems in the left panel, plus the average [CI] SLED observed in main-sequence galaxies at z ∼ 1 (Valentino et al. 2018) and nearby starbursts and (U)LIRGs (Israel et al. 2015). MD94 has a [CI](2-1)/[CI](1-0) integrated flux ratio of ≈1.9, similar to the typical value found in nearby starbursts (Israel et al. 2015), and slightly higher than that of BX610 (Brisbin et al. 2019). The fact that MD94 shows a [CI] SLED that is more excited than, for instance, the Cloverleaf quasar (ΣSFR ∼ 150 × ΣSFR, MD94) reveals the complexity of the molecular gas in these systems in terms of excitation properties and structure. It also suggests that the molecular gas component dominating the mid- and high-J CO emission is different from that powering the [CI] line emission. We further investigate the shape of the CO+[CI] SLEDs in the next section.
3.4. Large velocity gradient modeling
To study the physical conditions of the gas that produce the CO and [CI] line emission in MD94 in more detail, we used a set of LVG models generated by the one-dimensional non-LTE radiative transfer code RADEX (van der Tak et al. 2007). RADEX models mainly depend on three input parameters: the gas kinetic temperature (TK), the molecular hydrogen density (nH2), and the CO (or C) column density per unit velocity gradient (N(CO)/dV or N(C)/dV). To model the CO+[CI] SLED of MD94, we generated a grid of models varying the H2 density from nH2 = 102 to 105 cm−3 and the kinetic temperature from Tkin = 10 to 200 K. Following the LVG modeling of Israel et al. (2015), and to avoid overfitting the limited CO SLED of MD94, we fixed the CO gradient to N(CO)/dV = 1017 cm−2 (km s−1)−1, but we note that varying N(CO)/dV in the range 1017 − 1018 (km s−1)−1 only changes the results by less than 20%. We also assumed an abundance ratio of C:CO of 1:4, consistent with abundance ratios found in nearby star-forming galaxies (Crocker et al. 2019) and the z ∼ 2 main-sequence galaxy BX610 (Brisbin et al. 2019). The background temperature was set to 2.73 × (1 + 2.33)=9 K.
We simultaneously compared the CO and [CI] SLEDs of MD94 with the set of RADEX models, calculating the goodness of the fit based on the reduced-χ2 value. We find that the model that best reproduces the data has (reduced-χ2 ≈ 3) a gas density of nH2 = 8.5 × 103 cm−3 and a temperature of Tkin = 41 K. Figure 3 shows this best-fit single-component model (dot-dashed blue line) overplotted on the CO+[CI] SLED of MD94. The model peaks between J = 4 − 6, which means that future observations of the CO(4-3) or CO(5-4) transitions with NOEMA/Band 2, or CO(6-5) with NOEMA/Band 3, can be particularly helpful to better constrain the CO SLED model.
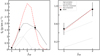 |
Fig. 3. Large velocity gradient RADEX modeling of the CO (left) and [CI] (right) SLEDs. The red line shows the best RADEX single-component model (T = 41 K, nH2 = 8.5 × 103 cm−3). The gray line shows the best two-component model, which is the combination of low- (T = 34 K, nH2 = 3.1 × 103 cm−3; green) and high-excitation (T = 137 K, nH2 = 1.6 × 104 cm−3; red) components. |
In nearby galaxies and high redshift systems, it is not uncommon that a two-component model, consisting of the combination of low-excitation (or cold) and high-excitation (or warm) gas, is needed to fully reproduce the observed SLEDs (e.g., Mashian et al. 2015; Daddi et al. 2015; Cañameras et al. 2018; Valentino et al. 2020a; Harrington et al. 2021). In the case of MD94, we are limited by the number of observed line transitions (only five) therefore so a proper fit based on a two-component model is beyond our reach. However, if for instructive purposes we fit the CO+[CI] SLED with a two-component model, we find that the best model consists of a low-excitation component with Tkin = 34 K, nH2 = 3.1 × 103 cm−3 and a high-excitation component with Tkin = 137 K, nH2 = 1.6 × 104 cm−3. This two-component model is shown in Fig. 3 as a combination of solid, dotted, and dashed gray lines.
3.5. Comparison of the physical properties of the molecular gas of MD94 to other galaxies at z ∼ 1−2
There are two other main-sequence galaxies at z ≈ 2 with a similar stellar mass as MD94 (∼1011 M⊙) that have been studied based on the combination of the [CI] and CO lines and the dust continuum. These galaxies are BX610 (Tacconi et al. 2013; Bolatto et al. 2015; Brisbin et al. 2019) and GS30274 (Popping et al. 2017; Talia et al. 2018). While the first shares the average molecular gas properties of main-sequence galaxies at z ∼ 2 (Tacconi et al. 2018), the second shows a very short depletion time (tdep ≈ 100 Myr), compact structure (Re ≈ 2 kpc), a powerful AGN-driven outflow (e.g., Förster Schreiber et al. 2014; Genzel et al. 2014; Davies et al. 2020), and is considered to be in the process of quenching (Popping et al. 2017).
Massive main-sequence galaxies at z ∼ 2 are expected to experience star formation quenching as the fraction of quiescent galaxies with stellar masses similar to MD94 increases from ∼20% at z ∼ 2 − 3 to ∼70% at z ∼ 1 (e.g., Muzzin et al. 2013). From the standpoint of the global molecular gas fraction and depletion timescale, MD94 is closer to BX610 than GS30274, and it does not show evident signatures for quenching of its star formation activity. This might be a result of the poor spatial resolution of our observations that washes out any evidence of quenching mechanisms operating in the central region around the AGN. The only similarity we find between MD94 and the quenching galaxy GS30274 is that the LVG modeling of MD94 suggests the presence of dense (∼8 × 103 cm−3) gas similar to that observed in GS30274. As Fig. 4 shows, the gas temperature and density in MD94 is comparable to the high-excitation gas component in main-sequence galaxies at z ∼ 1 (Valentino et al. 2020a), and as dense as the molecular gas detected in highly lensed starbursts at z ∼ 2 (Yang et al. 2017; Cañameras et al. 2018). For MD94, this could be the result of highly excited gas in the central region as a result, for example, of a compaction event. However, the fact that the deconvolved sizes of MD94 in the CO(1-0) and CO(7-6) line emission are comparable suggests that the dense gas excited by intense star formation activity is well mixed with cold and diffuse molecular gas throughout the disk. Only high spatial resolution observations of the molecular gas in multiple transitions, which can be achieved, for example, by the upgraded NOEMA capabilities (e.g., baseline extension), could provide an answer in the near future.
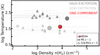 |
Fig. 4. Kinetic temperature and molecular gas density from the best RADEX LVG one-component (red circle) and two-component model (dark gray and light gray circles) fitted to the CO and [CI] SLEDs of MD94. We also show the derived values for lensed ULIRGs at z ∼ 2 − 3 (Yang et al. 2017; Cañameras et al. 2018) (triangles) and the average value for main-sequence galaxies at z ∼ 1 (Valentino et al. 2020a) (squares). |
4. Conclusions
We present new NOEMA observations of the [CI](1-0), [CI](2-1) and CO(7-6) transitions of the massive main-sequence galaxy Q1700-MD94 at z ≈ 2.3. Combined with ancillary observations of the CO(1-0) (Bolatto et al. 2015) and the CO(3-2) (Tacconi et al. 2013) lines, we have characterized the molecular gas properties of MD94. We highlight the following points:
-
We find that for a reasonable set of assumptions for a massive galaxy such as MD94, the molecular gas mass estimates from the dust continuum, the CO(1-0), and the [CI](1-0) line are consistent within a factor of ∼2. At least for this system, our analysis shows that the [CI](1-0) transition is a reliable alternative to the CO(1-0) line to study the molecular gas properties of the low-excitation gas.
-
The CO SLED of MD94 shows excitation properties similar to those of BX610, another massive galaxy at z ≈ 2 with a comparable SFR surface density (ΣSFR ≈ 2 M⊙ yr−1 kpc−2). Compared to nearby systems, the CO SLED shape is closer to that of Mrk231 (ΣSFR ≈ 30 × ΣSFR, MD94) than M82 (ΣSFR ≈ 10 × ΣSFR, MD94), perhaps because MD94 also hosts an AGN. The [CI] SLED of MD94 is also comparable to that of BX610 and the mean [CI] SLED of nearby starburst galaxies (Israel et al. 2015).
-
Based on LVG models from RADEX, we simultaneously fit the CO and [CI] SLEDs of MD94. The model that best reproduced the data has a gas density of nH2 = 8.5 × 103 cm−3 and a temperature of Tkin = 41 K. These gas properties are similar to those observed in the high-excitation, dense molecular gas in main-sequence galaxies at z ∼ 1 (Valentino et al. 2020a).
-
MD94 exhibits molecular gas properties (e.g., fgas ≈ 1, tdep ≈ 0.5 Gyr) similar to those observed in main-sequence star-forming galaxies at z ∼ 2 (e.g., Tacconi et al. 2018). The fact that the deconvolved sizes of the disk in the CO(7-6) and CO(1-0) line emission are comparable suggests that the star formation activity that heat the gas is widely distributed, and is not concentrated in a compact central region. Future observations that can spatially resolve the molecular gas properties of MD94 are needed to further confirm this scenario.
CLIC and MAPPING2 are part of the GILDAS package (Guilloteau & Lucas 2000). http://www.iram.fr/IRAMFR/GILDAS
This calculation assumes a dust-to-gas ratio appropriate for massive, star-forming galaxies, and includes a Rayleigh–Jeans correction calculated for a dust temperature of T = 35 K. This temperature is consistent with the gas temperature derived from the ratio of the [CI] lines in MD94, and also the typical dust temperature measured in massive, main-sequence galaxies at z ≈ 2 (e.g., Magnelli et al. 2014; Genzel et al. 2015; Schreiber et al. 2018).
Acknowledgments
We thank the referee for very useful comments and suggestions that improved the manuscript. K. H. B. and R. H.-C. thank the Max Planck Society for support under the Partner Group project “The Baryon Cycle in Galaxies” between the Max Planck for Extraterrestrial Physics and the Universidad de Concepción. K. H. B. and R. H.-C. also would like to thank C. Lefèvre, C. Herrera and the rest of the IRAM staff for their help with the data calibration. This work is based on observations carried out under project number W17DL with the IRAM NOEMA Interferometer. IRAM is supported by INSU/CNRS (France), MPG (Germany) and IGN (Spain). R. H.-C. and R. D. gratefully acknowledge support from the Chilean Centro de Excelencia en Astrofísica y Tecnologías Afines (CATA) BASAL grant AFB-170002. S. B. and R. H-C acknowledge financial support from Millenium Nucleus NCN19058 (TITANs). M. R. acknowledges support from ANID (Chile) Fondecyt grant No 1190684.
References
- Alaghband-Zadeh, S., Chapman, S. C., Swinbank, A. M., et al. 2013, MNRAS, 435, 1493 [Google Scholar]
- Aravena, M., Hodge, J. A., Wagg, J., et al. 2014, MNRAS, 442, 558 [Google Scholar]
- Asplund, M., Grevesse, N., Sauval, A. J., Allende Prieto, C., & Kiselman, D. 2004, A&A, 417, 751 [NASA ADS] [CrossRef] [EDP Sciences] [Google Scholar]
- Barvainis, R., Maloney, P., Antonucci, R., & Alloin, D. 1997, ApJ, 484, 695 [NASA ADS] [CrossRef] [Google Scholar]
- Bisbas, T. G., van Dishoeck, E. F., Papadopoulos, P. P., et al. 2017, ApJ, 839, 90 [Google Scholar]
- Bolatto, A. D., Wolfire, M., & Leroy, A. K. 2013, ARA&A, 51, 207 [CrossRef] [Google Scholar]
- Bolatto, A. D., Warren, S. R., Leroy, A. K., et al. 2015, ApJ, 809, 175 [NASA ADS] [CrossRef] [Google Scholar]
- Bothwell, M. S., Aguirre, J. E., Aravena, M., et al. 2017, MNRAS, 466, 2825 [Google Scholar]
- Bradford, C. M., Nikola, T., Stacey, G. J., et al. 2003, ApJ, 586, 891 [NASA ADS] [CrossRef] [Google Scholar]
- Brisbin, D., Aravena, M., Daddi, E., et al. 2019, A&A, 628, A104 [EDP Sciences] [Google Scholar]
- Cañameras, R., Yang, C., Nesvadba, N. P. H., et al. 2018, A&A, 620, A61 [Google Scholar]
- Carilli, C. L., & Walter, F. 2013, ARA&A, 51, 105 [NASA ADS] [CrossRef] [Google Scholar]
- Crocker, A. F., Pellegrini, E., Smith, J. D. T., et al. 2019, ApJ, 887, 105 [NASA ADS] [CrossRef] [Google Scholar]
- Daddi, E., Dannerbauer, H., Liu, D., et al. 2015, A&A, 577, A46 [NASA ADS] [CrossRef] [EDP Sciences] [Google Scholar]
- Davies, R. L., Förster Schreiber, N. M., Lutz, D., et al. 2020, ApJ, 894, 28 [NASA ADS] [CrossRef] [Google Scholar]
- Erb, D. K., Steidel, C. C., Shapley, A. E., et al. 2006, ApJ, 647, 128 [NASA ADS] [CrossRef] [Google Scholar]
- Förster Schreiber, N. M., Genzel, R., Newman, S. F., et al. 2014, ApJ, 787, 38 [Google Scholar]
- Genzel, R., Förster Schreiber, N. M., Lang, P., et al. 2014, ApJ, 785, 75 [NASA ADS] [CrossRef] [Google Scholar]
- Genzel, R., Tacconi, L. J., Lutz, D., et al. 2015, ApJ, 800, 20 [Google Scholar]
- Glover, S. C. O., & Clark, P. C. 2016, MNRAS, 456, 3596 [Google Scholar]
- Guilloteau, S., & Lucas, R. 2000, in Imaging at Radio through Submillimeter Wavelengths, eds. J. G. Mangum, & S. J. E. Radford, ASP Conf. Ser., 217, 299 [Google Scholar]
- Harrington, K. C., Weiss, A., Yun, M. S., et al. 2021, ApJ, 908, 95 [NASA ADS] [CrossRef] [Google Scholar]
- Hollenbach, D. J., & Tielens, A. G. G. M. 1999, Rev. Mod. Phys., 71, 173 [Google Scholar]
- Ikeda, M., Oka, T., Tatematsu, K., Sekimoto, Y., & Yamamoto, S. 2002, ApJS, 139, 467 [NASA ADS] [CrossRef] [Google Scholar]
- Israel, F. P., Rosenberg, M. J. F., & van der Werf, P. 2015, A&A, 578, A95 [NASA ADS] [CrossRef] [EDP Sciences] [Google Scholar]
- Kamenetzky, J., Glenn, J., Rangwala, N., et al. 2012, ApJ, 753, 70 [Google Scholar]
- Kennicutt, R. C., & Evans, N. J. 2012, ARA&A, 50, 531 [NASA ADS] [CrossRef] [Google Scholar]
- Kulesa, C. A., Hungerford, A. L., Walker, C. K., Zhang, X., & Lane, A. P. 2005, ApJ, 625, 194 [NASA ADS] [CrossRef] [Google Scholar]
- Lee, M. M., Tanaka, I., Iono, D., et al. 2021, ApJ, 909, 181 [NASA ADS] [CrossRef] [Google Scholar]
- Magnelli, B., Lutz, D., Saintonge, A., et al. 2014, A&A, 561, A86 [NASA ADS] [CrossRef] [EDP Sciences] [Google Scholar]
- Mashian, N., Sturm, E., Sternberg, A., et al. 2015, ApJ, 802, 81 [Google Scholar]
- Muzzin, A., Marchesini, D., Stefanon, M., et al. 2013, ApJ, 777, 18 [NASA ADS] [CrossRef] [Google Scholar]
- Narayanan, D., & Krumholz, M. R. 2014, MNRAS, 442, 1411 [NASA ADS] [CrossRef] [Google Scholar]
- Offner, S. S. R., Bisbas, T. G., Bell, T. A., & Viti, S. 2014, MNRAS, 440, L81 [NASA ADS] [CrossRef] [Google Scholar]
- Okada, Y., Güsten, R., Requena-Torres, M. A., et al. 2019, A&A, 621, A62 [NASA ADS] [CrossRef] [EDP Sciences] [Google Scholar]
- Planck Collaboration VI. 2020, A&A, 641, A6 [NASA ADS] [CrossRef] [EDP Sciences] [Google Scholar]
- Popping, G., Decarli, R., Man, A. W. S., et al. 2017, A&A, 602, A11 [NASA ADS] [CrossRef] [EDP Sciences] [Google Scholar]
- Requena-Torres, M. A., Israel, F. P., Okada, Y., et al. 2016, A&A, 589, A28 [NASA ADS] [CrossRef] [EDP Sciences] [Google Scholar]
- Schreiber, C., Elbaz, D., Pannella, M., et al. 2018, A&A, 609, A30 [NASA ADS] [CrossRef] [EDP Sciences] [Google Scholar]
- Scoville, N., Sheth, K., Aussel, H., et al. 2016, ApJ, 824, 63 [CrossRef] [Google Scholar]
- Shimajiri, Y., Sakai, T., Tsukagoshi, T., et al. 2013, ApJ, 774, L20 [NASA ADS] [CrossRef] [Google Scholar]
- Solomon, P. M., & Vanden Bout, P. A. 2005, ARA&A, 43, 677 [NASA ADS] [CrossRef] [Google Scholar]
- Stutzki, J., Graf, U. U., Haas, S., et al. 1997, ApJ, 477, L33 [NASA ADS] [CrossRef] [Google Scholar]
- Tacconi, L. J., Neri, R., Genzel, R., et al. 2013, ApJ, 768, 74 [NASA ADS] [CrossRef] [Google Scholar]
- Tacconi, L. J., Genzel, R., Saintonge, A., et al. 2018, ApJ, 853, 179 [Google Scholar]
- Tacconi, L. J., Genzel, R., & Sternberg, A. 2020, ARA&A, 58, 157 [NASA ADS] [CrossRef] [Google Scholar]
- Talia, M., Pozzi, F., Vallini, L., et al. 2018, MNRAS, 476, 3956 [NASA ADS] [CrossRef] [Google Scholar]
- Valentino, F., Magdis, G. E., Daddi, E., et al. 2018, ApJ, 869, 27 [Google Scholar]
- Valentino, F., Magdis, G. E., Daddi, E., et al. 2020a, ApJ, 890, 24 [Google Scholar]
- Valentino, F., Daddi, E., Puglisi, A., et al. 2020b, A&A, 641, A155 [NASA ADS] [CrossRef] [EDP Sciences] [Google Scholar]
- van der Tak, F. F. S., Black, J. H., Schöier, F. L., Jansen, D. J., & van Dishoeck, E. F. 2007, A&A, 468, 627 [NASA ADS] [CrossRef] [EDP Sciences] [Google Scholar]
- van der Werf, P. P., Isaak, K. G., Meijerink, R., et al. 2010, A&A, 518, L42 [NASA ADS] [CrossRef] [EDP Sciences] [Google Scholar]
- Walter, F., Weiß, A., Downes, D., Decarli, R., & Henkel, C. 2011, ApJ, 730, 18 [Google Scholar]
- Weiß, A., Henkel, C., Downes, D., & Walter, F. 2003, A&A, 409, L41 [NASA ADS] [CrossRef] [EDP Sciences] [Google Scholar]
- Weiß, A., Downes, D., Henkel, C., & Walter, F. 2005, A&A, 429, L25 [NASA ADS] [CrossRef] [EDP Sciences] [Google Scholar]
- Whitaker, K. E., van Dokkum, P. G., Brammer, G., & Franx, M. 2012, ApJ, 754, L29 [Google Scholar]
- Yang, C., Omont, A., Beelen, A., et al. 2017, A&A, 608, A144 [NASA ADS] [CrossRef] [EDP Sciences] [Google Scholar]
All Tables
All Figures
|
Fig. 1. Top: From left to right, [CI](1-0), [CI](2-1), and CO(7-6) spectra of MD94. The dashed black lines show the single-Gaussian fit to the spectra. The FWHM and integrated fluxes are listed in Table 1. Bottom: From left to right, integrated intensity maps of the [CI](1-0), [CI](2-1), and CO(7-6) emission of MD94. Contours start at 2σ and increase in steps of 1σ. The NOEMA-synthesized beam is shown in the lower left corner. |
| In the text | |
|
Fig. 2. CO (left) and [CI] (right) SLEDs of MD94 (black) and other nearby and high-redshift systems. We indicate (when available) the SFR surface density in terms of the value measured in MD94 (ΣSFR ≈ 2 M⊙ yr−1 kpc−2). The references for the ancillary data shown are the following: Mrk 231 (van der Werf et al. 2010), M82 (Kamenetzky et al. 2012), and Cloverleaf (Barvainis et al. 1997). In addition to these, we added BX610 (Brisbin et al. 2019; Aravena et al. 2014), average values for (U)LIRGs and starbursts (Israel et al. 2015), and the mean value for main-sequence galaxies at z ∼ 1 (Valentino et al. 2020b), and BzK main-sequence galaxies at z ∼ 1.5 (Daddi et al. 2015). The dashed dark gray line shows constant brightness temperature on the Rayleigh–Jeans scale (S ∝ ν2). |
| In the text | |
|
Fig. 3. Large velocity gradient RADEX modeling of the CO (left) and [CI] (right) SLEDs. The red line shows the best RADEX single-component model (T = 41 K, nH2 = 8.5 × 103 cm−3). The gray line shows the best two-component model, which is the combination of low- (T = 34 K, nH2 = 3.1 × 103 cm−3; green) and high-excitation (T = 137 K, nH2 = 1.6 × 104 cm−3; red) components. |
| In the text | |
|
Fig. 4. Kinetic temperature and molecular gas density from the best RADEX LVG one-component (red circle) and two-component model (dark gray and light gray circles) fitted to the CO and [CI] SLEDs of MD94. We also show the derived values for lensed ULIRGs at z ∼ 2 − 3 (Yang et al. 2017; Cañameras et al. 2018) (triangles) and the average value for main-sequence galaxies at z ∼ 1 (Valentino et al. 2020a) (squares). |
| In the text | |
Current usage metrics show cumulative count of Article Views (full-text article views including HTML views, PDF and ePub downloads, according to the available data) and Abstracts Views on Vision4Press platform.
Data correspond to usage on the plateform after 2015. The current usage metrics is available 48-96 hours after online publication and is updated daily on week days.
Initial download of the metrics may take a while.