Fig. 1.
Download original image
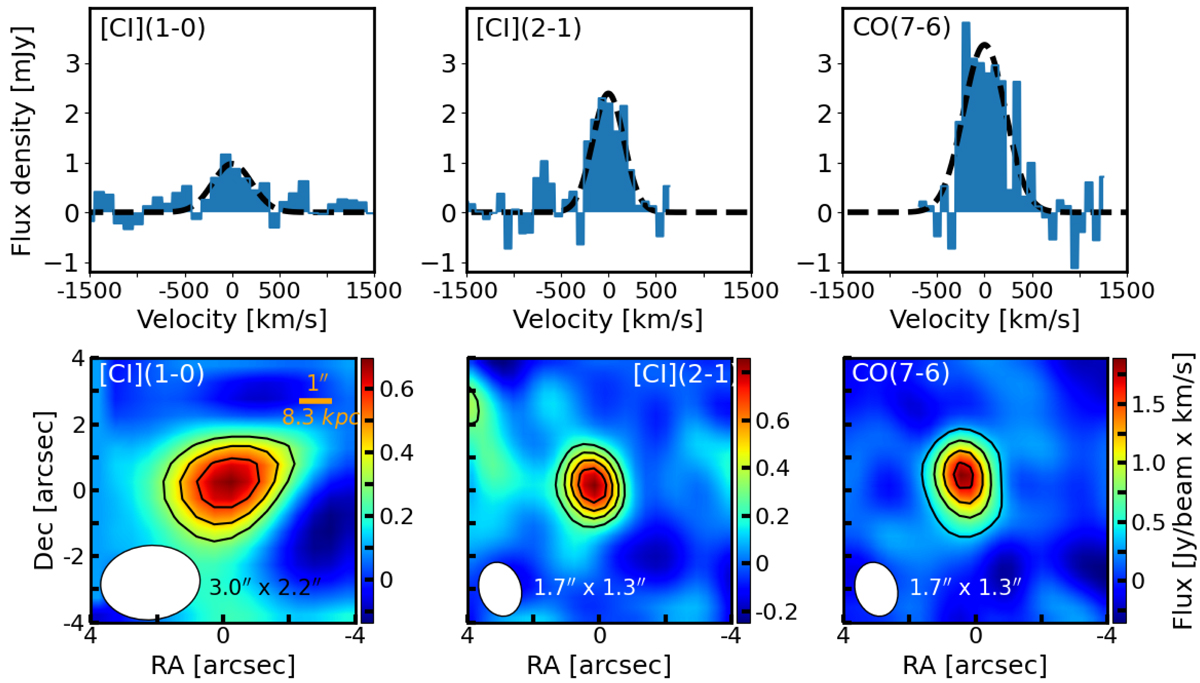
Top: From left to right, [CI](1-0), [CI](2-1), and CO(7-6) spectra of MD94. The dashed black lines show the single-Gaussian fit to the spectra. The FWHM and integrated fluxes are listed in Table 1. Bottom: From left to right, integrated intensity maps of the [CI](1-0), [CI](2-1), and CO(7-6) emission of MD94. Contours start at 2σ and increase in steps of 1σ. The NOEMA-synthesized beam is shown in the lower left corner.
Current usage metrics show cumulative count of Article Views (full-text article views including HTML views, PDF and ePub downloads, according to the available data) and Abstracts Views on Vision4Press platform.
Data correspond to usage on the plateform after 2015. The current usage metrics is available 48-96 hours after online publication and is updated daily on week days.
Initial download of the metrics may take a while.