| Issue |
A&A
Volume 656, December 2021
|
|
|---|---|---|
| Article Number | A127 | |
| Number of page(s) | 12 | |
| Section | Extragalactic astronomy | |
| DOI | https://doi.org/10.1051/0004-6361/202141856 | |
| Published online | 10 December 2021 | |
Can nebular He II emission be explained by ultra-luminous X-ray sources?
1
Observatoire de Genève, Département d’Astronomie, Université de Genève, 51 Chemin Pegasi, 1290 Versoix, Switzerland
e-mail: This email address is being protected from spambots. You need JavaScript enabled to view it.
2
CNRS, IRAP, 14 Avenue E. Belin, 31400 Toulouse, France
3
Univ. Lyon, Univ. Lyon1, Ens de Lyon, CNRS, Centre de Recherche Astrophysique de Lyon UMR5574, 69230 Saint-Genis-Laval, France
Received:
23
July
2021
Accepted:
13
September
2021
Abstract
Context. The shape of the ionising spectra of galaxies is a key ingredient to reveal their physical properties and for our understanding of the ionising background radiation. A long-standing unsolved problem is the presence of He II nebular emission in many low-metallicity star-forming galaxies. This emission requires ionising photons with an energy > 54 eV; it is important to note that these particular photons are not produced in sufficient amounts by normal stellar populations.
Aims. To examine if high mass X-ray binaries and ultra-luminous X-ray sources (HMXBs and ULXs) can explain the observed He II nebular emission and how their presence alters other emission lines, we computed photoionisation models of galaxies including such sources.
Methods. We combined spectral energy distributions (SEDs) of integrated stellar populations with constrained SEDs of ULXs to obtain composite spectra with varying amounts of X-ray luminosity, parameterised by LX/SFR. With these, we computed photoionisation models to predict the emission line fluxes of the optical recombination lines of H and He+, as well as the main metal lines of [O III], [O II], [O I], and [N II]. The predictions were then compared to a large sample of low-metallicity galaxies.
Results. We find that it is possible to reproduce the nebular He II λ4686 and other line observations with our spectra and with amounts of LX/SFR compatible with the observations. Our work suggests that HMBXs and ULXs could be responsible for the observed nebular He II emission. However, the strengths of the high and low ionisation lines, such as He II and [O I] λ6300, strongly depend on the X-ray contribution and on the assumed SEDs of the high energy source(s), the latter being poorly known.
Key words: galaxies: ISM / galaxies: high-redshift / X-rays: binaries / radiation mechanisms: general
© ESO 2021
1. Introduction
The presence of strong emission lines and the detection of intense UV metal lines in numerous high-redshift galaxies, and more generally the quest for the sources of cosmic reionisation, has re-triggered a strong interest in the physical properties of distant galaxies and their radiation field (see e.g. the review of Stark 2016). In particular, prominent high ionisation spectral features, such as nebular emission in C IV λ1550, He II λ1640, as well as intense C III] λ1909 emission, have for example been detected in several z > 6 galaxies, thus raising questions about the origin of their hard ionising spectra (Stark et al. 2015; Schmidt et al. 2017). Indeed, galaxies showing these UV emission lines are relatively rare at intermediate redshifts (z ∼ 2−3, see e.g. Erb et al. 2010; Le Fèvre et al. 2019; Schmidt et al. 2021) and in the low-z Universe (see e.g. Senchyna et al. 2017; Berg et al. 2019).
Low-z galaxies showing nebular emission in C IV λ1550, He II in the UV (He II λ1640) and optical (He II λ4686), and other high ionisation lines, such as [Ne V]λ3426, are primarily known among metal-poor star-forming galaxies (Berg et al. 2019; Senchyna et al. 2017; Guseva et al. 2000; Shirazi & Brinchmann 2012). In the IR domain, the fine structure lines of [O IV] 25.9 μm, as well as [Ne V] 14.3 μm and 24.3 μm, for example, are also detected in certain star-forming galaxies and their strength increases in active galactic nuclei (AGN) (Sturm et al. 2002; Fernández-Ontiveros et al. 2016). The relative weakness and paucity of these lines in star-forming galaxies is not surprising since nebular C IV λ1550, He II λ4686, O IV, and Ne V emission lines require photons with energies above 47.9, 54.4, 54.9, and 97.1 eV, respectively, which are relatively sparsely emitted by stars and stellar populations and thus thought to be associated with other sources of higher energy photons.
In fact, the presence and strength of nebular He II λ4686 in optical spectra (and that of [O IV] in IR spectra) of star-forming galaxies had already been recognised early on as a puzzle or problem (e.g. Schaerer 1996; Guseva et al. 2000; Shirazi & Brinchmann 2012), except in galaxies showing significant populations of Wolf-Rayet (WR) stars, which could be hot and numerous enough to produce sufficient doubly ionised He (He2+) (e.g. Schaerer 1996; Schaerer & Stasińska 1999). ‘Normal’ stellar populations do not predict hard ionising spectra above 54 eV sufficiently. Given that WR stars become much rarer at low metallicity (12 + log(O/H)≲8.2), other sources or processes must be found to explain nebular He II emission in these galaxies. Furthermore, nebular He II λ4686 is quite ubiquitous at these low metallicities1, and the average observed intensity He II/Hβ increases with decreasing O/H. This describes the essence of the nebular He II problem.
Despite constant improvements in stellar evolution and atmosphere models, this problem has not been solved yet. Indeed, the nebular He II problem has by large been confirmed by many more recent works using different up-to-date stellar population and photoionisation models, both analysing the optical and UV recombination lines of He II λ4686 and He II λ1640 from different galaxy samples (e.g. Stasińska et al. 2015; Steidel et al. 2016; Nanayakkara et al. 2019; Saxena et al. 2020a; Stanway & Eldridge 2019; Plat et al. 2019; Berg et al. 2021).
On the other hand, various alternate sources and mechanisms have been explored to attempt to solve the nebular He II problem. For example, radiative shocks have been proposed to explain both the observed He II λ4686 and [Ne V]λ3426 emission in some low-metallicity galaxies (see e.g. Thuan & Izotov 2005; Izotov et al. 2012; Plat et al. 2019). X-rays from sources such as high-mass X-ray binaries (HMXBs) and ultra-luminous X-ray sources (ULXs) have been advocated as the origin of nebular He II emission (e.g. Schaerer et al. 2019; Oskinova et al. 2019). Other authors argued for possible contributions of Pop III-like (metal-free) stars, fast-rotating stars, stripped stars in binary systems, or something similar, which could boost the emission of He II ionising photons (see Cassata et al. 2013; Szécsi et al. 2015; Götberg et al. 2019; Stanway & Eldridge 2019). Recently, some studies have also proposed ‘unconventional’ explanations, which do not require additional ionising sources or peculiar stars (Barrow 2020; Pérez-Montero et al. 2020), and which are discussed later (Sect. 4.3). Clearly, no consensus has been achieved yet on the origin of nebular He II, and each of the above scenarios can be debated. Furthermore, several of them do not make any quantitative predictions which can be compared with observations and tested.
In the present paper, we examine the impact of X-ray sources (HMBXs and ULXs) on nebular He II and other emission lines in a quantitative manner, using Cloudy photoionisation models. Our approach is motivated by the simple model of Schaerer et al. (2019), who compare the observed increase in the X-ray luminosity per unit star-formation rate (LX/SFR) with decreasing metallicity (Brorby et al. 2016; Douna et al. 2015) with the observed increase in the He II/Hβ intensity, and propose a causal connection between the two. Such a connection appears quite natural since the X-ray emission in star-forming galaxies is dominated by individual bright sources (HMXBs and/or ULXs, Mineo et al. 2012) and several ULXs are known to show nebulae with He II emission and also [O IV] 25.9 μm (Pakull & Angebault 1986; Pakull & Mirioni 2003; Kaaret & Corbel 2009; Berghea & Dudik 2012). Postulating a simple scaling between the He+ ionising and X-ray flux taking from observations, Schaerer et al. (2019) have shown that the observed He II/Hβ intensities and their metallicity dependence can approximately be explained.
Several studies have criticised the recent HMXB and ULX scenario. For example, Kehrig et al. (2021) argue that the observations of the low metallicity galaxy I Zw 18 used by Schaerer et al. (2019) for the scaling show an insufficient contribution of the ULX in this galaxy to He II ionising photons. New integral field spectroscopic observations with the Keck telescope of I Zw 18 provide a less definite answer on this issue, and Rickards Vaught et al. (2021) argue that shocks or beamed X-ray emission from ULXs could be responsible for the He II emission. Senchyna et al. (2020) report the absence of bright X-ray sources in several nearby galaxies with nebular He II. Furthermore, using simple photoionisation models combining HMXBs described by a multi-colour disc model with normal stellar populations, Senchyna et al. (2020) conclude that HMXBs are inefficient producers of the photons necessary to power He II.
On the other hand, observations of ULXs in nearby galaxies have often revealed the presence of nebulae, some, but not all of them, showing high ionisation emission lines (cf. review of Kaaret et al. 2017). For example, nebular He II λ4686, [Ne V]λ3426, and [O IV] 25.9 μm emission has been observed by Pakull & Mirioni (2003), Lehmann et al. (2005), Abolmasov et al. (2008), Kaaret & Corbel (2009), Berghea et al. (2010), Grisé et al. (2011), Maggi et al. (2011), Moon et al. (2011), Berghea & Dudik (2012), Binder et al. (2018), Urquhart et al. (2018) and Vinokurov et al. (2018) in different ULX nebulae, including famous objects such as Holmberg II X-1, NGC 5408 X-1, among others. Similarly, nebular He II is also seen in HMXBs of a lower X-ray luminosity (e.g. Pakull & Angebault 1986). Observationally, HMXBs and ULXs can thus produce ionising photons which give rise to some or several of the high ionisation lines discussed above and observed in low-metallicity star-forming galaxies. In addition, HMXBs and ULXs are known and predicted to be more numerous and luminous at low metallicities, their contribution is expected to be dominant in distant star-forming galaxies, and LX/SFR increases towards high redshift (Fragos et al. 2013; Lehmer et al. 2016; Madau & Fragos 2017; Fornasini et al. 2019; Kovlakas et al. 2020). It is therefore of interest to explore the effect of ULXs whose spectra are constrained by observations on integrated galaxy spectra.
For this purpose, we constructed spectral energy distributions (SEDs) of star-forming galaxies including a contribution from ULXs. The stellar spectra, taken from the BPASS binary population synthesis code (Eldridge et al. 2017), were combined with three SEDs of ULX sources with nebulae, and whose spectra have been constrained by multi-wavelength observations by Kaaret & Corbel (2009) and Berghea & Dudik (2012). Combined SEDs were constructed in such a way to allow for variable amounts of X-ray luminosities, corresponding to the observed range of LX/SFR in star-forming galaxies. With these SEDs, we computed small grids of Cloudy photoionisation models to predict the most relevant optical emission lines, which were then compared to observations of a large sample of star-forming galaxies for which measurements of nebular He II are available.
Our methodology is described in Sect. 2. In Sect. 3 we present the predicted high ionisation emission line strengths as well as the most important optical emission lines using various emission line diagrams, showing the impact of varying amounts of X-ray emission on these observables. We discuss our results and other recent approaches in Sect. 4. Our main conclusions are summarised in Sect. 5.
2. Photoionisation models of star-forming galaxies including ULXs
To predict the emission line spectra of star-forming galaxies which harbour HMXB or ULX sources, we needed to compute detailed photoionisation models using appropriate SEDs. Since, in general, the available theoretical SEDs of galaxies do not include X-ray sources, we first compiled several spectra of ULXs from the literature, which we then combined using an appropriate scaling with SEDs from evolutionary synthesis models describing the ‘normal’ stellar populations, that is excluding the contribution from ULXs. We now briefly describe the SEDs we used, the way they were combined, and the Cloudy model grid we computed.
2.1. SEDs of ULXs
The SEDs of ULXs are relatively poorly known, and they show a large diversity and also variability (e.g. Gladstone et al. 2009; Sutton et al. 2013a,b; Walton et al. 2015; Pintore & Mereghetti 2016; Gúrpide et al. 2021a). In general, the X-ray spectra of ULXs is modelled by the sum of two components related to the emission from the accretion flow produced close to the compact object: a multi-colour black body for the accretion disc and a power law representing the coronal emission (Kaaret et al. 2017). Also, the UV and optical spectra can often be fitted by a companion star or an irradiated (sometimes supercritical) disc (cf. Grisé et al. 2012; Tao et al. 2012; Gúrpide et al. 2021b), which further illustrates the uncertainties in the SEDs.
From the literature, we compiled three SEDs of ULXs, which have not only been observed at X-ray wavelengths but also at longer wavelengths (optical and some also in the IR), and for which tailored photoionisation models fitting the X-ray data and other observational constraints have been constructed. These spectra cover the entire spectral range from the X-rays to the extreme-UV, extending down to low energies (∼54 eV and lower), which is mandatory to allow combinations with stellar spectra and to explore, in particular, their impact on He II lines, whose ionisation potential is 54 eV. In particular, throughout this work, we assume that the radiation in the UV-optical regimes is predominantly produced by stars, while the radiation in the X-rays is produced by the ULX. Later we comment on the choice and representativeness of these SEDs (Sect. 4.2).
The SEDs used in this paper are shown in Fig. 1, and their main relevant properties, which are discussed below, are summarised in Table 1. In short, we list two indicators of spectral hardness. The first one gives the ratio of the ionising photon fluxes above 54 eV, Q2, over those above 13.6 eV, Q0, which measures the hardness of the ionising spectrum above the He+ potential to that of hydrogen. The second quantity, Q2/LX measures the relative number of He+ ionising photons emitted per X-ray luminosity (0.5−8 keV in this work), that is an efficiency of the X-ray source to produce He II recombination line emission. It is listed only for SEDs with an X-ray component. We note that Q0/Q2 is not given for pure ULX SEDs since their contribution to H ionisation is negligible in combined models.
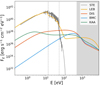 |
Fig. 1. Basic SEDs used for the photoionisation models: The three ULX spectra (DIS, BMC, and KAA), normalised to the same X-ray luminosity LX, are shown by the red, blue, and green lines, respectively. For comparison the pure stellar SED, labelled STE and shown by the grey line, is scaled to our standard value of LX/SFR = 7.9 × 1039 erg s−1/(M⊙ yr−1); see text. The SED of I Zw 18 (LEB model) from Lebouteiller et al. (2017) is shown in yellow and scaled to the same stellar UV flux at ∼10 eV as STE, resulting in an LX higher by a factor ∼2.8 compared to the ULX spectra. The vertical dashed lines mark the ionisation potentials of hydrogen and helium (13.6 eV and 54 eV, respectively). The grey shaded area highlights the 0.5−8 keV range of the spectra used for LX. |
Spectral properties of the basic ULX and stellar SEDs.
2.1.1. NGC 6946 X-1 SEDs
Two SEDs are taken from Berghea & Dudik (2012), who have produced a model for the full optical to X-ray SED of the ULX NGC 6946 X-1 associated with the MF 16 Nebula. This ULX has very similar properties to the famous Holmberg II ULX (e.g. Miller et al. 2005; Goad et al. 2006; Walton et al. 2015) and emission in the IR nebular [O IV] line, often seen in AGN, and was detected by Berghea et al. (2010). Several X-ray models were used to reproduce published Hubble optical and UV data along with data obtained via X-ray spectroscopy.
Berghea & Dudik (2012) found two XSPEC (Arnaud 1996) Comptonisation models which can fit the X-ray data equally well.
-
DISKIR (irradiated disc; hereafter DIS): This model represents an accretion disc whose outer region is irradiated by its inner region and the coronal emission of the black hole. A fraction of the bolometric flux of the inner disc is thermalised to the local blackbody temperature at each radius, changing the thermal structure of the outer regions and, consequently, the shape of the SED. This model could fit a fraction of the ULXs and it was originally presented as a representation of binary black hole systems. In it, the bulk of the disc’s flux is reflected and only the hardest X-ray photons heat the disc (Gierliński et al. 2009).
-
BMC (Comptonisation by relativistic matter): This is an analytic model that describes the Comptonisation of soft photons by matter undergoing relativistic bulk motion. It is typically used to describe thermal X-rays which originate in the inner region of an accretion disc in a binary black hole system (Gliozzi et al. 2011), and the in-falling matter is heated in the vicinity of the event horizon of the black hole, generating high energy photons (Titarchuk et al. 1997).
These models specifically describe high mass X-ray systems. The difference between these models is found in the predictions they yield for the optical and UV data. Specifically, the BMC model requires a bright stellar companion in order to fit this part of the spectrum of the MF16 nebula, while the DIS model does not. We included the BMC model without a stellar companion to our calculations because we are interested in the high-energy spectrum of the ULX, which will be combined with a stellar population model in order to produce a complete SED. For this work we used both models, BMC and DIS, to which we added stellar emission from the integrated population.
2.1.2. NGC 5408 X-1 SED
The third SED (KAA, hereafter) is a model of a photoionised nebula created by analysing the spectra of the optical counterpart of the ULX NGC 5408 X-1 as described in Kaaret & Corbel (2009). Some authors argue that this source hosts an intermediate-mass black hole candidate, whereas others argue for a stellar-mass compact object accreting at a super-Eddington rate (cf. Kaaret & Corbel 2009; Middleton et al. 2011). The spectra of this nebula show high excitation emission lines, in particular He II λ4686 and [Ne V]λ3426, which suggest X-ray photoionisation (Kaaret & Corbel 2009; Cseh et al. 2012). The KAA SED is based on a Comptonisation model (compps, Poutanen & Svensson 1996) and includes a multi-colour blackbody representing the emission from the wind or the outer parts of the supercritical disc and a cutoff powerlaw as a proxy for the emission emitted closer to the compact object (Gladstone et al. 2009). This model works by using exact numerical solutions for the radiative transfer equation and includes parameters such as geometry, optical depth, electron distribution, the spectral distribution of soft seed photons, and the angle of the observer.
2.2. A galaxy SED including an ULX – I Zw 18
In addition to the abovementioned SEDs, which primarily focus on the X-ray part of the spectrum and describe ULXs, we also used a SED of the well-known metal-poor galaxy I Zw 18, which harbours a ULX source in the centre of its main H II region, I Zw 18-NW. Detailed multi-wavelength observations covering numerous emission lines and tracers from different ISM phases are available for this region. Lebouteiller et al. (2017) have studied this object in depth and they demonstrate the importance of the ULX for understanding this giant H II region. Their SED for the north-western region (standard, LX = 4 × 1040 erg s−1), including stellar and X-ray emission constructed using multiple, empirically adjusted components and an accretion disc model (diskbb) for the X-ray source, is shown in Fig. 1 and denoted by LEB subsequently. As discussed in Lebouteiller et al. (2017), the SED was empirically adjusted at energies close to the He+ ionisation potential. Since this is a ‘combined’ and empirically constrained galaxy SED, covering the entire spectral range (from UV to X-rays) or relevance here, the X-ray contribution is kept fixed.
2.3. Photoionisation modelling using combined SEDs
Finally, to produce complete SEDs including stellar and X-ray emission, we combined the above ULX spectra with SEDs obtained from the binary population synthesis code BPASS v2.1 in Eldridge et al. (2017). We adopted the predicted SED of a young population (age 106 yr), with a Kroupa initial mass function allowing for stellar masses up to 100 M⊙, and a metallicity of 12 + log(O/H) = 8.1. In this work we aim to study the effect of the X-ray contribution that ULXs can have over a galaxy, thus, we have focussed on one stellar metallicity only, chosen to be representative of our observational sample (cf. below). Small metallicity variations in the stellar model do not produce significant changes in the SED shape or in the resulting emission line intensities. The young age was chosen for comparison purposes with earlier studies, which commonly use such ages for comparisons with observations (BPT diagrams and others), since this provides relatively hard ionising spectra (see e.g. Kewley et al. 2006; Stasińska et al. 2015; Nakajima et al. 2018). The stellar SED is denoted as STE.
For the combination of ULX and stellar SEDs, we were guided by the observed correlation between the X-ray luminosity and star-formation rate (SFR) in star-forming galaxies, which also shows a metallicity-dependence (see e.g. Ranalli et al. 2003; Gilfanov et al. 2004; Laird et al. 2005; Mineo et al. 2014; Brorby & Kaaret 2017). Observations typically range from LX/SFR ∼ 1039 − 1041 erg s−1/(M⊙ yr−1), with lower (higher) values at high (low) metallicity. As a standard value we adopted LX/SFR = 7.9 × 1039 erg s−1/(M⊙ yr−1) (hereafter called the ‘base model’), and we explored variations of ±1 dex or more. To scale the stellar SED, we simply used the standard conversion factor between the UV luminosity at 1500 Å and the SFR, given by Kennicutt (1998).
The resulting SEDs were then used as input to the Cloudy photoionisation code of Ferland et al. (2017), version C17.00, to compute a grid of models with a varying ionisation parameter with values between log U = −1.5 and −3.5. This parameter is proportional to the ratio of ionising photons to total hydrogen density, and the range was chosen in order to span the observed range of the main relative line intensities, as commonly adopted in the literature (e.g. Feltre et al. 2017; Ji et al. 2020; Ramambason et al. 2020). The models have a closed geometry and are ionisation bounded, that is to say the calculation stops when the hydrogen ionisation front is reached. We adopted solar abundance ratios from Grevesse et al. (2010), identical stellar and nebular metallicities, and a metallicity of 12 + log(O/H) = 8.1 for the base model. The range of parameters explored is described in Table 2. In this paper the X-ray luminosity, LX, refers to the energy range of 0.5−8 keV.
Model parameters of the Cloudy grid for the ‘base model’.
2.4. Observational sample
To compare our models with observations, we used a sample of 5607 star-forming galaxies from the Sloan Digital Sky Survey (SDSS) Data Release 14 (Abolfathi et al. 2018) compiled by Y. Izotov and Collaborators, analysed in earlier publications (Guseva et al. 2019; Ramambason et al. 2020). The selection criteria used for the extraction of galaxies with active star formation are presented in Izotov et al. (2014). Then we required a detection of the [O III] λ4363 line with an accuracy better than 4σ, thus allowing direct abundance determinations using the Te method. The overall properties of the parent sample from Data Release 14 are discussed in Guseva et al. (2019).
In Fig. 2 we show the metallicity distribution of the observational sample and the metallicity of our Cloudy models chosen to be representative of the observations. In this sample, approximately 36% show nebular He II λ4686 emission, with a mean He II/Hβ ratio of I(4686)/I(Hβ) =  and a mean metallicity of the He II emitters of
  . The errors indicate the dispersion of the distributions. In approximately two-thirds of the galaxies, HeII emission is not detected with relative intensities below I(4686)/I(Hβ) ≲ (2−3) × 10−3. A smaller, but similarly selected sample of nebular He II emitters has been discussed in Schaerer et al. (2019, 2020).
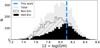 |
Fig. 2. Metallicity histogram for the observational sample. In black we highlight the distribution of the He II emitters. The vertical dashed line shows our selected metallicity at 12 + log(O/H) = 8.1. |
3. Results
We now present the results from our photoionisation models and compare them to observations.
3.1. Galaxy SEDs including ULXs can produce enough He II emission to explain observations
In Fig. 3 (top panel), we show the predicted He II λ4686/Hβ intensity for the Cloudy models, using different SEDs, and as a function of LX/SFR. The range of observed He II λ4686/Hβ intensities (when detected) is also shown for comparison. At a given LX/SFR, the highest He II λ4686/Hβ intensities are found for the DIS models, followed by BMC and KAA. This is expected since it reflects the decreasing amount of the He+ ionising photons of these SEDs when normalised to the same X-ray luminosity, expressed by Q2/LX (see Table 2). The dispersion for a given SED is due to changes in the ionisation parameter, with higher U leading to stronger He II emission. The LEB models with a different log⟨U⟩ are overplotted, showing that the LEB SED can reproduce the observed He II strength. Moreover, the points overlap showing that the variation of log⟨U⟩ does not make a significant difference in the predicted He II emission. In passing, we note that the Cloudy predictions for He II λ4686/Hβ for SEDs including X-rays agree or are somewhat lower than the expectations from Case B, as shown in the appendix. Finally, He II λ4686/Hβ increases with LX/SFR since the contribution from X-rays controls the emission of He+ ionising photons, which primarily originate from the ULX component (and not from stars).
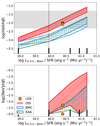 |
Fig. 3. Predicted relative emission line intensity ratios of nebular He II λ4686 (top) and [Ne V]λ3426 (bottom) as a function of LX/SFR for different SEDs. Each colour represents a different X-ray model. The horizontal grey area shows the typical range of the observed He II line intensity, when detected. The vertical dashed line indicates the LX/SFR value of our ‘base model’. The dispersion in each SED model is due to changes in the ionisation parameter. It can be seen that an increase in the X-ray component produces stronger He II emission, overlapping with the observational area for LX/SFR ≃ 1040 − 1041 erg s−1/(M⊙ yr−1), depending on the adopted ULX SED. For comparison, the value for the LEB models are overplotted, showing that the LEB SED can reproduce the observed He II strength. In approximately two-thirds of the galaxies, HeII emission is not detected with relative intensities below I(4686)/I(Hβ) ∼ (2−3) × 10−3. The models with LX/SFR < 1040 erg s−1/(M⊙ yr−1) do not produce significant [NeV] emission (i.e. I([NeV])/I(Hβ) < 10−4), and they are therefore not included. |
Compared to observations, we find that some of the models predict He II intensities which are strong enough to reach the levels of the observations, that is galaxies where nebular He II is detected. Overall, with the ULX SEDs examined here, we find that values of LX/SFR ≳ 1040 erg s−1/(M⊙ yr−1) are required to reach currently detectable levels of He II λ4686 emission. There are several ways to explain the absence of He II emission well below the threshold of the current observations (He II λ4686/Hβ ≲ 0.005). Indeed, even in the presence of ULXs or other X-ray sources, the diversity of their intrinsic properties (SEDs in particular) and variations in the ionisation parameter can cause very weak or no He II emission. More detailed comparisons with observations also involving other emission lines will be discussed below.
3.2. [Ne V] emission and its relation with He II
In addition to He II, a few blue compact dwarf galaxies show [Ne V]λ3426 emission (Izotov et al. 2004, 2012; Thuan & Izotov 2005). Given its high ionisation potential of 97.1 eV, this line is often associated with hard non-thermal radiation from AGN, making its detection in star-forming galaxies interesting to explore. The study of Izotov et al. (2012) lists eight low-metallicity star-forming galaxies, in total, with intensities of [Ne V]λ3426/He II λ4686 ∼ 0.2−0.5, which they propose can be explained by fast radiative shocks contributing ∼10% of the stellar ionising (Lyman continuum) flux. We attempt to explain these observations with our models.
In Fig. 3 (bottom panel), we show the predicted [Ne V]λ3426 line intensity. As expected, for a given LX/SFR, the highest [Ne V]λ3426/Hβ intensities are again found in the DIS model, followed by BMC and KAA. This is analogous to the case of He II/Hβ, and it is explained by the decreasing number of Ne4+ ionising photons in the different SEDs. Compared to He II/Hβ, however, the [Ne V] line intensity decreases more rapidly with decreasing LX/SFR, and a higher LX/SFR is needed in order to produce [Ne V] emission with comparable (and detectable) intensities as He II λ4686. Finally, the [Ne V] emission strongly depends on the ionisation parameter (as expected for forbidden lines), in contrast to the He II recombination lines, and significant emission is only predicted for models with high U (log U = −1.5 to −2.5). The observed intensities, reaching up to [Ne V]λ3426/Hβ = 0.0091 ± 0.0031 in galaxies with strong He II λ4686/Hβ ∼ 0.03 (Izotov et al. 2012) are well reproduced by our models. The strong dependence of the [Ne V] line on U (primarily) and variations in the SED shape can also naturally explain why only a (small) fraction of He II emitters also show [Ne V].
3.3. The impact of ULXs on emission line diagnostics
To examine the effect of the high energy part of the SED on the optical emission lines, we reproduced line ratio diagrams probing three ionisation stages of oxygen, the strength of nebular He II, and two classical BPT diagrams (Baldwin et al. 1981) involving oxygen and nitrogen lines. Figure 4 shows four different representations of the results: [O III]/[O II] versus [O I]/[O III] and He II/Hβ on the left, and BPT on the right. Several of these diagrams were also discussed and compared to the same observational sample in Stasińska et al. (2015) and Ramambason et al. (2020). As shown in Fig. 4, and as is well known, the ionisation parameter U basically determines the observed [O III]/[O II] ratio, and overall also [O III]λ5007/Hβ (cf. Kewley et al. 2006). Then, at fixed U, the addition of X-rays primarily leads to an increase in He II λ4686/Hβ as shown above (Fig. 3) by up to three orders of magnitudes for the model SEDs and maximum LX/SFR value considered here. The low energy tail of the X-ray emission not only creates a central He2+ region from which the He II recombination lines are then emitted, but the large mean free path of the soft X-ray photons also leads to an extension of the H II region in the outer parts, thus causing stronger emission from low ionisation lines emitted in these regions. This explains the increase in [O I] λ6300/Hα also shown in this figure. As expected, the harder the spectra – as measured by Q2/Q0 – the higher the maximum intensity is of both He II λ4686/Hβ and [O I] λ6300/Hα. Other lines such as [N II] are not significantly affected by X-rays because the [N II] lines are formed in more central regions of the nebula.
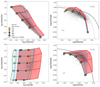 |
Fig. 4. Emission line ratio diagrams for our models (log U and LX/SFR) for different SEDs compared to the observational sample. The left column shows high-ionisation emission line diagrams (see Stasińska et al. 2015), while the right column shows low-ionisation diagrams (BPT diagram; e.g., Kewley et al. 2006; Baldwin et al. 1981). The points within a same model show the outputs obtained for the base models and different ionisation parameters. The shaded and coloured areas show the range of emission line ratios covered by the DIS, BMC, and KAA models with varying X-ray luminosities and an ionisation parameter. The lines show the results for the same ionisation parameter for each model (from top to bottom, log U = −1.5, −2.0, −2.5, −3.0, −3.5) and increasing X-ray emission from left to right. For the stellar (STE) and the LEB SED, the X-ray luminosity is constant by construction (and LX = 0 for STE). The observational sample is shown by the grey symbols, where dots show the He II emitters and crosses the sources where He II is not detected. In approximately two-thirds of the galaxies, HeII emission is not detected with relative intensities below I(4686)/I(Hβ) ∼ (2−3) × 10−3. |
The comparison of the models with the observations plotted in Fig. 4 shows that the combination of stellar and ULX SEDs allows one to cover basically the entire range of emission line ratios, including He II/Hβ as already shown in Fig. 3. The [N II] λλ6548,6584/Hα BPT diagram is well reproduced, that is to say our models follow the observational sample, which is particularly due to an appropriate N abundance for this sample. The purely stellar models and those with low amounts of X-rays do somewhat underpredict the [O I] λ6300 emission, as also seen in other studies (Stasińska et al. 2015; Plat et al. 2019; Ramambason et al. 2020). Interestingly, the addition of X-rays allows one to simultaneously reach the observed intensities of He II λ4686 and a slight ‘boost’ of [O I] λ6300 to potentially reconcile these different line ratios in a consistent manner, which is further illustrated in Fig. 5. However, alternative explanations for the possible discrepancies of [O I] λ6300 and other low ionisation lines, which are not related to high energy emission, exist (see e.g. Stasińska et al. 2015; Ramambason et al. 2020).
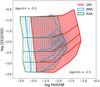 |
Fig. 5. Relation between [OI]/[OIII] and HeII/Hβ for the DIS, BMC, and KAA models (shaded areas) along with the observational sample (dots). From top to bottom we show the increasing ionisation parameter (lines). In approximately two-thirds of the galaxies, HeII emission is not detected with relative intensities below I(4686)/I(Hβ) ∼ (2−3) × 10−3. |
4. Discussion
The above results are promising, showing that the presence of ULXs in star-forming galaxies can – in some conditions – explain the observed emission of nebular He II and other lines in low metallicity galaxies. We now discuss these conditions and related assumptions, other studies on the contribution of ULXs and HMXBs, as well as other approaches to tackle this problem.
This work has shown that X-ray emission can drive the nebular He II emission by using ULXs and HMXBs as the sources of the observed high energy radiation. In particular, we found that the model DIS yields the most promising results. In low metallicity galaxies, HMXBs are expected to outnumber low mass X-ray binaries by a factor of ∼10 (Douna et al. 2015). Additionally, about two-thirds of the LX, 0.5−8 keV per unit SFR are expected to be due to HMXBs (Mineo et al. 2014). If HMXBs are indeed responsible for the nebular He II emission, the excess of these objects at lower metallicity would agree with the observations.
4.1. The ULX and HMXB – He II connection in the literature
Our study follows up on the scenario proposed by Schaerer et al. (2019, 2020), who relate the observed anti-correlation between the integrated LX/SFR and metallicity of star-forming galaxies (Douna et al. 2015; Brorby et al. 2016; Lehmer et al. 2021) to the same observed trend of nebular He II λ4686/Hβ with metallicity. They show that the observations can roughly be reproduced with simple assumptions and an empirical calibration of Q2/LX = (1−3) × 1010 photon erg−1 based on the ULX observed in the low-metallicity galaxy I Zw 18. This work postulates that X-ray bright sources (HMXBs and ULXs) are the main source of He+ ionising photons in low-metallicity galaxies.
Overall, the present work builds on the same assumptions, using, however, detailed SEDs of ULXs to perform quantitative photoionisation models to predict not only the He+ and H recombination lines, but also metallic forbidden lines, which are successfully compared to the observations. In particular, our Cloudy models can reproduce the observed intensities of the high ionisation lines of He II, [Ne V]λ3426, as well as the lines of [O III], [O II], and [O I]2. Observationally, Saxena et al. (2020a,b) have explored the X-ray emission from a sample of 18 He II emitters and a comparison sample of non-He II emitters at redshift z ∼ 3 by stacking, finding similar ratios of LX/SFR for both samples. From this, they conclude that X-ray binaries or weak or obscured AGN are unlikely to be the dominant producers of He+ ionising photons in star-forming galaxies at this redshift. For the 18 He II emitters available for this study, they obtain a stacked  (in erg s−1/(M⊙ yr−1) at z = 3.04, and
  for the non-emitters at z = 3.15. Both values are compatible with existing measurements at z ∼ 1.5−2.3 (Fornasini et al. 2019). However, the uncertainties on LX/SFR are quite large, especially for the He II emitters, and the LX/SFR of both samples is not significantly larger than the average value observed in the low-z Universe at solar metallicity log LX/SFR = 39.55 ± 0.15 (see e.g. Brorby et al. 2016), where nebular He II emission is generally not observed (cf. Guseva et al. 2000; Shirazi & Brinchmann 2012). Further observational studies are desirable to reach firmer conclusions (cf. below).
Senchyna et al. (2020) performed a similar modelling exercise as the present study, but they have reached opposite results. They used spectra of HMXBs from the multi-colour disc model (Mitsuda et al. 1984), producing a modified blackbody spectrum representing gas at a range of temperatures in the accretion disc, and different black hole masses. These SEDs were then combined in the same way as in our study to the SED of integrated stellar populations, assuming variable amounts of LX/SFR, and then processed by Cloudy models. From their work, Senchyna et al. (2020) conclude that HMXBs are not efficient enough to produce the needed amount of He+ ionising photons, and hence that the HMXBs are not the dominant source of nebular He II in low-metallicity galaxies. The main differences with the present work are the adopted SEDs used to describe the X-rays sources. Clearly, the SEDs assumed by Senchyna et al. (2020) are very hard, and hence predict only small amounts of ionising photons close to the He+ ionisation potential. In other words, their input spectra have a significantly lower Q2/LX than the ULX SEDs adopted here, which directly translates to lower He II λ4686/Hβ ratios for the same amount of X-ray emission (i.e. the same LX/SFR). The success or failure of their model and ours therefore largely depends on the assumed X-ray SEDs that are adopted. We now discuss this issue and the diversity of SEDs among ULXs and HMXBs.
4.2. Diversity of SEDs among ULXs
Early ULX observations were dominated by a single spectral component that could be fitted with accretion disc models (Makishima et al. 2000). However, as the spectral quality of observations improved with Chandra and XMM-Newton, it became evident that this single component model was not physically motivated and that deeper observations required more complex modelling (Kaaret et al. 2017).
A physically motivated ULX model would have two main components: an accretion disc modelled by radially dependent blackbodies and a Comptonised corona. The relative flux of these components varies, making the spectrum change its hardness (e.g. ‘soft UL’ and ‘hard UL’; Sutton et al. 2013a,b). The fundamental properties of X-ray binaries are the mass, spin and nature of the compact object and companion star, as well as their orbital separation and eccentricity. The variation of these properties produces different SED shapes. In addition, as already discussed above, different components may be present (intermediate-mass BHs, irradiated discs, and supercritical irradiated discs), and the mass-transfer rate is also expected to affect the intrinsic SEDs. Many studies suggest that ULXs correspond to a subset of sources with super-Eddington accretion rates seen basically face-on, whereas observations at high inclinations would see the enshrouded accretor as microquasars or super-soft sources (see Kaaret et al. 2017; Urquhart et al. 2019, and references therein).
Observationally, ULXs show emission across a wide spectral range, in some cases including radio emission and nebulae detected at optical and IR wavelengths, illustrating the many diverse associated processes (e.g. Cseh et al. 2014; Liu et al. 2015). In the case of nebulae, the detected emission lines may provide useful information on the SEDs in the spectral range of interest here (primarily > 54 eV and up to the X-ray domain) and on the contributions from other processes (e.g. shocks). Indeed, as already mentioned in the Introduction, numerous ULX nebulae showing high ionisation lines as He II λ4686, [Ne V]λ3426, and [O IV] have been reported (e.g. Pakull & Mirioni 2002; Lehmann et al. 2005; Abolmasov et al. 2007, 2008; Kaaret & Corbel 2009; Berghea et al. 2010; Grisé et al. 2011; Maggi et al. 2011; Moon et al. 2011; Berghea & Dudik 2012; Binder et al. 2018; Urquhart et al. 2018; Vinokurov et al. 2018), but others do not show such lines (e.g. Pakull & Mirioni 2002; Abolmasov et al. 2007; Díaz Tello et al. 2017). Interestingly, some microquasars also show nebulae with He II λ4686 emission (Pakull et al. 2010), which is another shared property with (some) ULXs. Statistical results regarding the frequency and strength of these important lines have, to the best of our knowledge, not been reported. In any case, the present results point towards a diversity of the SED in the UV-to-X-ray domain.
Thus far relatively few studies have examined ULX nebulae in classical BPT diagrams or used similar diagnostics to determine the dominant source of the optical emission (see e.g. Lehmann et al. 2005; Abolmasov et al. 2008). Recent examples of BPT diagrams are shown, for example, by Díaz Tello et al. (2017), who found a ULX nebula located on the border between star forming and AGN regions. Another nebula was found in the LINER domain (López et al. 2019). The emission line ratios of the high-ionisation nebula Holmberg II X-1 are consistent with H II regions (Lehmann et al. 2005). According to Kaaret et al. (2017), most nebulae appear to be powered by shocks between outflows and the surrounding medium, while few are powered by photoionisation. Again, both X-ray and photo-ionised regions as well as shock-ionised nebulae seem to exist, but statistics and a more profound understanding of these nebulae are lacking. In short, the variety and range of properties exhibited by ULXs make the modelling of ULXs a challenging task.
4.3. Other sources of nebular He II emission
Several other processes and sources to explain nebular He II emission in low-metallicity galaxies have been suggested and explored in the literature. These include, for example, shocks in the ISM and the existence of very hot stars, in addition to other ‘unconvential’ suggestions.
Thuan & Izotov (2005), Izotov et al. (2012), and others have proposed that fast radiative shocks can explain both the observed He II λ4686 and [Ne V]λ3426 intensities in some low-metallicity galaxies. Using the shock models of Allen et al. (2008) for SMC and LMC metallicities, Izotov et al. (2012) show that the main intensities can be reproduced with shocks contributing ∼10% of the total ionising flux, the rest being due to stars. Observed broad components in strong emission lines such as Hα could be a direct observational signature indicating such shocks. The studies of Plat et al. (2019) and others reach similar conditions, arguing for a shock or an AGN contribution to explain nebular He II. The principle difficulties of this scenario are probably predicting the required shock contribution in a quantitative manner and explaining the observed increase in He II/Hβ with decreasing metallicity. To the best of our knowledge, this has not been addressed yet in the literature.
Basically since the discovery of frequent nebular He II emission in low-metallicity galaxies, it has been shown that state-of-the-art evolutionary synthesis models combining the latest knowledge of stellar evolution and stellar atmospheres fall short of producing the high energy (> 54 eV) photons needed to reproduce this high ionisation line (see references in Sect. 1). Despite several updates, improvements, and the inclusion of stars resulting from stellar interactions in binary systems, this conclusion remains valid so far, as shown by several recent studies examining both the UV and/or optical He II recombination lines (e.g. Berg et al. 2018; Stanway & Eldridge 2019; Nanayakkara et al. 2019; Saxena et al. 2020a; Bian et al. 2020).
Despite this, several authors suggest that binary evolution, fast rotation, or other processes could lead to very hot stars, which should boost and maybe provide sufficient He+ ionising photons (e.g. Götberg et al. 2019; Bian et al. 2020). However, no quantitative stellar population model solving this observational problem has been presented so far. Two recent studies propose that nebular He II emission with the observed intensities could even be achieved with conventional stellar populations, that is without the need to invoke other sources of higher energy photons. For example, Barrow (2020) performed cosmological zoom-in simulations of high-redshift galaxies including SEDs from the Flexible Stellar Population Synthesis code (FSPS; Conroy & Gunn 2010) and following the evolution on very short timescales. In these simulations they identified several galaxies with He II λ4686/Hβ ∼0.001−0.03, which were found during specific, relatively short time intervals. The study of Barrow (2020) argues that gaps of ≥15 Myr in star formation could explain the high intensities of He II without the need for other ionising sources.
However, in the detailed simulations which reach metallicities of 12 + log(O/H)≲8.0, comparable to those observed in the low-z galaxy sample, their models predict lower intensities (He II λ4686/Hβ ≲ 0.007) than the observations. Furthermore, the predicted He II phases occur only in sources with low Hβ equivalent widths (EW(Hβ) ≲ 10 Å), in stark contrast to observations (see e.g. the compilation in Schaerer et al. 2019, 2020). Finally, the simulations predict only very few sources and short phases with nebular He II, which is again in contrast to the observations where nebular He II is detected in approximately two-thirds of the star-forming galaxy samples at metallicities of 12 + log(O/H)≲8.3. From this we conclude that their model is not comparable to the observed low-z galaxy sample or that additional high-energy sources are indeed needed.
In a recent work, Pérez-Montero et al. (2020) have studied the behaviour of the nebular He I and He II lines in low-z galaxies and they suggest that the observed intensities of He II could be explained by density-bounded H II regions powered by ‘normal’ stellar SEDs. To achieve this with normal SEDs, the relative He II λ4686/Hβ predicted for Case B (ionisation bounded nebulae) must be significantly ‘boosted’. This can in principle be achieved by reducing a large fraction of the Hβ emission which is emitted quite uniformly across the entire H II region, whereas the central He II-emitting region remains unchanged. However, to reach the observed He II intensities, a very high mean escape fraction fesc = 0.74 (or a mean absorption fraction of 26%) of the H ionising photons must be invoked (Pérez-Montero et al. 2020), which is not compatible with the observations. Indeed, overall Lyman continuum escape appears to be relatively rare and certainly well below this value at any redshift z ≲ 3 where it has currently been measured (see e.g. Siana et al. 2015; Grazian et al. 2017; Steidel et al. 2018; Alavi et al. 2020). Also, at z ∼ 0.3−0.4 where recent studies with the Hubble Space Telescope have detected some Lyman continuum emitters, the measured escape fractions range from ∼2−70% (see e.g. Izotov et al. 2021, and references therein), with a mean escape fraction well below the value invoked by Pérez-Montero et al. (2020). Furthermore, the known low-z leakers do not show different and enhanced He II/Hβ intensities (Guseva et al. 2000). Finally, with such a large mean escape fraction, the observed Hβ EW distribution of the He II emitters would be significantly altered (i.e. shifted to lower EW(Hβ) by a factor ∼4) and many He II emitters showing high EW(Hβ) (cf. Shirazi & Brinchmann 2012; Schaerer et al. 2020) could hence not be explained by the same stellar population model which predict a maximum EW(Hβ) which is quite close to the maximum observed value.
4.4. Future avenues
From the above discussions and based on our current knowledge of stars and stellar populations, we conclude that shocks, ULXs and HMBXs, a low-luminosity AGN contribution, or other sources of high energy photons are needed to solve the nebular He II problem. None of the existing scenarios provide fully satisfactory answers and/or quantitative results thus far. Clearly, more research is needed to unveil the mystery of He II nebular emission.
For example, theoretical and observational studies to better understand the SEDs of ULXs and HMXBs as well as their diversity might be of interest. Similarly, a better understanding of ULX nebulae, their frequency, observed spectra, etc. would be useful. More generally, investigations on the impact of X-ray sources (both discrete and diffuse) on the ISM and observed spectra of star-forming galaxies may also shed new light on the He II problem and other, possibly related issues. Along these lines, several recent studies have for instance investigated the link between X-rays and Lyα emitters, and possible connections between X-ray sources and Lyman continuum escape (see e.g. Sobral et al. 2015; Svoboda et al. 2019; Dittenber et al. 2020). More detailed investigations of shocks and their contribution to high ionisation lines, both on small scales (resolved) as well as in integrated galaxy spectra, would also seem of considerable interest.
The James Webb Space Telescope and other large telescopes will certainly continue to detect nebular He II emission in progressively more distant galaxies and provide invaluable new information on the stars, the ISM, and other components of galaxies in the early Universe. A proper solution for the long-standing nebular He II problem, which may affect other emission line diagnostics to a currently unknown extent, appears to be a fundamental goal to confidently exploit these powerful new observations.
5. Conclusions
We have quantitatively examined the impact of luminous X-ray sources on the optical emission lines of star-forming galaxies and nebular He II in particular. To do so, we combined three empirically constrained SEDs of ULXs with known nebulae from Berghea & Dudik (2012) and Kaaret & Corbel (2009) with the SED of stellar populations, as predicted from BPASS models (Eldridge et al. 2017). The X-ray luminosity of the source normalised to the SFR of the galaxy, LX/SFR, which is considered a free parameter, was used to explore the effect of the X-ray sources. We varied LX/SFR from 1039 to ∼1041 erg s−1/(M⊙ yr−1), thus covering the range observed in star-forming galaxies (e.g. Mineo et al. 2014; Brorby & Kaaret 2017). Using the combined SEDs, we then computed Cloudy photoionisation models for conditions representative of low-metallicity galaxies from the sample of Guseva et al. (2019). Our main findings can be summarised as follows:
-
The addition of X-ray emission from a ULX to a purely stellar SED hardens the spectrum of the galaxy, allowing a nebular He II emission with intensities up to He II λ4686/Hβ ∼ 0.04, comparable to the observations, with X-ray luminosities also compatible with observations. Increasing the X-ray contribution directly increases the output He II nebular emission.
-
We note that [Ne V] emission, which requires ionising photons with energies above 97.1 eV and is observed together with He II in a small number of blue compact dwarf galaxies, can be explained by the same models. The strong dependence of [Ne V] on the ionisation parameter can naturally explain why this line is only detected in a small fraction of He II emitters.
-
The contribution of ULXs to the galaxy SED affects the classical optical diagnostic diagrams. As expected, the high energy radiation boosts both high and low ionisation lines. We show, for example, that the BPT diagram involving [O I] λ6300/Hα is more significantly altered than [N II] λλ6548,6584/Hα.
-
We show that the main optical emission line ratios, involving three ionisation stages of Oxygen (namely [O III] λλ4959,5007, [O II] λ3727, and [O I] λ6300), He II λ4686, [N II] λλ6548,6584, plus Hα and Hβ, can consistently be reproduced by our galaxy SEDs including an ULX component.
-
In particular, we have shown that the most efficient model is one in which an irradiated disc X-ray model is added, which can fit some ULXs’ optical and X-ray wavelengths (DIS). The base spectra for the DIS model can achieve the observed percentage, while the BMC and KAA models are expected below it.
-
The impact of ULXs on the UV-optical emission lines of low-metallicity star-forming galaxies strongly depends on the shape of the SEDs of these X-ray sources, which are poorly known, most likely variable, and thus difficult to describe in an average sense.
For example, in the sample analysed by Schaerer et al. (2019), He II is detected in approximately two-thirds of the galaxies. In the larger sample analysed here, this is the case for approximately one-third of the star-forming galaxies.
Since observations probing O IV lines are quite rare, we are currently not able to examine this ionisation stage as well.
Acknowledgments
We thank Ciprian Berghea, Philipp Kaaret, and Vianney Lebouteiller for communicating SEDs from their work. We also thank various colleagues, including Yuri Izotov, Aayush Saxena, Laura Pentericci, Tassos Fragos, Andrés Gúrpide, Lida Oskinova, Nathalie Webb, Devina Misra, and John Chisholm for stimulating discussions on the nebular He II problem and ULXs during recent years. C. S. and A. V. acknowledge support from SNF Professorship PP00P2_176808. A. V. is supported by the ERC starting grant ERC-757258-TRIPLE.
References
- Abolfathi, B., Aguado, D. S., Aguilar, G., et al. 2018, ApJS, 235, 42 [NASA ADS] [CrossRef] [Google Scholar]
- Abolmasov, P., Fabrika, S., Sholukhova, O., & Afanasiev, V. 2007, Astrophys. Bull., 62, 36 [NASA ADS] [CrossRef] [Google Scholar]
- Abolmasov, P., Fabrika, S., Sholukhova, O., & Kotani, T. 2008, ArXiv e-prints [arXiv:0809.0409] [Google Scholar]
- Alavi, A., Colbert, J., Teplitz, H. I., et al. 2020, ApJ, 904, 59 [NASA ADS] [CrossRef] [Google Scholar]
- Allen, M. G., Groves, B. A., Dopita, M. A., Sutherland, R. S., & Kewley, L. J. 2008, ApJS, 178, 20 [Google Scholar]
- Arnaud, K. A. 1996, in Astronomical Data Analysis Software and Systems V, eds. G. H. Jacoby, & J. Barnes, ASP Conf. Ser., 101, 17 [NASA ADS] [Google Scholar]
- Baldwin, J. A., Phillips, M. M., & Terlevich, R. 1981, PASP, 93, 5 [Google Scholar]
- Barrow, K. S. S. 2020, MNRAS, 459, 4509 [NASA ADS] [CrossRef] [Google Scholar]
- Berg, D. A., Erb, D. K., Auger, M. W., Pettini, M., & Brammer, G. B. 2018, ApJ, 859, 164 [CrossRef] [Google Scholar]
- Berg, D. A., Chisholm, J., Erb, D. K., et al. 2019, ApJ, 878, L3 [NASA ADS] [CrossRef] [Google Scholar]
- Berg, D. A., Chisholm, J., Erb, D. K., et al. 2021, ApJ, 922, 170 [CrossRef] [Google Scholar]
- Berghea, C. T., & Dudik, R. P. 2012, ApJ, 751, 104 [NASA ADS] [CrossRef] [Google Scholar]
- Berghea, C. T., Dudik, R. P., Weaver, K. A., & Kallman, T. R. 2010, ApJ, 708, 364 [NASA ADS] [CrossRef] [Google Scholar]
- Bian, F., Kewley, L. J., Groves, B., & Dopita, M. A. 2020, MNRAS, 493, 580 [NASA ADS] [CrossRef] [Google Scholar]
- Binder, B., Levesque, E. M., & Dorn-Wallenstein, T. 2018, ApJ, 863, 141 [NASA ADS] [CrossRef] [Google Scholar]
- Brorby, M., & Kaaret, P. 2017, MNRAS, 470, 606 [NASA ADS] [CrossRef] [Google Scholar]
- Brorby, M., Kaaret, P., Prestwich, A., & Mirabel, I. F. 2016, MNRAS, 457, 4081 [NASA ADS] [CrossRef] [Google Scholar]
- Cassata, P., Le Fèvre, O., Charlot, S., et al. 2013, A&A, 556, A68 [NASA ADS] [CrossRef] [EDP Sciences] [Google Scholar]
- Conroy, C., & Gunn, J. E. 2010, Astrophysics Source Code Library [record ascl:1010.063] [Google Scholar]
- Cseh, D., Corbel, S., Kaaret, P., et al. 2012, ApJ, 749, 17 [NASA ADS] [CrossRef] [Google Scholar]
- Cseh, D., Kaaret, P., Corbel, S., et al. 2014, MNRAS, 439, L1 [NASA ADS] [CrossRef] [Google Scholar]
- Díaz Tello, J., Miyaji, T., Ishigaki, T., et al. 2017, A&A, 604, A14 [NASA ADS] [CrossRef] [EDP Sciences] [Google Scholar]
- Dittenber, B., Oey, M. S., Hodges-Kluck, E., et al. 2020, ApJ, 890, L12 [NASA ADS] [CrossRef] [Google Scholar]
- Douna, V. M., Pellizza, L. J., Mirabel, I. F., & Pedrosa, S. E. 2015, A&A, 579, A44 [NASA ADS] [CrossRef] [EDP Sciences] [Google Scholar]
- Eldridge, J. J., Stanway, E. R., Xiao, L., et al. 2017, PASA, 34, e058 [Google Scholar]
- Erb, D. K., Pettini, M., Shapley, A. E., et al. 2010, ApJ, 719, 1168 [Google Scholar]
- Feltre, A., Charlot, S., Mignoli, M., et al. 2017, Front. Astron. Space Sci., 4, 32 [NASA ADS] [CrossRef] [Google Scholar]
- Ferland, G. J., Chatzikos, M., Guzmán, F., et al. 2017, Rev. Mex. Astron. Astrofis., 53, 385 [NASA ADS] [Google Scholar]
- Fernández-Ontiveros, J. A., Spinoglio, L., Pereira-Santaella, M., et al. 2016, ApJS, 226, 19 [CrossRef] [Google Scholar]
- Fornasini, F. M., Kriek, M., Sanders, R. L., et al. 2019, ApJ, 885, 65 [NASA ADS] [CrossRef] [Google Scholar]
- Fragos, T., Lehmer, B., Tremmel, M., et al. 2013, ApJ, 764, 41 [NASA ADS] [CrossRef] [Google Scholar]
- Gierliński, M., Done, C., & Page, K. 2009, MNRAS, 392, 1106 [CrossRef] [Google Scholar]
- Gilfanov, M., Grimm, H. J., & Sunyaev, R. 2004, MNRAS, 347, L57 [NASA ADS] [CrossRef] [Google Scholar]
- Gladstone, J. C., Roberts, T. P., & Done, C. 2009, MNRAS, 397, 1836 [NASA ADS] [CrossRef] [Google Scholar]
- Gliozzi, M., Titarchuk, L., Satyapal, S., Price, D., & Jang, I. 2011, ApJ, 735, 16 [NASA ADS] [CrossRef] [Google Scholar]
- Goad, M. R., Roberts, T. P., Reeves, J. N., & Uttley, P. 2006, MNRAS, 365, 191 [NASA ADS] [CrossRef] [Google Scholar]
- Götberg, Y., de Mink, S. E., Groh, J. H., Leitherer, C., & Norman, C. 2019, A&A, 629, A134 [NASA ADS] [CrossRef] [EDP Sciences] [Google Scholar]
- Grazian, A., Giallongo, E., Paris, D., et al. 2017, A&A, 602, A18 [NASA ADS] [CrossRef] [EDP Sciences] [Google Scholar]
- Grevesse, N., Asplund, M., Sauval, A. J., & Scott, P. 2010, Ap&SS, 328, 179 [Google Scholar]
- Grisé, F., Kaaret, P., Pakull, M. W., & Motch, C. 2011, ApJ, 734, 23 [CrossRef] [Google Scholar]
- Grisé, F., Kaaret, P., Corbel, S., et al. 2012, ApJ, 745, 123 [CrossRef] [Google Scholar]
- Gúrpide, A., Godet, O., Vasilopoulos, G., Webb, N. A., & Olive, J. F. 2021a, A&A, 654, A10 [NASA ADS] [CrossRef] [EDP Sciences] [Google Scholar]
- Gúrpide, A., Godet, O., Koliopanos, F., Webb, N., & Olive, J. F. 2021b, A&A, 649, A104 [NASA ADS] [CrossRef] [EDP Sciences] [Google Scholar]
- Guseva, N. G., Izotov, Y. I., & Thuan, T. X. 2000, ApJ, 531, 776 [NASA ADS] [CrossRef] [Google Scholar]
- Guseva, N. G., Izotov, Y. I., Fricke, K. J., & Henkel, C. 2019, A&A, 624, A21 [NASA ADS] [CrossRef] [EDP Sciences] [Google Scholar]
- Izotov, Y. I., Noeske, K. G., Guseva, N. G., et al. 2004, A&A, 415, L27 [NASA ADS] [CrossRef] [EDP Sciences] [Google Scholar]
- Izotov, Y. I., Thuan, T. X., & Privon, G. 2012, MNRAS, 427, 1229 [NASA ADS] [CrossRef] [Google Scholar]
- Izotov, Y. I., Guseva, N. G., Fricke, K. J., & Henkel, C. 2014, A&A, 561, A33 [NASA ADS] [CrossRef] [EDP Sciences] [Google Scholar]
- Izotov, Y. I., Worseck, G., Schaerer, D., et al. 2021, MNRAS, 503, 1734 [NASA ADS] [CrossRef] [Google Scholar]
- Ji, X., Yan, R., Riffel, R., Drory, N., & Zhang, K. 2020, MNRAS, 496, 1262 [NASA ADS] [CrossRef] [Google Scholar]
- Kaaret, P., & Corbel, S. 2009, ApJ, 697, 950 [NASA ADS] [CrossRef] [Google Scholar]
- Kaaret, P., Feng, H., & Roberts, T. P. 2017, ARA&A, 55, 303 [Google Scholar]
- Kehrig, C., Guerrero, M. A., Vílchez, J. M., & Ramos-Larios, G. 2021, ApJ, 908, L54 [NASA ADS] [CrossRef] [Google Scholar]
- Kennicutt, R. C., Jr. 1998, ARA&A, 36, 189 [Google Scholar]
- Kewley, L. J., Groves, B., Kauffmann, G., & Heckman, T. 2006, MNRAS, 372, 961 [Google Scholar]
- Kovlakas, K., Zezas, A., Andrews, J. J., et al. 2020, MNRAS, 498, 4790 [Google Scholar]
- Laird, E. S., Nandra, K., Adelberger, K. L., Steidel, C. C., & Reddy, N. A. 2005, MNRAS, 359, 47 [NASA ADS] [CrossRef] [Google Scholar]
- Lebouteiller, V., Péquignot, D., Cormier, D., et al. 2017, A&A, 602, A45 [NASA ADS] [CrossRef] [EDP Sciences] [Google Scholar]
- Le Fèvre, O., Lemaux, B. C., Nakajima, K., et al. 2019, A&A, 625, A51 [NASA ADS] [CrossRef] [EDP Sciences] [Google Scholar]
- Lehmann, I., Becker, T., Fabrika, S., et al. 2005, A&A, 431, 847 [NASA ADS] [CrossRef] [EDP Sciences] [Google Scholar]
- Lehmer, B. D., Basu-Zych, A. R., Mineo, S., et al. 2016, ApJ, 825, 7 [Google Scholar]
- Lehmer, B. D., Eufrasio, R. T., Basu-Zych, A., et al. 2021, ApJ, 907, 17 [NASA ADS] [CrossRef] [Google Scholar]
- Liu, J.-F., Bai, Y., Wang, S., et al. 2015, Nature, 528, 108 [NASA ADS] [CrossRef] [Google Scholar]
- López, K. M., Jonker, P. G., Heida, M., et al. 2019, MNRAS, 489, 1249 [CrossRef] [Google Scholar]
- Madau, P., & Fragos, T. 2017, ApJ, 840, 39 [Google Scholar]
- Maggi, P., Hou, X., & Pakull, M. 2011, in The X-ray Universe 2011, eds. J. U. Ness, & M. Ehle, 247 [Google Scholar]
- Makishima, K., Kubota, A., Mizuno, T., et al. 2000, ApJ, 535, 632 [NASA ADS] [CrossRef] [Google Scholar]
- Middleton, M. J., Roberts, T. P., Done, C., & Jackson, F. E. 2011, MNRAS, 411, 644 [NASA ADS] [CrossRef] [Google Scholar]
- Miller, N. A., Mushotzky, R. F., & Neff, S. G. 2005, ApJ, 623, L109 [NASA ADS] [CrossRef] [Google Scholar]
- Mineo, S., Gilfanov, M., & Sunyaev, R. 2012, MNRAS, 426, 1870 [NASA ADS] [CrossRef] [Google Scholar]
- Mineo, S., Gilfanov, M., Lehmer, B. D., Morrison, G. E., & Sunyaev, R. 2014, MNRAS, 437, 1698 [NASA ADS] [CrossRef] [Google Scholar]
- Mitsuda, K., Inoue, H., Koyama, K., et al. 1984, PASJ, 36, 741 [NASA ADS] [Google Scholar]
- Moon, D.-S., Harrison, F. A., Cenko, S. B., & Shariff, J. A. 2011, ApJ, 731, L32 [NASA ADS] [CrossRef] [Google Scholar]
- Nakajima, K., Schaerer, D., Le Fèvre, O., et al. 2018, A&A, 612, A94 [NASA ADS] [CrossRef] [EDP Sciences] [Google Scholar]
- Nanayakkara, T., Brinchmann, J., Boogaard, L., et al. 2019, A&A, 624, A89 [NASA ADS] [CrossRef] [EDP Sciences] [Google Scholar]
- Oskinova, L. M., Bik, A., Mas-Hesse, J. M., et al. 2019, A&A, 627, A63 [NASA ADS] [CrossRef] [EDP Sciences] [Google Scholar]
- Pakull, M. W., & Angebault, L. P. 1986, Nature, 322, 511 [CrossRef] [Google Scholar]
- Pakull, M. W., & Mirioni, L. 2002, ArXiv e-prints [arXiv:astro-ph/0202488] [Google Scholar]
- Pakull, M. W., & Mirioni, L. 2003, in Revista Mexicana de Astronomia y Astrofisica Conference Series, eds. J. Arthur, & W. J. Henney, 15, 197 [NASA ADS] [Google Scholar]
- Pakull, M. W., Soria, R., & Motch, C. 2010, Nature, 466, 209 [Google Scholar]
- Pérez-Montero, E., Kehrig, C., Vílchez, J. M., et al. 2020, A&A, 643, A80 [NASA ADS] [CrossRef] [EDP Sciences] [Google Scholar]
- Pintore, F., & Mereghetti, S. 2016, MNRAS, 460, 1033 [NASA ADS] [CrossRef] [Google Scholar]
- Plat, A., Charlot, S., Bruzual, G., et al. 2019, MNRAS, 490, 978 [Google Scholar]
- Poutanen, J., & Svensson, R. 1996, ApJ, 470, 249 [CrossRef] [Google Scholar]
- Raiter, A., Schaerer, D., & Fosbury, R. A. E. 2010, A&A, 523, A64 [NASA ADS] [CrossRef] [EDP Sciences] [Google Scholar]
- Ramambason, L., Schaerer, D., Stasińska, G., et al. 2020, A&A, 644, A21 [NASA ADS] [CrossRef] [EDP Sciences] [Google Scholar]
- Ranalli, P., Comastri, A., & Setti, G. 2003, A&A, 399, 39 [NASA ADS] [CrossRef] [EDP Sciences] [Google Scholar]
- Rickards Vaught, R. J., Sandstrom, K. M., & Hunt, L. K. 2021, ApJ, 911, L17 [NASA ADS] [CrossRef] [Google Scholar]
- Saxena, A., Pentericci, L., Mirabelli, M., et al. 2020a, A&A, 636, A47 [NASA ADS] [CrossRef] [EDP Sciences] [Google Scholar]
- Saxena, A., Pentericci, L., Schaerer, D., et al. 2020b, MNRAS, 496, 3796 [Google Scholar]
- Schaerer, D. 1996, ApJ, 467, L17 [NASA ADS] [CrossRef] [Google Scholar]
- Schaerer, D., & Stasińska, G. 1999, A&A, 345, L17 [NASA ADS] [Google Scholar]
- Schaerer, D., Fragos, T., & Izotov, Y. I. 2019, A&A, 622, L10 [NASA ADS] [CrossRef] [EDP Sciences] [Google Scholar]
- Schaerer, D., Izotov, Y., & Fragos, T. 2020, Proc. Int. Astron. Union, 15, 79 [Google Scholar]
- Schmidt, K. B., Huang, K.-H., Treu, T., et al. 2017, ApJ, 839, 17 [NASA ADS] [CrossRef] [Google Scholar]
- Schmidt, K. B., Kerutt, J., Wisotzki, L., et al. 2021, A&A, 654, A80 [NASA ADS] [CrossRef] [EDP Sciences] [Google Scholar]
- Senchyna, P., Stark, D. P., Vidal-García, A., et al. 2017, MNRAS, 472, 2608 [NASA ADS] [CrossRef] [Google Scholar]
- Senchyna, P., Stark, D. P., Mirocha, J., et al. 2020, MNRAS, 494, 941 [CrossRef] [Google Scholar]
- Shirazi, M., & Brinchmann, J. 2012, MNRAS, 421, 1043 [NASA ADS] [CrossRef] [Google Scholar]
- Siana, B., Shapley, A. E., Kulas, K. R., et al. 2015, ApJ, 804, 17 [NASA ADS] [CrossRef] [Google Scholar]
- Sobral, D., Matthee, J., Darvish, B., et al. 2015, ApJ, 808, 139 [Google Scholar]
- Stanway, E. R., & Eldridge, J. J. 2019, A&A, 621, A105 [NASA ADS] [CrossRef] [EDP Sciences] [Google Scholar]
- Stark, D. P. 2016, ARA&A, 54, 761 [Google Scholar]
- Stark, D. P., Walth, G., Charlot, S., et al. 2015, MNRAS, 454, 1393 [Google Scholar]
- Stasińska, G., & Tylenda, R. 1986, A&A, 155, 137 [NASA ADS] [Google Scholar]
- Stasińska, G., Izotov, Y., Morisset, C., & Guseva, N. 2015, A&A, 576, A83 [NASA ADS] [CrossRef] [EDP Sciences] [Google Scholar]
- Steidel, C. C., Strom, A. L., Pettini, M., et al. 2016, ApJ, 826, 159 [NASA ADS] [CrossRef] [Google Scholar]
- Steidel, C. C., Bogosavljević, M., Shapley, A. E., et al. 2018, ApJ, 869, 123 [Google Scholar]
- Sturm, E., Lutz, D., Verma, A., et al. 2002, A&A, 393, 821 [NASA ADS] [CrossRef] [EDP Sciences] [Google Scholar]
- Sutton, A. D., Roberts, T. P., Gladstone, J. C., et al. 2013a, MNRAS, 434, 1702 [NASA ADS] [CrossRef] [Google Scholar]
- Sutton, A. D., Roberts, T. P., & Middleton, M. J. 2013b, MNRAS, 435, 1758 [NASA ADS] [CrossRef] [Google Scholar]
- Svoboda, J., Douna, V., Orlitová, I., & Ehle, M. 2019, ApJ, 880, 144 [NASA ADS] [CrossRef] [Google Scholar]
- Szécsi, D., Langer, N., Yoon, S.-C., et al. 2015, A&A, 581, A15 [NASA ADS] [CrossRef] [EDP Sciences] [Google Scholar]
- Tao, L., Kaaret, P., Feng, H., & Grisé, F. 2012, ApJ, 750, 110 [NASA ADS] [CrossRef] [Google Scholar]
- Thuan, T. X., & Izotov, Y. I. 2005, ApJS, 161, 240 [NASA ADS] [CrossRef] [Google Scholar]
- Titarchuk, L., Mastichiadis, A., & Kylafis, N. D. 1997, ApJ, 487, 834 [NASA ADS] [CrossRef] [Google Scholar]
- Urquhart, R., Soria, R., Johnston, H. M., et al. 2018, MNRAS, 475, 3561 [NASA ADS] [CrossRef] [Google Scholar]
- Urquhart, R., Soria, R., Pakull, M. W., et al. 2019, MNRAS, 482, 2389 [NASA ADS] [CrossRef] [Google Scholar]
- Vinokurov, A., Fabrika, S., & Atapin, K. 2018, ApJ, 854, 176 [NASA ADS] [CrossRef] [Google Scholar]
- Walton, D. J., Middleton, M. J., Rana, V., et al. 2015, ApJ, 806, 65 [Google Scholar]
Appendix A: Comparison of Cloudy predictions with Case B
To first order, assuming simple Case B recombination line emissivities, the relative line intensities of He II/Hβ are given by
 (A.1)
(A.1)
where Q0 and Q2 are the ionising photon fluxes for H and He+ respectively (i.e. above 13.6 and 54 eV), and A ≃ 1.74 for typical nebular conditions (Stasińska et al. 2015). In Fig. A.1, we compare the line ratio calculated from this simple analytic expression with the predictions from our Cloudy model grid. Overall, the scaling is as expected, and the models with a high ionisation parameter agree well with Eq. (A.1), except for very low values of He II λ4686/Hβ ≲ 3 × 10⁻³, which is below the current detection limit. For models with low U, we find a decrease in He II/Hβ, by up to a factor ∼2−3, which we attribute to the competition between H and He, discussed in earlier studies (e.g. Stasińska & Tylenda 1986; Raiter et al. 2010), and which cannot be captured by simple Case B theory. We also note that for the hardest SED (between 54 eV, the ionisation potential of He+, and the X-ray domain), Cloudy predicts a lower He II/Hβ intensity than naively expected from simple ionising-photon counting. This is most likely due to the fact only a fraction of photons with an energy > 54 eV have energies sufficiently close to the ionisation potential to be efficiently absorbed by He+, whose photoionisation cross section decreases with ν−3.
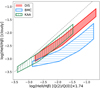 |
Fig. A.1. Percentages of HeII in relation to Hβ. The X-axis shows the analytical predictions based on the input spectra, where the factor 1.74 corresponds to typical nebular conditions. The dashed line shows a one-to-one relation between the predictions and the outputs. The upper and lower boundary for each model correspond to log U = −1.5 and log U = −3.5, respectively. |
All Tables
All Figures
|
Fig. 1. Basic SEDs used for the photoionisation models: The three ULX spectra (DIS, BMC, and KAA), normalised to the same X-ray luminosity LX, are shown by the red, blue, and green lines, respectively. For comparison the pure stellar SED, labelled STE and shown by the grey line, is scaled to our standard value of LX/SFR = 7.9 × 1039 erg s−1/(M⊙ yr−1); see text. The SED of I Zw 18 (LEB model) from Lebouteiller et al. (2017) is shown in yellow and scaled to the same stellar UV flux at ∼10 eV as STE, resulting in an LX higher by a factor ∼2.8 compared to the ULX spectra. The vertical dashed lines mark the ionisation potentials of hydrogen and helium (13.6 eV and 54 eV, respectively). The grey shaded area highlights the 0.5−8 keV range of the spectra used for LX. |
| In the text | |
|
Fig. 2. Metallicity histogram for the observational sample. In black we highlight the distribution of the He II emitters. The vertical dashed line shows our selected metallicity at 12 + log(O/H) = 8.1. |
| In the text | |
|
Fig. 3. Predicted relative emission line intensity ratios of nebular He II λ4686 (top) and [Ne V]λ3426 (bottom) as a function of LX/SFR for different SEDs. Each colour represents a different X-ray model. The horizontal grey area shows the typical range of the observed He II line intensity, when detected. The vertical dashed line indicates the LX/SFR value of our ‘base model’. The dispersion in each SED model is due to changes in the ionisation parameter. It can be seen that an increase in the X-ray component produces stronger He II emission, overlapping with the observational area for LX/SFR ≃ 1040 − 1041 erg s−1/(M⊙ yr−1), depending on the adopted ULX SED. For comparison, the value for the LEB models are overplotted, showing that the LEB SED can reproduce the observed He II strength. In approximately two-thirds of the galaxies, HeII emission is not detected with relative intensities below I(4686)/I(Hβ) ∼ (2−3) × 10−3. The models with LX/SFR < 1040 erg s−1/(M⊙ yr−1) do not produce significant [NeV] emission (i.e. I([NeV])/I(Hβ) < 10−4), and they are therefore not included. |
| In the text | |
|
Fig. 4. Emission line ratio diagrams for our models (log U and LX/SFR) for different SEDs compared to the observational sample. The left column shows high-ionisation emission line diagrams (see Stasińska et al. 2015), while the right column shows low-ionisation diagrams (BPT diagram; e.g., Kewley et al. 2006; Baldwin et al. 1981). The points within a same model show the outputs obtained for the base models and different ionisation parameters. The shaded and coloured areas show the range of emission line ratios covered by the DIS, BMC, and KAA models with varying X-ray luminosities and an ionisation parameter. The lines show the results for the same ionisation parameter for each model (from top to bottom, log U = −1.5, −2.0, −2.5, −3.0, −3.5) and increasing X-ray emission from left to right. For the stellar (STE) and the LEB SED, the X-ray luminosity is constant by construction (and LX = 0 for STE). The observational sample is shown by the grey symbols, where dots show the He II emitters and crosses the sources where He II is not detected. In approximately two-thirds of the galaxies, HeII emission is not detected with relative intensities below I(4686)/I(Hβ) ∼ (2−3) × 10−3. |
| In the text | |
|
Fig. 5. Relation between [OI]/[OIII] and HeII/Hβ for the DIS, BMC, and KAA models (shaded areas) along with the observational sample (dots). From top to bottom we show the increasing ionisation parameter (lines). In approximately two-thirds of the galaxies, HeII emission is not detected with relative intensities below I(4686)/I(Hβ) ∼ (2−3) × 10−3. |
| In the text | |
|
Fig. A.1. Percentages of HeII in relation to Hβ. The X-axis shows the analytical predictions based on the input spectra, where the factor 1.74 corresponds to typical nebular conditions. The dashed line shows a one-to-one relation between the predictions and the outputs. The upper and lower boundary for each model correspond to log U = −1.5 and log U = −3.5, respectively. |
| In the text | |
Current usage metrics show cumulative count of Article Views (full-text article views including HTML views, PDF and ePub downloads, according to the available data) and Abstracts Views on Vision4Press platform.
Data correspond to usage on the plateform after 2015. The current usage metrics is available 48-96 hours after online publication and is updated daily on week days.
Initial download of the metrics may take a while.