Fig. 1.
Download original image
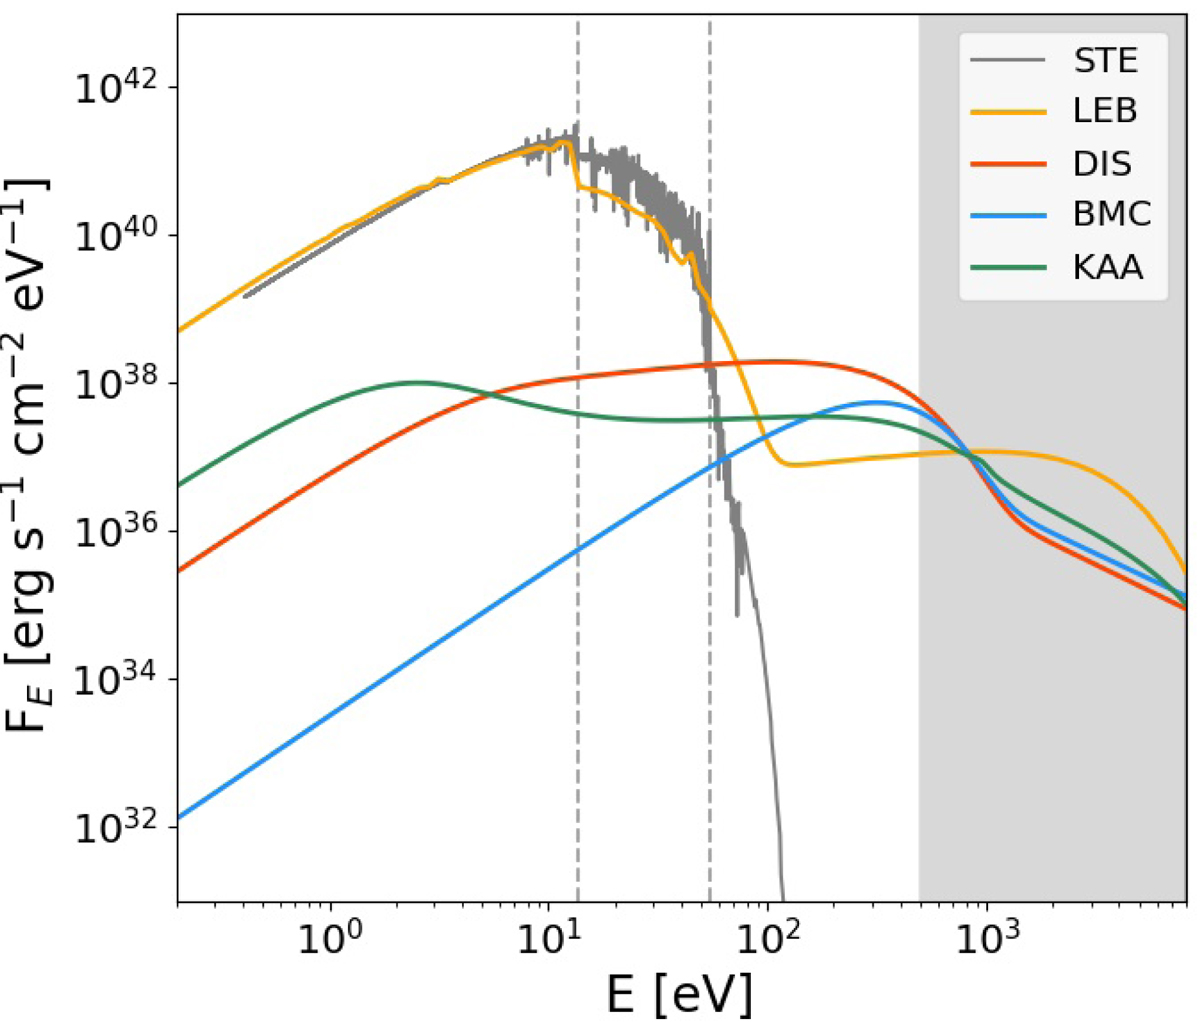
Basic SEDs used for the photoionisation models: The three ULX spectra (DIS, BMC, and KAA), normalised to the same X-ray luminosity LX, are shown by the red, blue, and green lines, respectively. For comparison the pure stellar SED, labelled STE and shown by the grey line, is scaled to our standard value of LX/SFR = 7.9 × 1039 erg s−1/(M⊙ yr−1); see text. The SED of I Zw 18 (LEB model) from Lebouteiller et al. (2017) is shown in yellow and scaled to the same stellar UV flux at ∼10 eV as STE, resulting in an LX higher by a factor ∼2.8 compared to the ULX spectra. The vertical dashed lines mark the ionisation potentials of hydrogen and helium (13.6 eV and 54 eV, respectively). The grey shaded area highlights the 0.5−8 keV range of the spectra used for LX.
Current usage metrics show cumulative count of Article Views (full-text article views including HTML views, PDF and ePub downloads, according to the available data) and Abstracts Views on Vision4Press platform.
Data correspond to usage on the plateform after 2015. The current usage metrics is available 48-96 hours after online publication and is updated daily on week days.
Initial download of the metrics may take a while.