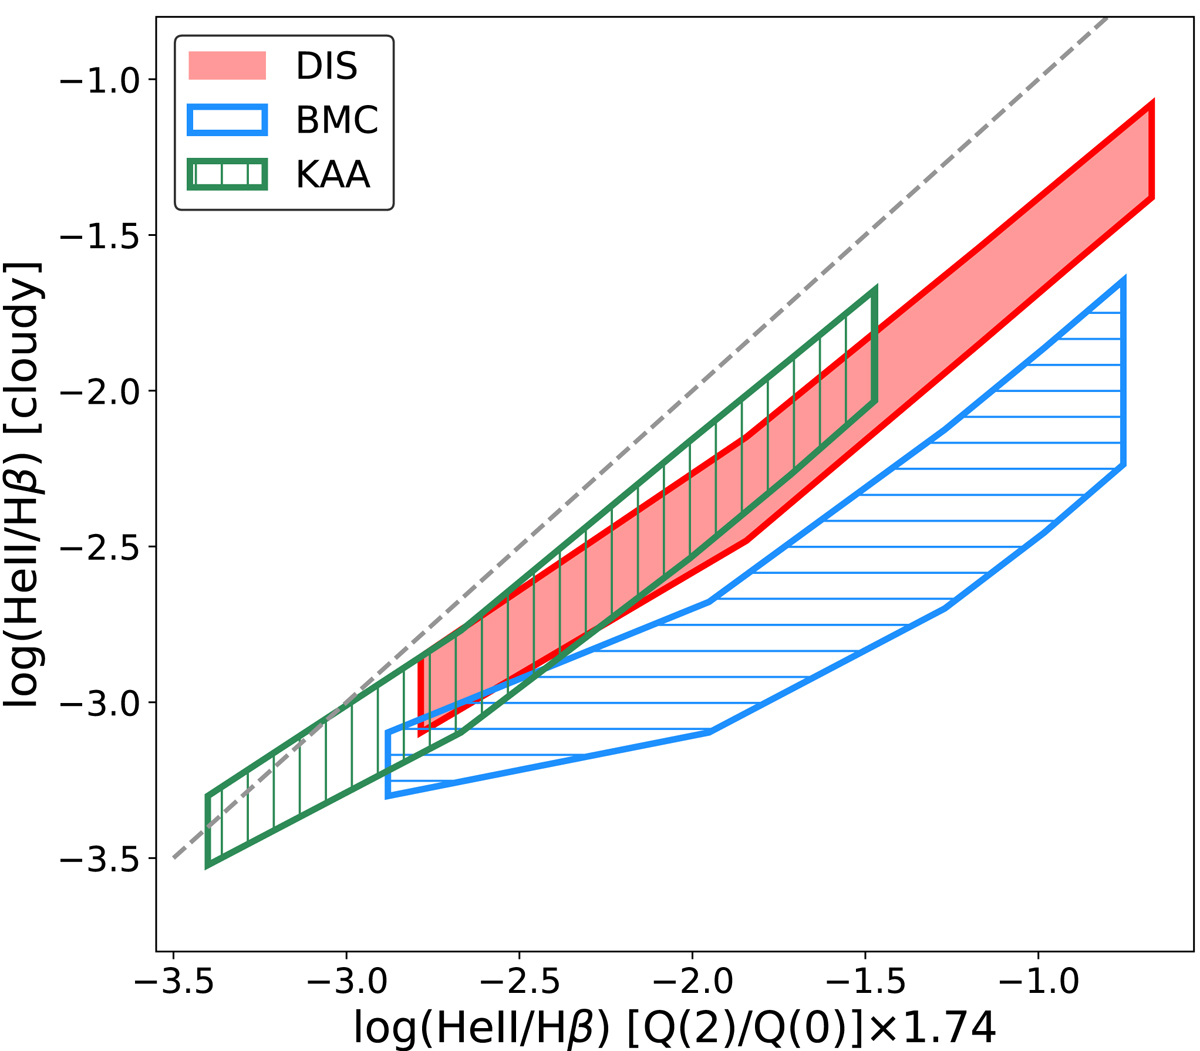
Fig. A.1.
Download original image
Percentages of HeII in relation to Hβ. The X-axis shows the analytical predictions based on the input spectra, where the factor 1.74 corresponds to typical nebular conditions. The dashed line shows a one-to-one relation between the predictions and the outputs. The upper and lower boundary for each model correspond to log U = −1.5 and log U = −3.5, respectively.
Current usage metrics show cumulative count of Article Views (full-text article views including HTML views, PDF and ePub downloads, according to the available data) and Abstracts Views on Vision4Press platform.
Data correspond to usage on the plateform after 2015. The current usage metrics is available 48-96 hours after online publication and is updated daily on week days.
Initial download of the metrics may take a while.