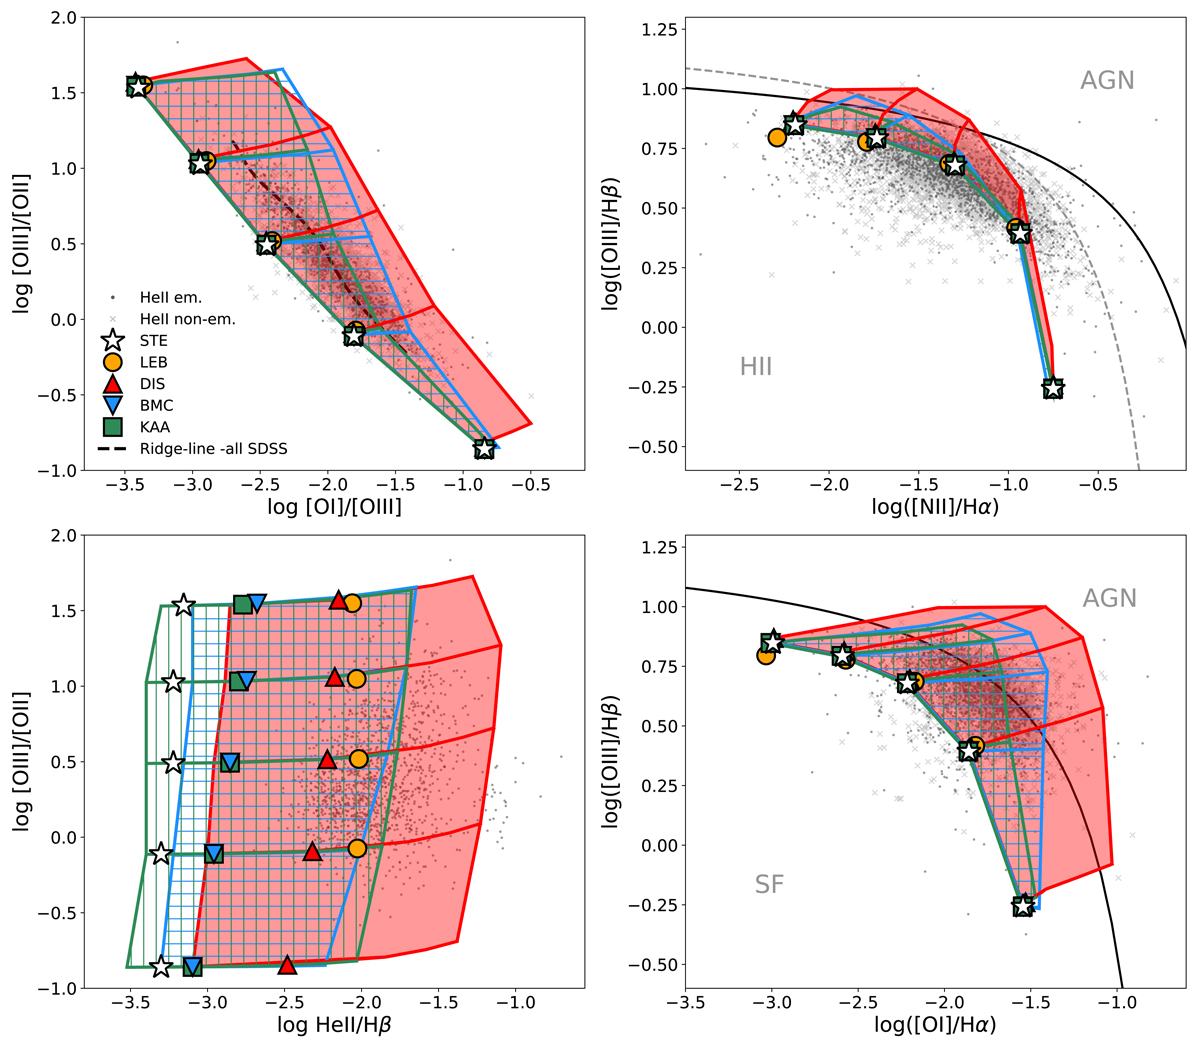
Fig. 4.
Download original image
Emission line ratio diagrams for our models (log U and LX/SFR) for different SEDs compared to the observational sample. The left column shows high-ionisation emission line diagrams (see Stasińska et al. 2015), while the right column shows low-ionisation diagrams (BPT diagram; e.g., Kewley et al. 2006; Baldwin et al. 1981). The points within a same model show the outputs obtained for the base models and different ionisation parameters. The shaded and coloured areas show the range of emission line ratios covered by the DIS, BMC, and KAA models with varying X-ray luminosities and an ionisation parameter. The lines show the results for the same ionisation parameter for each model (from top to bottom, log U = −1.5, −2.0, −2.5, −3.0, −3.5) and increasing X-ray emission from left to right. For the stellar (STE) and the LEB SED, the X-ray luminosity is constant by construction (and LX = 0 for STE). The observational sample is shown by the grey symbols, where dots show the He II emitters and crosses the sources where He II is not detected. In approximately two-thirds of the galaxies, HeII emission is not detected with relative intensities below I(4686)/I(Hβ) ∼ (2−3) × 10−3.
Current usage metrics show cumulative count of Article Views (full-text article views including HTML views, PDF and ePub downloads, according to the available data) and Abstracts Views on Vision4Press platform.
Data correspond to usage on the plateform after 2015. The current usage metrics is available 48-96 hours after online publication and is updated daily on week days.
Initial download of the metrics may take a while.