| Issue |
A&A
Volume 653, September 2021
|
|
|---|---|---|
| Article Number | A72 | |
| Number of page(s) | 17 | |
| Section | Galactic structure, stellar clusters and populations | |
| DOI | https://doi.org/10.1051/0004-6361/202141340 | |
| Published online | 09 September 2021 | |
The Gaia-ESO Survey: Galactic evolution of lithium from iDR6⋆,⋆⋆
1
INAF, Osservatorio di Astrofisica e Scienza dello Spazio, Via Gobetti 93/3, 40129 Bologna, Italy
e-mail: donatella.romano@inaf.it
2
INAF, Osservatorio Astrofisico di Arcetri, Largo E. Fermi 5, 50125 Firenze, Italy
3
Dipartimento di Fisica e Astronomia, Università degli Studi di Firenze, Via G. Sansone 1, 50019 Sesto Fiorentino, Firenze, Italy
4
GEPI, Observatoire de Paris, Université PSL, CNRS, Place Jules Janssen, 92190 Meudon, France
5
Astrophysics Group, Keele University, Keele, Staffordshire ST5 5BG, UK
6
Dipartimento di Fisica, Sezione di Astronomia, Università di Trieste, Via Tiepolo 11, 34131 Trieste, Italy
7
INAF, Osservatorio Astronomico di Trieste, Via Tiepolo 11, 34131 Trieste, Italy
8
INFN, Sezione di Trieste, Via Valerio 2, 34127 Trieste, Italy
9
INAF, Osservatorio Astronomico di Padova, Vicolo dell’Osservatorio 5, 35122 Padova, Italy
10
Leibniz-Institut für Astrophysik Potsdam (AIP), An der Sternwarte 16, 14482 Potsdam, Germany
11
Dipartimento di Fisica e Astronomia, Università degli Studi di Bologna, Via Gobetti 93/2, 40129 Bologna, Italy
12
INAF, Osservatorio Astronomico di Roma, Via Frascati 33, 00077 Monte Porzio Catone, Roma, Italy
13
SISSA, Via Bonomea 265, 34136 Trieste, Italy
14
Lund Observatory, Department of Astronomy and Theoretical Physics, Box 43, 221 00 Lund, Sweden
15
Université Côte d’Azur, Observatoire de la Côte d’Azur, CNRS, Laboratoire Lagrange, Bd de l’Observatoire, CS 34229, 06304 Nice Cedex 4, France
16
Observational Astrophysics, Department of Physics and Astronomy, Uppsala University, Box 516, 751 20 Uppsala, Sweden
17
School of Physics, UNSW, Sydney, NSW 2052, Australia
18
Centre of Excellence for All-Sky Astrophysics in Three Dimensions (ASTRO 3D), Australia
19
Institute of Theoretical Physics and Astronomy, Vilnius University, Sauletekio Av. 3, 10257 Vilnius, Lithuania
20
Dipartimento di Fisica e Astronomia, Università di Padova, Vicolo dell’Osservatorio 3, 35122 Padova, Italy
21
Institute of Astronomy, University of Cambridge, Madingley Road, Cambridge CB3 0HA, UK
22
Núcleo de Astronomía, Facultad de Ingeniería, Universidad Diego Portales, Av. Ejército 441, Santiago, Chile
23
Space Science Data Center-ASI, Via del Politecnico SNC, 00133 Roma, Italy
24
Nicolaus Copernicus Astronomical Center, Polish Academy of Sciences, ul. Bartycka 18, 00-716 Warsaw, Poland
25
The Kavli Institute for Astronomy and Astrophysics at Peking University, 100871 Beijing, PR China
26
Departamento de Física de la Tierra y Astrofísica and IPARCOSUCM, Instituto de Física de Partículas y del Cosmos de la UCM, Facultad de Ciencias Físicas, Universidad Complutense de Madrid, 28040 Madrid, Spain
27
Departmento de Astrofísica, Centro de Astrobiología (INTA-CSIC), ESAC Campus, Camino Bajo del Castillo s/n, 28692 Villanueva de la Cañada, Madrid, Spain
28
INAF, Osservatorio Astronomico di Palermo, Piazza del Parlamento 1, 90134 Palermo, Italy
29
Max-Planck Institut für Astronomie, Königstuhl 17, 69117 Heidelberg, Germany
Received:
18
May
2021
Accepted:
18
June
2021
Context. After more than 50 years, astronomical research still struggles to reconstruct the history of lithium enrichment in the Galaxy and to establish the relative importance of the various 7Li sources in enriching the interstellar medium (ISM) with this fragile element.
Aims. To better trace the evolution of lithium in the Milky Way discs, we exploit the unique characteristics of a sample of open clusters (OCs) and field stars for which high-precision 7Li abundances and stellar parameters are homogeneously derived by the Gaia-ESO Survey (GES).
Methods. We derive possibly un-depleted 7Li abundances for 26 OCs and star forming regions with ages from young (∼3 Myr) to old (∼4.5 Gyr), spanning a large range of galactocentric distances, 5 < RGC/kpc < 15, which allows us to reconstruct the local late Galactic evolution of lithium as well as its current abundance gradient along the disc. Field stars are added to look further back in time and to constrain 7Li evolution in other Galactic components. The data are then compared to theoretical tracks from chemical evolution models that implement different 7Li forges.
Results. Thanks to the homogeneity of the GES analysis, we can combine the maximum average 7Li abundances derived for the clusters with 7Li measurements in field stars. We find that the upper envelope of the 7Li abundances measured in field stars of nearly solar metallicities (−0.3 < [Fe/H]/dex < +0.3) traces very well the level of lithium enrichment attained by the ISM as inferred from observations of cluster stars in the same metallicity range. We confirm previous findings that the abundance of 7Li in the solar neighbourhood does not decrease at super-solar metallicity. The comparison of the data with the chemical evolution model predictions favours a scenario in which the majority of the 7Li abundance in meteorites comes from novae. Current data also seem to suggest that the nova rate flattens out at later times. This requirement might have implications for the masses of the white dwarf nova progenitors and deserves further investigation. Neutrino-induced reactions taking place in core-collapse supernovae also produce some fresh lithium. This likely makes a negligible contribution to the meteoritic abundance, but could be responsible for a mild increase in the 7Li abundance in the ISM of low-metallicity systems that would counterbalance the astration processes.
Key words: Galaxy: abundances / Galaxy: evolution / Galaxy: stellar content / stars: abundances / open clusters and associations: general / nuclear reactions, nucleosynthesis, abundances
Full Tables 1 and 3 are only available at the CDS via anonymous ftp to cdsarc.u-strasbg.fr (130.79.128.5) or via http://cdsarc.u-strasbg.fr/viz-bin/cat/J/A+A/653/A72
© ESO 2021
1. Introduction
Of all the elements in the periodic table, the main isotope of lithium, 7Li, has without any doubt the most complex origin and evolution. Its nuclei were produced in significant amounts during Big Bang nucleosynthesis (BBN), 10% directly as 7Li in the first few minutes and 90% as 7Be that decayed to 7Li later on (Steigman 2007; Khatri & Sunyaev 2011; Fields et al. 2020). Thereafter, both spallation processes that take place in the interstellar medium (ISM) and nuclear burning in stars contribute to increase its abundance from the primordial value to that currently observed in meteorites and young T Tauri stars.
It is a little disconcerting that none of the proposed 7Li production channels have been firmly assessed yet. The factor of three difference between the primordial abundance of lithium predicted by the standard BBN (SBBN) theory assuming the Planck baryon density, A(Li) dex (Pitrou et al. 2018), and that inferred from observations of halo stars on the ‘Spite plateau’ that should not have depleted their 7Li, A(Li)
 dex (Spite & Spite 1982; Bonifacio & Molaro 1997; Sbordone et al. 2010), constitutes the well-known cosmological lithium problem and raises the question as to whether the BBN model (e.g., Coc et al. 2012; Goudelis et al. 2016; Hou et al. 2017; Luo et al. 2019; Clara & Martins 2020) or stellar physics (Michaud et al. 1984; Charbonnel & Primas 2005; Mucciarelli et al. 2012; Nordlander et al. 2012; Fu et al. 2015; Gao et al. 2020, and references therein) is to blame.
As 7Li enters the chemical composition of successive stellar generations, it is swiftly burned through 7Li(p, α)4He reactions already on the pre-main sequence wherever the temperature exceeds about 2.5 × 10⁶ K. For 7Li to be produced in stars, it is necessary that 7Be be formed first, at temperatures exceeding 4 × 10⁷ K. The newly formed 7Be must then be promptly carried by convection to cooler layers, where it decays to 7Li that is preserved and, eventually, ejected. This mechanism was first proposed by Cameron (1955) and Cameron & Fowler (1971) to explain the existence of Li-rich asymptotic giant branch (AGB) stars. Low-mass stars on the first ascent of the red giant branch (RGB) may also show enhanced lithium if some extra deep mixing is associated with the cool bottom processing (Sackmann & Boothroyd 1999). Although some Li-rich and very Li-rich giant stars do exist (Wallerstein & Sneden 1982; Ruchti et al. 2011; Silva Aguirre et al. 2014; Kirby et al. 2016; Smiljanic et al. 2018; Singh et al. 2019; Charbonnel et al. 2020; Deepak et al. 2020), low- and intermediate-mass stars are unlikely to contribute significantly to the 7Li enrichment on galactic scales (Ventura et al. 2000, 2020) unless some extreme assumptions are made on the effectiveness of mass loss along the giant branches that should be maximal exactly when the stars are Li-rich (Romano et al. 2001; Travaglio et al. 2001).
Things change if low- and intermediate-mass stars are hosted in cataclysmic variables. Classical nova explosions occur in these binary systems when the white dwarf (WD) primary accretes matter from a secondary star that overflows its Roche lobe. Once the temperature of the deepest layers accreted on top of the WD exceeds ∼7 × 10⁷ K, a thermonuclear runaway is initiated, which leads to an outburst that does not disrupt the WD. After the ejection of the envelope, which is enriched in rare isotopes, the process is re-initiated (José & Hernanz 2007, and references therein); on average, the typical nova experiences 104 outbursts during its lifetime (Bath & Shaviv 1978).
Although theoretical calculations of 7Li production during thermonuclear runaways demonstrated long ago that novae could be important contributors to the Galactic 7Li enrichment (Starrfield et al. 1978; D’Antona & Matteucci 1991), until very recently there was no observational evidence to support the theory. Izzo et al. (2015) and Tajitsu et al. (2015) first detected, respectively, the blueshifted Li Iλ 6708 Å line in the early spectra of nova V1369 Cen and strong Be II features in the spectra of nova V339 Del. As 7Be was detected in more objects (e.g., Selvelli et al. 2018; Molaro et al. 2020a), a discrepancy between the observational abundance estimates and theoretical predictions of nucleosynthesis models became apparent, with the former exceeding the latter by up to one order of magnitude. The reason for this may reside in the (wrong) assumption of equality between the relative fractions of the ions Be II/Be and Ca II/Ca in the nova ejecta (Chugai & Kudryashov 2020) and/or in an overly simplistic treatment of the complex structure of the ejecta itself (Shore & De Gennaro Aquino 2020). However, Denissenkov et al. (2021) show that an enhanced abundance of 4He in nova envelopes would push the 7Be abundance predicted by nova models closer to the observed values. From the above it seems evident that at present neither spectroscopic observations nor stellar models can provide us with a sound, quantitative estimate of 7Li production from nova systems.
The flux of neutrinos that emerges from the collapsing core of an exploding massive star is another trigger of 7Li synthesis (see Woosley et al. 1990, for the first realistic exploration of the ν-process in stars). Sieverding et al. (2018) have presented results for a grid of solar-metallicity models with stellar masses in the range 13−30 M⊙. Their models take into account up-to-date cross-sections for the neutrino-induced reactions and a more realistic treatment of the neutrino transport in supernova (SN) simulations that results in lower-energy spectra for all neutrino families. Due to the reduction in neutrino energies, the efficiency of the ν-process is diminished. Their 7Li yields range from 1 × 10⁻⁸ M⊙ to 2 × 10⁻⁸ M⊙, one order of magnitude lower than the older estimates by Woosley & Weaver (1995). However, the use of time-dependent neutrino emission spectra and neutrino oscillation and metallicity effects are expected to affect 7Li production in the ν-process, and larger yields could be obtained (Kusakabe et al. 2019; Sieverding et al. 2019). Spectroscopic observations of Li in SN remnants could establish the mechanism of 7Li production in massive stars. The only measurement of this kind we are aware of (Taylor et al. 2012) finds no evidence of 7Li synthesis by neutrino-induced spallation in core-collapse SNe. However, the absence of evidence is not evidence of absence; clearly, we need to probe many more diffuse molecular clouds near other SN remnants.
We conclude this roundup of 7Li factories by briefly reviewing another triplet of possible sources. First, high-energy Galactic cosmic ray (GCR) nuclei impacting stationary ISM atoms have been known for 50 years as 7Li sources (Reeves et al. 1970; Meneguzzi et al. 1971). However, they produce no more than 20−25% of the meteoritic 7Li abundance (see Romano et al. 2001; Prantzos 2012). Second, spallation in hot advection-dominated accretion flows can make quiescent soft X-ray transients quite efficient at producing 7Li (Yi & Narayan 1997; Fujimoto et al. 2008, and references therein). Yet, under reasonable hypotheses, the contribution from these objects to 7Li pollution on galactic scales turns out to be negligible (Romano et al. 2001). A similar conclusion is reached regarding the creation of lithium in flares of active stars (Kelly et al. 2020, and references therein).
The Galactic chemical evolution (GCE) models adopted in this work take all of the 7Li sources mentioned above, bar the last two, into account. The models predict the amount of lithium a star will be formed with at any given time for different Galactic components. The stellar abundance then falls over time, which makes the upper envelope of the lithium abundances measured in warm, dwarf stars the useful thing to measure (see below). The trends of A(Li) as functions of [Fe/H] and age predicted for solar neighbourhood stars are compared to spectroscopic data from the sixth internal data release (iDR6) of the Gaia-ESO Spectroscopic Survey1 (GES; Gilmore et al. 2012; Randich & Gilmore 2013). Moreover, we compare, for the first time, the theoretical A(Li) gradient to 7Li abundances measured in objects covering a large range of galactocentric distances. After Rebolo et al. (1988), it became common practice to assume that the upper envelope of the abundances of 7Li measured in warm, dwarf Galactic stars tracks the 7Li enrichment of the ISM fairly faithfully. In more recent years, the mean values of the highest 7Li abundances in bins of metallicity have been put forward as a more appropriate indicator (e.g., Lambert & Reddy 2004; Delgado Mena et al. 2015; Guiglion et al. 2016; Fu et al. 2018). It has also become clear that the mixing of different populations can lead to spurious trends; in particular, the effects of stellar radial migration must be taken into account (Guiglion et al. 2019). Finally, it has been shown that the trends of 7Li with metallicity, age, and galactocentric distance are best traced when considering cluster stars that have not undergone any depletion (see Randich et al. 2020).
This paper is organised as follows. Section 2 details the sample selection, 7Li abundance determination, and the kinematical and dynamical analysis. We introduce the adopted GCE model in Sect. 3. Section 4 describes the evolution of 7Li in the thick and thin discs emerging from the field and cluster star samples selected from GES iDR6. Lithium observations are compared to the predictions of chemical evolution models in Sect. 4 and further discussed in Sect. 5. Finally, in Sect. 6 we draw our conclusions.
2. Dataset
This study is based on the last internal data release of the GES. We take advantage of the 7Li abundances and stellar parameters homogeneously determined for pre-main-sequence, main-sequence, turn-off, and sub-giant stars observed with the multi-object optical fibre facility FLAMES (Fibre Large Array Multi Element Spectrograph; Pasquini et al. 2002) in the Milky Way field and in open clusters (OCs). In particular, regarding the determination of 7Li, OC stars were observed either with the Ultraviolet and Visual Echelle Spectrograph (UVES2) and the 580 setup or with GIRAFFE and the HR15N setup; both configurations include the lithium lines. The HR15N grating was not employed for observations of stars in GES field samples; however, targets observed in cluster fields that were later recognised as non-members may have their 7Li abundances derived from GIRAFFE spectra. Our GES iDR6 star sample was additionally cross-matched with the Gaia Early Data Release 3 (EDR3) catalogue (Gaia Collaboration 2016, 2021) to perform a full chemo-dynamical characterisation of the stars.
2.1. Lithium abundance determination and sample selection
One-dimensional (1D) local thermodynamical equilibrium (LTE) abundances of 7Li in GES iDR6 were obtained from equivalent width measurements of the Li Iλ 6708 Å spectral feature. The abundance derivation procedure (Franciosini et al., in prep.) involved the use of a new set of curves of growth specifically defined for the GES that relies on the grid of synthetic spectra described in Guiglion et al. (2016, see also de Laverny et al. 2012); for GIRAFFE spectra, where the lithium feature is blended with the nearby Fe Iλ 6707.4 Å line, a consistent correction was applied. Upper limits were derived when the line was not detectable; more specifically, the larger of the measured equivalent width and the associated uncertainty was assigned as upper limit when the line was not detected or barely visible.
We did not correct the 7Li abundances for 3D non-LTE effects, since they are almost negligible for the majority of the stars in our sample, barely reaching −0.1 dex for a handful of stars (see Magrini et al. 2021, their Figs. 1 and 2). According to recent work by Wang et al. (2021), a systematic −0.1 dex correction applies to metal-rich dwarfs with Teff between 5000 and 6500 K. The correction then decreases to zero between 6500 and 7000 K. For the coolest, metal-rich pre-main-sequence stars in clusters the corrections may be as severe as −0.3 dex, but these values are very uncertain, since they rely on extrapolations of extant grids.
The field stars used in the present paper were selected as: (i) field stars that are non-members of the old and intermediate-age OCs (age > 120 Myr), taking into account all stars not selected as member stars on the basis of their radial velocities from the GES, proper motions, and parallaxes from Gaia EDR3, and (ii) stars observed in the GES field samples, as indicated by the keywords GES_MW, GES_MW_BL, GES_K2, GES_CR in the field GES_FLD. We combined the two samples, applying a further selection on stellar parameter uncertainties (δ Teff < 100 K, δ log g < 0.2 dex, δ [Fe/H] < 0.15 dex) and including both stars with measured lithium abundances with error on A(Li) lower than 0.25 dex and upper limits. We cross-matched our catalogue with Gaia EDR3 and computed the stellar luminosities using the geometric distances from Bailer-Jones et al. (2021) and the G magnitudes of Gaia, converted into V magnitudes using the colours GBP and GRP, as stated in Magrini et al. (2021). To compute the bolometric magnitudes we used the bolometric corrections BC(K) tabulated by Alonso et al. (1999, their Table 5), which are based on V − K colours, and K magnitudes from 2MASS (Skrutskie et al. 2006).
After removing the giant stars from the sample, we were left with 6207 late-type stars with effective temperatures (Teff) in the range 5300−7000 K, surface gravities (log g) of 3.5 to 4.6 (in cgs units), and metallicities −1.5 < [Fe/H]/dex < +0.5, which were observed with either the FLAMES-UVES 580 setup at high resolution (R ≃ 47 000) or the FLAMES-GIRAFFE HR15N setup at medium resolution (R ≃ 19 000). To further improve the quality of the sample, we retained only the stars with the highest-quality spectra (i.e., signal-to-noise ratio S/N ≥ 50). This almost halved our working sample, which finally consists of 3210 stars. Stars with log g ≃ 3.5 dex may undergo the first dredge up and, thus, display lithium abundances lower than the initial value. Yet, our sample contains only 7 stars with 3.5 < log g < 3.7, which makes the exact log g cut rather irrelevant.
We estimated the age for each star of our working sample using the aussieq2 tool3 that is an extension of the qoyllur-quipu (q2) Python package (Ramírez et al. 2014). It calculates stellar ages (and masses) by isochrone fitting, starting from the stellar parameters (Teff, log g, and V magnitude) and a grid of isochrones, also taking into account the uncertainties on the stellar parameters. The difference between the observed parameters and the corresponding values in the model grid is used as a weight to calculate the probability distribution function; the most probable age, that is, the peak of the probability distribution, is obtained through a maximum likelihood calculation (see also Casali et al. 2020). For this work, we adopted the Yale-Potsdam Stellar Isochrones (YaPSI; Spada et al. 2017) and took the α-enhancement effects on the model atmospheres into account, following the procedure outlined in Casali et al. (2020, their Sect. 2.3).
The recommended GES iDR6 stellar parameters (from spectroscopy), lithium abundances and [α/Fe]4 ratios, along with their errors, for the selected stars are reported in Cols. 4 to 13 of Table 1. In general, within the GES collaboration the stellar spectra were processed by different analysis nodes, each adopting the same model atmospheres and line lists though (Heiter et al. 2015), which provided different measurements affected by different biases and random errors (Smiljanic et al. 2014). In order to homogenise the results, Gaia benchmark stars were used as reference objects to identify the bias function of each node. In GES iDR6, the errors provided by the various nodes were not used – the errors associated with the recommended values were mainly estimated as internal errors of the method. Lithium abundances, however, were determined only by the Arcetri analysis node (Franciosini et al., in prep.). For this element, the associated uncertainties were derived by combining in quadrature the uncertainties due to the errors on each stellar parameter and on the measured equivalent width (the latter obtained using the formula by Cayrel 1988). The ages and the galactocentric distances (computed as specified in Sect. 2.2) of objects in our well-controlled sample of Milky Way field stars are listed in the last three columns of Table 1.
Stellar parameters and lithium abundances of 3210 stars in the field, ordered by increasing age.
The field star sample was complemented with estimates of the average maximum 7Li abundance5 in selected OCs. Ages and distances of OC members are, in general, much more accurate than for isolated field stars. Moreover, young OCs did not have time to travel significantly away from their birthplaces. Therefore, their chemical composition is representative of the history of chemical enrichment of their environs. The GES iDR6 has delivered parameters and abundances for members of 87 OCs and star forming regions, including 20 objects for which spectra were retrieved from the ESO archive and 2 clusters used for calibration only (i.e., not overlapping with the science sample; see Pancino et al. 2017). For young clusters present in the previous internal data release of the survey (iDR5), GES spectroscopy and Gaia astrometry were combined to assign membership probabilities (see Jackson et al. 2020); targets with probability P > 0.9 were selected as cluster members. For a few young clusters not present in GES iDR5, the membership was established based only on radial velocity. For intermediate-age and old clusters, the members were selected as in Magrini et al. (2021), deriving first the peak and standard deviation of the radial velocity distribution and selecting objects within 2σ of the peak. Then, the average parallax and proper motion with the corresponding standard deviations were calculated for the selected objects and a 2σ clipping was applied. By using this method, we found an excellent agreement with the results of Cantat-Gaudin et al. (2020) for the clusters in common.
Following the criteria outlined by Randich et al. (2020) and briefly recalled below, we restricted our analysis to 26 clusters including one star forming region with age less than 5 Myr and several young OCs (age < 100 Myr), paying attention to select for each cluster only the members that suffered minimal lithium depletion, if any (see Table 2). In the first place, we selected very young clusters with 7Li detections in at least four to five members that supposedly reflect the original 7Li abundance of their parent clouds. Clusters younger than 100 Myr host pre-main-sequence or zero-age main-sequence stars that should not have depleted any 7Li. As a matter of fact, though, 7Li depletion may show up in cool members of clusters as young as ∼5 Myr (see e.g., Bouvier et al. 2016; Jeffries et al. 2021, and references therein). The average maximum 7Li abundance for the young clusters considered in this work was computed selecting only the stars that trace the upper envelope of the A(Li) versus Teff distributions, for GES clusters sampled well enough, which maximises our chances to recover the initial, un-depleted value. We added to this sample clusters in which stars on the blue (warm) side of the ‘lithium dip’ (Boesgaard & Tripicco 1986) were observed, either on the main sequence or after the turn-off, before surface dilution in connection with the first dredge-up starts. The only exception is NGC 2243 that, because of its older age (≃4.4 Gyr, all the other clusters being younger than 2 Gyr), is likely to display only a lower limit to the actual original value. With this caveat in mind, we retained this cluster to increase the statistics in the outer disc. The average maximum 7Li abundance, A(Li)max, along with the associated dispersion, the age, galactocentric distance and metallicity adopted for each cluster are listed in Table 2. The number of stars used to calculate A(Li)max and their Teff range are also given in Cols. 6 and 7. Notwithstanding the relative paucity of objects that passed our selection criteria (30% of all OCs in GES iDR6), we can still probe a wide galactocentric distance baseline, 5 < RGC/kpc < 15, which makes it possible to do a meaningful test of the predictions of the GCE model regarding the existence and extent of any 7Li gradient across the Milky Way disc.
Parameters and average maximum lithium abundance for the selected clusters, sorted by increasing age.
For most clusters in common, the average maximum 7Li abundances displayed in Table 2 differ slightly (see Fig. 1) from the corresponding values reported in Table 1 of Randich et al. (2020). This is mainly due to the improved abundance measurements in iDR6 with respect to the previous internal data release of the GES on which the work of Randich et al. (2020) is based, though in some cases the number of member stars with 7Li determinations used to compute the mean has been reduced. It is further noted that some very young clusters studied by Randich et al. (2020) – namely, NGC 6530, Trumpler 14, Chamaeleon I, and NGC 2264 – show a large scatter in their revised 7Li abundances, possibly due to stellar activity or accretion, while a few interesting objects included in iDR6 (e.g., NGC 6649 and NGC 6281) are still missing a clean membership analysis. These clusters are not part of the present study.
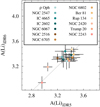 |
Fig. 1. Average maximum 7Li abundances from iDR6 (this work) and iDR5 (Randich et al. 2020) for the clusters in common. |
2.2. Kinematic and dynamical properties of OCs and field stars
We set the distance of the Sun from the Galactic centre to R0 = 8 kpc, its height above the plane to z0 = 0.025 kpc (Jurić et al. 2008; Bovy et al. 2012), and used the astrometric data from Gaia to transform the celestial coordinates of stars and OCs in our sample in galactocentric radius and height above the Galactic plane using astropy6 (Astropy Collaboration 2013). The radial velocities from GES iDR6 and parallaxes and proper motions from Gaia were used to obtain the orbital parameters and actions of clusters and field stars in our working sample with the galpy package7 (Bovy 2015). For the Milky Way’s gravitational potential, we assumed the code built-in model MWpotential2014. The local standard of rest (LSR) velocity was set to VLSR = 220 km s−1 (Bovy et al. 2012) and we assumed (U, V, W)⊙ = (11.1, 12.24, 7.25) km s−1 for the velocity of the Sun relative to the LSR (Schönrich et al. 2010). The orbital parameters of our sample clusters and stars that we exploit in Sect. 4.5 are listed in Table 3.
Orbital parameters for the selected clusters and field stars, sorted by increasing age.
3. Chemical evolution model
This section provides an overview of the adopted GCE model. More information can be found in the original papers.
3.1. General features
In order to study the evolution of lithium in the Milky Way, we adopted the ‘parallel GCE model’ presented by Grisoni et al. (2017, 2018). In the parallel model, the thick- and thin-disc components of our Galaxy are formed on different timescales out of two distinct episodes of infall of primordial gas and evolved independently from each other (see Ferrini et al. 1992; Chiappini 2009, for former approaches to the parallel galaxy formation scenario).
The contemporary evolution of the two components causes their stellar populations to overlap in a wide range of metallicities, while the less (more) efficient star formation assumed for the thin (thick) disc leads to distinct sequences of lower (higher) [α/Fe] ratios in the [α/Fe] versus [Fe/H] plane, as observed (see Grisoni et al. 2017, and references therein). The interested reader is referred to Grisoni et al. (2017, 2018) for a detailed description of the main assumptions and underlying equations of the model. In the following, we focus on the adopted nucleosynthesis prescriptions, with special emphasis on those for 7Li.
3.2. Nucleosynthesis prescriptions
The nucleosynthesis prescriptions are the same as model MWG-11 of Romano et al. (2019). For low- and intermediate-mass stars with initial masses in the range 1 ≤ m/M⊙ < 9, we adopted the yields by Ventura et al. (2013, 2020) that include a proper treatment of the super-AGB phase for the most massive AGB stars. For massive stars with 13 ≤ m/M⊙ ≤ 100, we adopted the yields by Limongi & Chieffi (2018). In particular, for [Fe/H] ≤ −1 dex we used their ‘set R’ (see the original paper for details) and assumed that all massive stars are fast rotators, whilst for [Fe/H] > −1 dex we used the yields from the non-rotating stellar models. With these choices we are able to fit the abundance measurements of several chemical elements in the solar neighbourhood as well as across the whole Milky Way disc (see Romano et al. 2019, 2020; Grisoni et al. 2020, and in prep.; Baratella et al. 2021). Thus, we believe that the adopted yield set provides a robust backbone for general GCE studies. Since the ν-process is not included in the computations of Limongi & Chieffi (2018), to take account of the effects of neutrino-induced nucleosynthesis on the evolution of 7Li in the Galaxy we resorted to the 7Li yields by Woosley & Weaver (1995)8. Following arguments by Duncan et al. (1997), we lowered the original yields by a factor of two (see discussion in Romano et al. 2001).
The stellar yields for type Ia SNe (exploding WDs in binary systems) were taken from Iwamoto et al. (1999, their model W7). Type Ia SNe are responsible for the bulk of Fe production at late times and dominate the decrease in the [α/Fe] ratio at high metallicities, but do not produce any 7Li. Classical novae, instead, are possibly important 7Li factories. The nova outburst rate was implemented in the parallel GCE code following the scheme outlined in Romano et al. (1999, see also D’Antona & Matteucci 1991; Matteucci et al. 1995). The fiducial model adopted in this work assumes that nearly 2% of all stars with initial mass in the range 1−8 M⊙ enter the formation of nova systems. Unless otherwise stated, the average 7Li production per nova outburst is set to  M⊙, consistent with the direct estimate of the 7Li yield from observations of nova V1369 Cen by Izzo et al. (2015) and with the results from some recent hydrodynamical simulations (Starrfield et al. 2020). When assuming that each nova system suffers 104 outbursts during its lifetime (Bath & Shaviv 1978), the above number translates into a total ejected mass of 7Li per nova of
  M⊙. We explore the effects of deviations from the main assumptions of this fiducial model in Sect. 4.4.
Cosmic-ray bombardment of the ISM also creates 7Li. The contribution of GCR spallation was taken into account by incorporating the absolute yields by Lemoine et al. (1998). We took the yields corresponding to the lower-bound spectrum in their Table 1. Alternatively, one could use empirical yields inferred from 9Be observations in stars to find similar results (see Grisoni et al. 2019, and references therein).
4. Results
In this section we exploit the GES iDR6 dataset presented in Sect. 2 and the GCE model introduced in Sect. 3 to study the evolution of lithium in the Milky Way. We first present the trends of A(Li) with stellar parameters for our sample of field stars, divided into inner disc, solar neighbourhood, and outer disc inhabitants according to their current positions along the disc. In Sect. 4.2, we focus on 7Li enrichment in the solar vicinity. Solar neighbourhood stars in our sample are separated into four distinct populations via chemical selection criteria and their properties are compared to the predictions of the parallel GCE model. We then extend our modelling to the whole Milky Way disc to investigate the Galactic 7Li gradient. Lastly, we use the Toomre diagram and a diagram of angular momentum, Lz, and square root of the radial action,  (see Feuillet et al. 2020), to assess the membership of the stars to the thick or thin discs on dynamical bases and to pinpoint possibly accreted stars. The lithium content of a few candidate accreted stars is discussed in comparison to the results of models that trace the evolution of 7Li in local dwarf galaxies (Matteucci et al. 2021).
4.1. Tracing the evolution of lithium in the Milky Way
Figures 2 and 3 show, respectively, the Teff versus age and Kiel diagrams for our selection of field stars with 7Li determinations from high-quality spectra (S/N ≥ 50) in GES iDR6 catalogue. In agreement with previous studies (see e.g., Bensby & Lind 2018, for recent work), we find that: (i) due to the weakness of the 7Li line, several high-temperature stars have only upper limits on their 7Li abundance; (ii) 7Li measurements in stars on the lower main sequence witness efficient lithium destruction in the deeper convective envelopes of the cooler stars; (iii) the highest 7Li abundances, A(Li) > 3.0 dex, are found in the upper main sequence and around the turn-off; (iv) in the lithium dip region, the stars span the full range of 7Li abundances, from the Spite plateau value to very close to the meteoritic one, with a few objects characterised by anomalously low lithium abundances; (v) the hotter the stars, the less we can go back in time. Referring to the last point, we note that our field star sample does not contain any objects younger than 1 Gyr, due to GES selection criteria (see also Thompson et al. 2018). We further remark that the ages of the cool stars are very uncertain, because of the fact that the isochrones tend to crowd together. However, this does not impact the present study, since we are mostly interested in the stars that potentially preserve their original 7Li and the cool stars are known to efficiently destroy it.
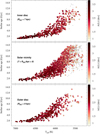 |
Fig. 2. Effective temperature versus stellar age diagrams for the GES iDR6 sample of field stars discussed in this paper, divided into inner disc (top panel, 619 stars), solar vicinity (middle panel, 2129 stars), and outer disc sub-samples (bottom panel, 462 stars). Stellar ages were determined from isochrone fitting using the aussieq2 code and YaPSI stellar models (Spada et al. 2017). Stars with lithium measurements are colour-coded according to their 7Li abundance. Grey dots represent upper limits. |
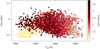 |
Fig. 3. Effective temperature versus gravity diagram for the full GES iDR6 sample of field stars discussed in this paper. Stars with lithium measurements are colour-coded according to their 7Li abundance. Grey dots represent upper limits. The approximate location of the 7Li dip region (see also Gao et al. 2020) is highlighted (yellow area). |
After careful scrutiny of Figs. 2 and 3, we are led to suggest that, among the field stars, only those with Teff ≥ 6800 − 6900 K can be safely used as tracers of 7Li evolution. Stars with 6500 < Teff/K < 6800 could still be employed, but one should consider their location in a Kiel diagram very carefully. Without a severe temperature cut, the commonly adopted approach of binning the data in metallicity to compute mean values of A(Li) for the stars with the highest 7Li abundances in each metallicity bin will lead to a spurious A(Li) versus [Fe/H] trend either way, with the computed values unavoidably reflecting stellar depletion to some extent (Anthony-Twarog et al. 2018). Our suggestion is consistent with the findings of Gao et al. (2020). These authors separate nearly 63 000 late-type stars with 7Li abundances obtained in the framework of the Galactic Archeology with HERMES (GALAH) survey into two groups – one on the warm side, the other on the cool side of the lithium dip – and analyse the behaviour of each group in the A(Li)–[Fe/H] plane. They suggest that the warm stars trace effectively the evolution of 7Li in the Galaxy, while the cool stars have burnt lithium to a large degree (see also Charbonnel et al. 2021).
In Fig. 4 we display the run of A(Li) with Teff for stars currently found in the solar neighbourhood. Our sample contains 1293 solar neighbourhood stars with 7Li measurements (for 836 targets we could only give upper limits) that belong to chemically distinct populations. We adopted the criteria presented in Recio-Blanco et al. (2014) and applied later to lithium studies in Guiglion et al. (2016, 2019) and identified 311 high-α stars, 524 low-α stars, a metal-rich α-rich population (also called mrαr, Adibekyan et al. 2011) consisting of 41 stars, and a super metal-rich solar-α population (61 objects)9. We did not classify 356 stars that lack simultaneous measurements of the elements used to define the [α/Fe] ratios in this work (Mg, Si, Ca, Ti; empty circles in Fig. 4). All the sub-populations are characterised by similar A(Li) spreads at a given temperature (when considering only the temperature range in which all populations are well sampled). In the range 5500 < Teff/K < 6300, the upper envelope of the 7Li abundances traced by the high-α stars lies systematically below that traced by the other components. If the high-α stars were all born in the thick-disc component, this could indicate that the thick disc attained a lower level of 7Li enrichment (see Guiglion et al. 2016; Grisoni et al. 2019). This conclusion is reinforced by an inspection of the A(Li) versus [Fe/H] diagram (see next section). We further note that there is a temperature threshold, Teff ≃ 6000 K, above which the stars with the highest 7Li abundances in our solar vicinity sample share the same (meteoritic) abundance; below such a threshold the abundance of lithium decreases steadily with decreasing temperature, as expected.
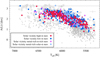 |
Fig. 4. Lithium abundance as a function of effective temperature for our sample of GES iDR6 field stars restricted to targets found in the solar neighbourhood (7 < RGC/kpc < 9). Both 7Li measurements (circles) and upper limits (grey dots) are reported. Whenever possible, high-α (red circles), low-α (blue), metal-rich α-rich (magenta), and super metal-rich solar-α stars (light blue) were identified according to their position in the [α/Fe]–[Fe/H] diagram, adopting the same criteria as Guiglion et al. (2016, 2019, see also Recio-Blanco et al. 2014). Empty circles represent stars without chemical identification. The grey lines show the 7Li content in meteorites (3.26 ± 0.05, Lodders et al. 2009). |
We also looked for possible correlations between 7Li abundance and rotation in our sample of field stars. Figure 5 shows the A(Li)–v sin i plane, where v sin i is the projected equatorial rotational velocity, for all the 3210 stars with high-quality 7Li abundances in our sample colour-coded in accordance with their effective temperature. Unsurprisingly, the hottest (more massive) stars in the sample have the highest rotational velocities. For v sin i > 30 km s−1, there is a spread of about 1 dex in 7Li abundances. The stars in this region of the diagram are all F-type stars; their atmospheres are expected to be mostly in radiative equilibrium and to show minimal convection effects. We interpret the observed spread as due to rotational mixing; the few F-type stars with low v sin i could have a low inclination angle. For v sin i ≤ 20 km s−1 a much larger spread in 7Li abundance is seen, driven by convection. The few stars with A(Li) abundances in excess of 3.4 dex are all relatively young (ages ∼ 1−2 Gyr) and located in the inner disc, where the GCE model predicts a current ISM 7Li abundance higher than in the solar neighbourhood. By sure, such stars reflect an evolutionary path different from that followed by solar neighbourhood stars (see Sect. 4.3); however, chemical separation may have changed their original composition. In particular, atomic diffusion could lower the surface 7Li abundance inherited at birth (Charbonnel et al. 2021). We note that the star with the highest 7Li abundance in our sample, A(Li) = 3.54 ± 0.06 dex, and with [Fe/H] = 0.05 ± 0.06 is relatively hot (Teff = 6670 ± 66 K) and has log g = 4.0 ± 0.17 dex, that is, it falls outside the Li-dip region according to Fig. 3. It also has a good S/N of 113 and v sin i = 117.4 ± 1.1, which enhances the chances that we are seeing its original lithium content unaltered by mixing processes. In fact, as discussed by Charbonnel et al. (2021), high rotation rates would counteract atomic diffusion. The information on stellar rotation is thus very useful in that it provides hints on the possible role played by internal 7Li depletion processes in warm, metal-rich main-sequence stars.
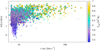 |
Fig. 5. Lithium abundance as a function of rotational velocity for the full field GES iDR6 stellar sample selected for this paper (3210 objects). The stars are colour-coded according to their effective temperature. Both 7Li measurements (circles) and upper limits (dots) are shown. Rotational velocities are measured from FLAMES-UVES spectra; typical errors on v sin i are ≤5 km s−1. |
4.2. Evolution of lithium in the solar vicinity
In this section, we focus on solar vicinity targets (i.e., clusters and stars with galactocentric distances 7 < RGC kpc−1 < 9). In Fig. 6 we compare the predictions of the parallel GCE model to 7Li abundances of field stars and to average maximum 7Li abundances of OCs selected from GES iDR6 (see Sect. 2). We assumed either the Spite plateau value, A(Li) dex, or the BBN-predicted value, A(Li)
 dex, as the initial 7Li abundance in the GCE model. The contributions to 7Li synthesis from RGB and AGB stars10, nova systems, and GCRs were included in all models, following the prescriptions outlined in Sect. 3.2. Lithium production through the ν-process in massive stars was also implemented in one case (pink curves in Fig. 6).
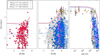 |
Fig. 6. Behaviour of A(Li) as a function of [Fe/H] (left and middle panels) and age (right panel) in the solar neighbourhood, for the thick- (left) and thin-disc components (middle and right panels). Lithium measurements for high- and low-α field stars in GES iDR6 are shown (red and blue circles, respectively), together with upper limits (grey dots). Cluster data are shown with brown shades for the younger clusters and yellow tones for the older ones. Only clusters and stars with 7 < RGC/kpc < 9 are considered for the comparison with the solar neighbourhood models. The meteoritic abundance from Lodders et al. (2009) is indicated with the multiplication sign. The predictions of the parallel GCE model are highlighted with different colours depending on the assumptions made about 7Li synthesis and cosmological lithium abundance. We also show data for metal-rich α-rich stars (magenta circles) and super metal-rich solar-α stars (light blue circles) found in the solar neighbourhood. These are not to be compared with the predictions of solar neighbourhood models and are used only for discussion purposes (see text). Empty circles are stars that lack an [α/Fe] determination in GES iDR6; we assign most of them to the thin-disc component, based on their kinematics (see Sect. 4.5). |
The evolution of the thick-disc component is shown in the left panel, where the x-axis reads, as usual, as a temporal axis. Because of the assumed fast evolution (see Grisoni et al. 2017), coupled to negligible production of 7Li from both massive AGB stars (Ventura et al. 2000, 2020) and GCRs (Romano et al. 2001; Prantzos 2012) at the relevant metallicities, the abundance of 7Li is predicted to remain almost flat during most of the thick-disc evolution (see also Guiglion et al. 2016; Grisoni et al. 2019). Actually, owing to the relatively high star formation efficiency, a mild decrease is expected due to stellar astration, until novae start releasing large amounts of 7Li through their outbursts, that is, ∼1 − 2 Gyr from the onset of star formation (see Romano et al. 1999, their Fig. 3). This decrease is prevented if another short-lived (but still controversial) 7Li factory is considered. The upper (pink) curve that does not bend downwards for −1 ≤ [Fe/H]/dex ≤ −0.5 refers to a model implementing the contribution from core-collapse SNe that produce 7Li in neutrino-induced reactions in the He and C shells (Domogatskii et al. 1978; Woosley et al. 1990). Starting from a primordial high 7Li abundance, in accordance with SBBN predictions, and considering all possible 7Li sources, the model reproduces reasonably well the upper envelope of the GES iDR6 7Li measurements for thick-disc members. On the contrary, a model starting from the Spite plateau value cannot explain the 7Li abundances measured in thick-disc stars in the metallicity range −0.8 ≤ [Fe/H]/dex ≤ −0.3. It should be noted, though, that candidate thick-disc stars were selected via chemical selection criteria (see Sect. 4.1). We will come back to this issue in Sect. 4.5. It is also worth noticing that, although the model attains ISM A(Li) values as high as ∼3.0 dex, very few stars form with these high 7Li abundances, because of the low-level star formation activity that characterises the thick disc during its latest evolutionary stages.
The middle panel of Fig. 6 is analogous to the left panel, but refers to the thin-disc component. The blue circles in this plot are stars that were assigned to the thin-disc component after a chemical selection based on their metallicities and [α/Fe] ratios. Metal-rich α-rich stars and super metal-rich solar-α stars found in the solar vicinity today (magenta and light blue circles, respectively) are likely migrating from inner Galactic regions (Guiglion et al. 2019, and references therein) and, as such, reflect different chemical enrichment paths. Therefore, one should not compare their abundances to the predictions of solar neighbourhood models (see also Guiglion et al. 2019). At variance with the results for the thick-disc component, none of our theoretical curves for the local thin disc is found to fold downwards in the A(Li)–[Fe/H] plane. This is due to the less efficient star formation assumed for the thin disc (see Grisoni et al. 2017) coupled to the continuous infall of gas of primordial chemical composition that replenishes the ISM with fresh 7Li on long timescales. Owing to the less efficient star formation and longer infall timescale, the ‘reverse knee’ indicating the onset of significant 7Li production from novae in the lithium tracks occurs at lower metallicities than in the thick disc, around [Fe/H] ≃ −0.7 dex or even lower, depending on the value assumed for A(Li)P. Again, the upper envelope of the observations is best explained by assuming A(Li) dex.
dex.
In recent years, high-resolution spectroscopic surveys have identified a decreasing trend of the lithium content in local field dwarfs at super-solar metallicities (Delgado Mena et al. 2015; Guiglion et al. 2016; Bensby & Lind 2018; Fu et al. 2018). Such a puzzling behaviour has called for some ad hoc reduction of the stellar yields or contamination from thick-disc stars (Prantzos et al. 2017). Alternatively, a drop in the nova outburst rate at high metallicities, which would lower the total lithium production from these binary systems (Fu et al. 2018; Grisoni et al. 2019), or radial migration, bringing relatively old and cool metal-rich thin-disc stars that have largely depleted their original 7Li from inner radii to the solar neighbourhood (Guiglion et al. 2019), have been suggested. Regarding the last point, we note that, indeed, the vast majority of the stars labelled as super metal-rich, solar-α stars in our sample are older than 3−4 Gyr and cooler than 6000 K (light blue circles in Fig. 6, right panel, and Fig. 4, respectively), which makes them highly susceptible to internal lithium destruction processes.
Randich et al. (2020), based on GES iDR5, have shown that the average maximum 7Li abundances of young, metal-rich OCs in the solar neighbourhood tend to cluster around the meteoritic value; the most metal-rich clusters found in the inner Galaxy display even higher abundances, A(Li) > 3.4 dex. We confirm those findings, which in turn support the conclusions of Anthony-Twarog et al. (2018) and Guiglion et al. (2019): the observed decrease in A(Li) for super-solar metallicities is not real, but caused by sample selection effects (see also Charbonnel et al. 2021). The lithium abundance in the local ISM traced by young OCs and warm field dwarfs in our sample is not decreasing; rather, it seems to flatten. However, we cannot exclude an increase in the last 4.5 Gyr, due to possible effects of atomic diffusion on warm, metal-rich F-type dwarfs that call for some caution when interpreting the metal-rich data (Charbonnel et al. 2021).
From the middle panel of Fig. 6 it appears also that the GCE model underestimates the 7Li content of the ISM in the −0.5 ≤ [Fe/H]/dex < 0.0 metallicity range. The culprit for this mismatch may be the simplifying hypotheses made to implement nova nucleosynthesis in the GCE code that lead to a monotonic increase in the 7Li abundance in time since the first novae start to pollute the ISM. A reduction of the nova outburst rate at high metallicities, as suggested by Fu et al. (2018) and Grisoni et al. (2019), may be needed (and is supported by independent observational evidence; see Gao et al. 2014, 2017; Yuan et al. 2015). A larger 7Li production (potentially from novae) in the metallicity range −0.5 ≤ [Fe/H] < 0.0 is, instead, necessary to fit the data. In order to better assess these points, we analyse the implications of a radial 7Li abundance gradient in the next section.
4.3. The Galactic lithium gradient
We followed the evolution of the abundance of 7Li in the ISM at different positions across the thin disc by using the prescriptions of model 1 IM B by Grisoni et al. (2018). This model assumes the inside-out scenario for disc formation (see Chiappini et al. 2001, and references therein) and a variable star formation efficiency along the disc. We refer the reader interested in details to the original publications. Here it will suffice to say that the model has been carefully calibrated against a set of tight observational constraints11, and that we did not make any attempt to fine-tune the model parameters in order to improve the agreement with the 7Li data. The ages of the OCs were taken from Cantat-Gaudin et al. (2020, see Table 2), while those of the field stars were estimated using the aussieq2 tool (see Sect. 2.1 and Casali et al. 2020). The galactocentric distances were homogeneously computed using astropy (see Sect. 2.2).
The theoretical gradients at different ages (now and 4.5 Gyr ago) are compared to the data in Fig. 7. The model used to compute the gradients starts from the SBBN-predicted primordial 7Li abundance and does not take lithium production from the ν-process into account. Unsurprisingly, the large majority of the field stars lie well below the model predictions. This can be readily understood as an age-temperature-rotation effect: only a minority of the stars in our sample, in fact, are relatively young (ages < 2 Gyr), have Teff in excess of 6800 K and display high rotation rates (see Figs. 2 and 5), which are the right characteristics to possibly show up as un-depleted stars (see Sect. 4.1; see also Gao et al. 2020; Charbonnel et al. 2021). The OCs span a much narrower age range, from 3 Myr to about 2 Gyr, with only one cluster (NGC 2243, at RGC = 11 kpc) being older than 4 Gyr. We retained this cluster to increase the statistics in the outer disc. Its average maximum lithium abundance was computed using 7 post turn-off members with Teff between 6064 K and 6314 K, in an effort to minimise the effects of 7Li depletion. This notwithstanding, NGC 2243 shows a 7Li abundance ∼0.2 − 0.25 dex lower than those of the other outer disc clusters. While the low 7Li content of NGC 2243 could be partly due to depletion as its stars are ageing, it could also be partly due to a lower initial 7Li abundance inherited from the ISM when the cluster formed 4.4 Gyr ago. Indeed, the GCE model predicts an increase of 0.3−0.1 dex in the ISM 7Li abundance across the disc in the last 4.5 Gyr (cf. the dashed and solid lines in Fig. 7). The metallicity of NGC 2243, [Fe/H] = −0.44 ± 0.05 dex, is lower than the solar one and lower (by ∼0.2 − 0.4 dex) than those of the other outer disc clusters, which would exclude an inner Galaxy origin and favour the evolutive picture.
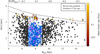 |
Fig. 7. Radial profiles of lithium abundance. The theoretical predictions refer to the gradient at the Sun’s birth (t = 9.2 Gyr, dotted curve) and at the current time (t = 13.7 Gyr, solid line). Data for our sample of GES iDR6 field stars, chemically separated into different sub-populations only in the solar neighbourhood region, are shown in different colours. Blue, magenta, and light blue circles identify, respectively, low-α, metal-rich α-rich, and metal-rich solar-α stars. Black circles refer to stars that inhabit either the inner or the outer disc. Average maximum 7Li abundances for 26 OCs selected from GES iDR6 are also displayed (small colour-coded circles). The meteoritic abundance from Lodders et al. (2009) is indicated with the multiplication sign. On the top x-axis we report the current metallicity of the ISM as predicted by the model at different radii. |
For RGC ≤ 10 kpc, OCs and warm field dwarfs trace the same 7Li abundance gradient. At larger galactocentric distances, the gradient seems to flatten according to the OC data, while A(Li) keeps decreasing in field stars, though it should be noted that the statistics in the outer disc are very poor. Taken at face value, the data seem to suggest that the observed gradient is flatter than the one predicted by our fiducial model. In particular, the data for the inner Galaxy (RGC ≤ 8 kpc) agree very well with the predictions of the model at 4.5 Gyr ago. A possible explanation is that high-metallicity clusters and field stars in the inner disc were born with a higher lithium abundance, perhaps not too far from that predicted by the model at the present time, A(Li) ≃ 3.5−3.8 dex, and show superficial abundances altered by depletion or atomic diffusion (see Charbonnel et al. 2021). Alternatively, we are seeing unaltered 7Li abundances and the resulting mild inner disc gradient points to the need for a reduction of lithium production at super-solar metallicities. This, in the framework of our model, can be interpreted as evidence in favour of the hypothesis that the nova outburst rate is reduced at high metallicities (Fu et al. 2018; Grisoni et al. 2019, and references therein). On the other hand, the predicted present-time gradient agrees very well with the OC data in the outer disc. These external regions have not reached solar metallicities yet and, as such, they have not entered the regime in which a downward correction of the nova outburst rate could be required. Thus, a model implementing a metallicity dependence of the nova progenitor formation rate, as proposed by Grisoni et al. (2019), offers a viable explanation for the whole set of homogeneous 7Li abundances examined in this paper. Another possible explanation is considered in the following paragraphs.
4.4. An alternative model
In our fiducial model, the star formation rate in the solar vicinity declines slowly in time after an early period of intense activity. The nova outburst rate, however, keeps always increasing mildly in time (see Romano et al. 1999, their Fig. 3), due to the contribution of the numerous lowest-mass stars (m ∼ 1 M⊙) that enter the formation of nova systems with lifetimes of the order of the age of the Universe (see e.g., Romano et al. 2005, their Fig. 3). If the impact of such long-lived stars is lowered, one can expect a nova outburst rate tracking more closely the star formation rate and, hence, a lower 7Li production at late times.
In Fig. 8, left panel, we show the effects of reducing the mass range of the primary stars that enter the formation of nova systems on the A(Li) versus [Fe/H] trend predicted for the local thin disc. The fiducial model, where the minimum mass of the stars entering nova systems is set to 1 M⊙, predicts the steepest increase in the lithium abundance from the SBBN-predicted value to the meteoritic one. As the minimum mass increases, the rise off the plateau is found to occur at lower metallicities and the late evolution is characterised by flatter slopes (thin lines from yellow to dark green in Fig. 8, left panel).
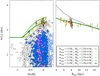 |
Fig. 8. Behaviour of A(Li) as a function of [Fe/H] in the local thin disc (RGC = 7 − 9 kpc, left panel) and as a function of the galactocentric distance at the present time (right panel). Lithium measurements for field low-α, mrαr, and super metal-rich solar-α stars from GES iDR6 are shown (blue, magenta, and light blue circles, respectively, left panel only) together with data for OCs colour-coded according to the cluster’s age (see the vertical bar on the right in Fig. 7). Only clusters with ages < 2 Gyr are shown. The predictions of our fiducial GCE model are shown as thick grey lines. The thin solid lines illustrate the effects of reducing the mass range of primary stars entering the formation of nova systems (left panel only) while keeping the predicted current nova outburst rate fixed. The thick green lines refer to a model in which the nova yield (i.e., the total amount of 7Li ejected by a typical nova during its lifetime, dubbed MLi in the legend) is also reduced. See text for details. |
All the models are calibrated to obtain the same current nova outburst rate (i.e., 17 events yr−1; Izzo et al. 2015, and references therein). This makes the revised models overestimate the 7Li abundance observed in meteorites. The thick green line in Fig. 8, left panel, shows the predictions of a model (hereinafter dubbed alternative model) where both the mass range of WD progenitors entering the formation of nova systems and the average 7Li yield per nova are reduced so as to optimally fit the local data within the errors. Of course, a strong degeneracy affects the relevant model parameters and the one proposed here is not a unique choice. A thorough investigation of the parameter space, however, is beyond the scope of the present study and is deferred to a future paper.
The right panel of Fig. 8 displays the present-day gradients of A(Li) across the Milky Way disc predicted by the fiducial and alternative models (grey and green thick lines, respectively), in comparison to our OC data excluding the sole cluster with age > 2 Gyr (NGC 2243). Lacking the contribution of the long-lived stars in the 1−3 M⊙ mass range, the alternative model predicts a gradient much flatter than that expected according to the fiducial model. This milder theoretical gradient agrees very well with the observed one traced by the average maximum 7Li abundances of the selected OCs (see Sect. 2.1), though one should always keep in mind the caveats spelled out in the previous sections. In particular: (i) the OC data include stars on the cool side of the Li dip, thus, it is possible that these have suffered some pre-main-sequence or main-sequence depletion (in which case the depletion is metallicity dependent); (ii) higher metallicity means a thicker sub-photospheric convection zone, hence, the OCs nearer the Galactic centre, being more metal-rich, may have depleted their Li from a higher level than the more metal-poor clusters further out in the disc and this would have the effect of flattening the initial gradient; (iii) the effects of atomic diffusion on the shape of the inner gradient still need to be clarified. Therefore, at present we cannot discard a steeper gradient – any lying in between the green and the grey curves in Fig. 8, right panel.
4.5. Sanity check on membership and accreted stars
In Sect. 4.1 we adopt the chemical selection criteria defined by Recio-Blanco et al. (2014) and used in lithium studies by Guiglion et al. (2016, 2019) and Fu et al. (2018) as an option to separate thick-disc stars (identified as high-α stars) from thin-disc ones (identified as low-α stars). The adoption of different selection criteria, however, leads to different samples of candidate thick- and thin-disc stars (e.g., Bensby et al. 2003, 2014; Franchini et al. 2020). In particular, with regard to 7Li evolution, Bensby & Lind (2018) caution that the chemical selection may cause a contamination of the thick-disc sample with thin-disc members, especially at higher metallicities, which may lead to a spurious trend of increasing 7Li abundance with metallicity for the thick disc.
In Fig. 9 we show the LSR-corrected (assuming VLSR = 220 km s−1) velocity components for our sub-sample of high-α stars in a Toomre diagram. If a kinematical selection is applied, only 25% of the high-α stars are classified as thick-disc members; in particular, the stars with the highest 7Li abundances are all thin-disc members (in agreement with the results of Bensby & Lind 2018, based on a different sample of stars). Moreover, if a cut in age is applied, so that only stars older than 8 Gyr are retained, no thick-disc stars are left in the diagram with A(Li) > 2.5 dex.
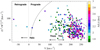 |
Fig. 9. Toomre diagram (LSR-corrected) for our sub-sample of high-α stars, colour-coded according to their 7Li abundance (see vertical bar on the right). Constant total space velocities with respect to the LSR of Vtot = 85 and 210 km s−1 are marked with dashed curves. Low-α, metal-rich α-rich, and super metal-rich solar-α stars (not shown to avoid overcrowding) are consistent with thin-disc kinematics. |
The velocity space is a useful tool to pinpoint the origin of stars, especially when coherent moving groups can be identified (see Helmi 2020, for a recent review). We find that our sample includes 3 retrograde (counter-rotating) halo stars. We analyse their position in a diagram of angular momentum Lz versus square root of radial action in Fig. 10. Feuillet et al. (2020) have pointed out that Gaia-Enceladus stars are found in a restricted region of this space,  /(kpc km s−1) ≤ 50 and −500 ≤ Lz/(kpc km s−1) ≤ 500 (clean sample); accreted stars may also be found at slightly lower
  values (sub-Gaia-Enceladus sample). One of our retrograde halo stars is marginally compatible with being a member of the latter sample. Clearly, a full chemical tagging may shed more light on an accreted origin of our retrograde stars, but this is beyond the scope of the present paper. We note, however, that all our retrograde stars have A(Li) values consistent with the Spite plateau level (see also Molaro et al. 2020b) and, hence, with no 7Li enrichment as expected for stars hosted in dwarf galaxies according to Matteucci et al. (2021). Those authors compute detailed chemical evolution models for several dwarf spheroidal and ultra-faint dwarf galaxies and show that, if most 7Li is forged in nova outbursts, as also assumed in this paper, its abundance in Milky Way dwarf satellites must lie flat at the Spite plateau level; only a few systems experiencing a more prolonged star formation activity may host relatively metal-rich stars that display higher lithium abundances.
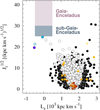 |
Fig. 10.
|

All our retrograde stars have Teff < 6000 K, namely, they fall on the cool side of the dip. Measurements of 7Li abundances in accreted stars on the warm side of the dip would be of the utmost importance to characterise the evolution of 7Li in their galactic progenitors, since they would possibly reflect un-depleted abundances. Such stars must be rare – because of stellar evolution effects combined with the expected old ages – but some relatively young objects gained through recent mergers could still be found in large spectroscopic surveys targeting larger stellar samples than GES, such as GALAH (De Silva et al. 2015), or WEAVE (Dalton et al. 2012) and 4MOST (de Jong et al. 2012) in the future.
5. Discussion
Nowadays large spectroscopic surveys can secure precise radial velocities and homogeneous abundances for light and heavy chemical elements, for as many as hundreds of thousands of stars. This information, coupled to accurate parallaxes and proper motions measured by the European Space Agency Gaia mission, provides unprecedented constraints to GCE models. In particular, when dealing with the Galactic evolution of lithium the powerfulness of modern surveys is apparent. We can now select stars that belong to different Galactic components and analyse how 7Li enrichment proceeded in different substructures, including regions of the disc located at different galactocentric distances to trace the gradient. We can exclude contaminants, such as stars that migrated from the inner disc, from local samples and get a cleaner picture of the evolutionary paths followed by coherent groups of stars, rather than being dealing with the superposition of different evolutionary sequences (see Guiglion et al. 2019, for a first discussion on this aspect). As regards this point, it is worth stressing that we identified inner disc intruders in our sub-sample of solar neighbourhood stars via chemical selection criteria and that we based our main conclusions on objects – both clusters and field stars – that are younger than 2 Gyr and, hence, did not travel significant distances across the disc (Anders et al. 2017; Casamiquela et al. 2017).
At present, the trends we see for 7Li abundance as a function of metallicity, age, and galactocentric distance are still hampered by several uncertainties. In most cases, 7Li abundances are computed using LTE plane-parallel atmospheres; non-LTE corrections calculated with 1D models are often applied, while 3D non-LTE corrections are considered rarely. High rotation rates may broaden the lines and lead to inaccurate results in case of automatic abundance derivation. The exact location of the lithium dip in dependence of stellar parameters such as age and metallicity is not well known and more OC studies are needed to sort out all the pieces (e.g., Anthony-Twarog et al. 2021; Randich & Magrini 2021, and references therein). Last in order of time, Charbonnel et al. (2021) warn that the effects of atomic diffusion in warm metal-rich stars deserve further analysis before we can draw any firm conclusion on the actual behaviour of A(Li) in the high-metallicity regime. This impacts both the local late Galactic evolution and the slope of the gradient in the inner disc.
However, the 7Li abundance measured in meteorites provides a good anchor for the models, as it has been ‘frozen’ since the time of the solar system formation 4.5 Gyr ago. Our GCE model, assuming that most lithium is produced in nova outbursts, can explain the meteoritic lithium abundance and, as we show in this paper, is able to reproduce either a flatter or a steeper A(Li) gradient, depending on the assumed mass range for the WD nova progenitors. Thus, determining the exact slope of the gradient is a crucial step towards a better understanding of lithium production on galactic scales.
Another important issue that has to be fixed is that of the actual nova outburst rate. Recently, De et al. (2021) have suggested that a large population of highly obscured novae have been systematically missed in optical searches. The current nova outburst rate would be 46.0 ± 12.5 events yr−1, larger than the estimate of 17 events yr−1 assumed in this work (see also Izzo et al. 2015). This would point to a lower average 7Li yield from novae, in better agreement with the results of the majority of hydrodynamical simulations of the outburst.
6. Conclusions
Using spectroscopic data from the last internal data release of the GES and astrometric information from Gaia EDR3, we have built a catalogue of 3210 stars in the Milky Way field that have (i) high-precision 1D LTE 7Li abundances or upper limits, (ii) homogeneous stellar parameters and (iii) [α/Fe] ratios (for a sub-sample of stars), (iv) stellar ages, (v) galactocentric distances, (vi) space velocity components, and (vii) orbital parameters. The field star sample is complemented with estimates of the average maximum 7Li abundances for 26 star forming regions and OCs for which GES iDR6 delivers homogeneous stellar parameters and abundances of confirmed members. All clusters, bar one, have ages < 2 Gyr. After a careful inspection of the data, we conclude that:
-
In the metallicity range −0.3 < [Fe/H]/dex < +0.3, where our GES iDR6 field and OC samples overlap, field and cluster pre-main-sequence, main-sequence, and turn-off stars trace the same evolution of lithium. This is due to the fact that the last internal data release of the GES includes field stars with ages in the range 1−2 Gyr that were absent in previous releases of the survey (see Thompson et al. 2018). If only field stars older than 2 Gyr are considered, the average maximum 7Li abundances estimated for the OCs lie systematically above the upper envelope of the field star measurements. Field stars older than 2 Gyr, in fact, fall in the lithium dip region or on the cool side of the dip, where their 7Li abundances can be affected by various degrees of depletion.
-
The average maximum 7Li abundances of most OCs agree well with the abundance of lithium measured in meteorites that have not suffered any depletion.
-
Our OC sample spans a wide range of galactocentric distances, 5 ≤ RGC kpc−1 < 15. The current 7Li gradient traced by OCs is a mild one, ranging from A(Li) ∼ 3.4 dex in the inner Galaxy to A(Li) ∼ 3.1 dex in the outer disc. This gradient is also supported by observations of warm field stars. It is unclear at present whether atomic diffusion or other effects steepen the gradient in the inner Galaxy.
-
We have discovered three counter-rotating stars in our field star sample that may be accreted stars. Their 7Li abundances are consistent with the Spite plateau value, A(Li)
 (Sbordone et al. 2010).
Recently, Grisoni et al. (2019) applied the parallel GCE model to the study of the evolution of 7Li in the Galactic thick and thin discs. However, their analysis was limited to the solar vicinity. Here, we take advantage of the homogeneous dataset secured by GES iDR6 for field and OC stars to better assess the evolution of the abundance of 7Li at high metallicities in the solar neighbourhood, as well as its gradient across the Milky Way disc. We run a fiducial model, where nearly 2% of the stars with initial mass in the range 1−8 M⊙ enter the formation of nova systems as primary stars, and each nova is assumed to eject  during its lifetime (Romano et al. 1999; Izzo et al. 2015). We also run an alternate model, where 16% of the stars in the 3−8 M⊙ mass range are primary stars in binary systems that give rise to nova outbursts, and the average mass of 7Li ejected in total by each nova is
  . We find that:
-
The fiducial model underestimates the upper envelope of the observations as traced by both warm field stars and OCs in the solar neighbourhood, except for the super-solar metallicity regime, where the 7Li abundances could be slightly overestimated. The fiducial model also seems to predict a present-time gradient steeper than the observed one. However, Charbonnel et al. (2021) caution that the possible effects of atomic diffusion on warm stars tracing the high-metallicity trends have not yet been fully understood. These could reconcile the model predictions with the observations.
-
The alternative model fits (by construction) the upper envelope of the local data in a A(Li)–[Fe/H] plane and the current gradient along the disc.
-
A model in which most 7Li comes from nova outbursts explains the evolution of this fragile element well. However, the parameters introduced to implement the nova nucleosynthesis are highly degenerate and the proposed best-fitting model is, thus, not necessarily unique.
More data are needed to probe if novae are the main lithium factories and to assess whether their rate flattens out at late times. This latter requirement, in particular, might have implications for the masses of the WD nova progenitors, and it deserves further theoretical investigation. At present, stellar yields of single low-, intermediate-, and high-mass stars are too low for these stars to contribute sensibly to the evolution of 7Li on galactic scales, apart perhaps from some contribution from the ν-process in massive stars that would counterbalance the effects of stellar astration during early Galactic evolution. We also need to better understand the mechanisms of lithium depletion in stars and their dependences on stellar mass, metallicity, and other parameters, such as rotation. There is a long way to go, but it is certainly worthwhile.
See Smiljanic et al. (2014) and Lanzafame et al. (2015) for a complete description of the analysis of the FLAMES-UVES spectra of, respectively, FGK and pre-main-sequence stars in the GES.
Although other authors (e.g., Yoshida et al. 2008; Sieverding et al. 2018, 2019; Kusakabe et al. 2019) provide up-to-date estimates of the ν-process 7Li yield using cutting-edge SN explosion and SN neutrino models, as well as new cross-sections for the relevant reactions, the work by Woosley & Weaver (1995) remains the only one to offer a grid of yields that span a range of stellar masses and metallicities adequate for use in GCE studies.
Possible production or destruction of 7Li due to extra mixing processes, such as thermohaline mixing in low-mass, bright RGB stars and stellar rotation (Charbonnel et al. 2020), are not included in the adopted stellar models and yields (Ventura et al. 2013, 2020).
These include the present-time gradients of several chemical elements along the disc and their evolution, as well as the radial profiles of gas, stars, and star formation rate (see Chiappini et al. 2001, for a detailed discussion).
Acknowledgments
This work is based on data products from observations made with ESO Telescopes at the La Silla Paranal Observatory under programme IDs 188.B-3002, 193.B-0936, and 197.B-1074. These data products have been processed by the Cambridge Astronomy Survey Unit (CASU) at the Institute of Astronomy, University of Cambridge, and by the FLAMES/UVES reduction team at INAF, Osservatorio Astrofisico di Arcetri. These data have been obtained from the Gaia-ESO Survey Data Archive, prepared and hosted by the Wide Field Astronomy Unit, Institute for Astronomy, University of Edinburgh, which is funded by the UK Science and Technology Facilities Council. This work was partly supported by the European Union FP7 programme through ERC grant number 320360 and by the Leverhulme Trust through grant RPG-2012-541. We acknowledge the support from INAF and from the Italian Ministry of Education, University and Research (Ministero dell’Istruzione, dell’Università e della Ricerca, MIUR) in the form of the grant Premiale VLT 2012. The results presented here benefit from discussions held during the Gaia-ESO workshops and conferences supported by the ESF (European Science Foundation) through the GREAT Research Network Programme. This work has made use of data from the European Space Agency (ESA) mission Gaia (https://www.cosmos.esa.int/gaia), processed by the Gaia Data Processing and Analysis Consortium (DPAC, https://www.cosmos.esa.int/web/gaia/dpac/consortium). Funding for the DPAC has been provided by national institutions, in particular the institutions participating in the Gaia Multilateral Agreement. LM, SR, GCas and AB acknowledge funding from MIUR Premiale 2016 MITiC. PB acknowledges support from the French National Research Agency (ANR) funded project “Pristine” (ANR-18-CE31-0017). VG acknowledges financial support at SISSA from the European Social Fund operational Programme 2014/2020 of the autonomous region Friuli Venezia Giulia. TB was funded by grant No. 2018-04857 from The Swedish Research Council. AJK acknowledges support from the Swedish National Space Agency (SNSA/Rymdstyrelsen). SLM is supported by funding from the Australian Research Council via Discovery Project DP180101791 and from the UNSW Scientia Fellowship program. FJE acknowledges financial support from the Spanish MINECO/FEDER through the grant AYA2017-84089 and MDM-2017-0737 at Centro de Astrobiología (CSIC-INTA), Unidad de Excelencia María de Maeztu, and from the European Union’s Horizon 2020 research and innovation programme under Grant Agreement No. 824064 through the ESCAPE – The European Science Cluster of Astronomy and Particle Physics ESFRI Research Infrastructures project.
References
- Adibekyan, V. Z., Santos, N. C., Sousa, S. G., & Israelian, G. 2011, A&A, 535, L11 [NASA ADS] [CrossRef] [EDP Sciences] [Google Scholar]
- Alonso, A., Arribas, S., & Martínez-Roger, C. 1999, A&AS, 140, 261 [NASA ADS] [CrossRef] [EDP Sciences] [Google Scholar]
- Anders, F., Chiappini, C., Rodrigues, T. S., et al. 2017, A&A, 597, A30 [NASA ADS] [CrossRef] [EDP Sciences] [Google Scholar]
- Anthony-Twarog, B. J., Lee-Brown, D. B., Deliyannis, C. P., & Twarog, B. A. 2018, AJ, 155, 138 [NASA ADS] [CrossRef] [Google Scholar]
- Anthony-Twarog, B. J., Deliyannis, C. P., & Twarog, B. A. 2021, AJ, 161, 159 [Google Scholar]
- Astropy Collaboration (Robitaille, T. P., et al.) 2013, A&A, 558, A33 [NASA ADS] [CrossRef] [EDP Sciences] [Google Scholar]
- Bailer-Jones, C. A. L., Rybizki, J., Fouesneau, M., Demleitner, M., & Andrae, R. 2021, AJ, 161, 147 [Google Scholar]
- Baratella, M., D’Orazi, V., Sheminova, V., et al. 2021, A&A, submitted [arXiv:2107.12381] [Google Scholar]
- Bath, G. T., & Shaviv, G. 1978, MNRAS, 183, 515 [NASA ADS] [Google Scholar]
- Bensby, T., & Lind, K. 2018, A&A, 615, A151 [NASA ADS] [CrossRef] [EDP Sciences] [Google Scholar]
- Bensby, T., Feltzing, S., & Lundström, I. 2003, A&A, 410, 527 [NASA ADS] [CrossRef] [EDP Sciences] [Google Scholar]
- Bensby, T., Feltzing, S., & Oey, M. S. 2014, A&A, 562, A71 [NASA ADS] [CrossRef] [EDP Sciences] [Google Scholar]
- Boesgaard, A. M., & Tripicco, M. J. 1986, ApJ, 302, L49 [NASA ADS] [CrossRef] [Google Scholar]
- Bonifacio, P., & Molaro, P. 1997, MNRAS, 285, 847 [NASA ADS] [CrossRef] [Google Scholar]
- Bouvier, J., Lanzafame, A. C., Venuti, L., et al. 2016, A&A, 590, A78 [NASA ADS] [CrossRef] [EDP Sciences] [Google Scholar]
- Bovy, J. 2015, ApJS, 216, 29 [NASA ADS] [CrossRef] [Google Scholar]
- Bovy, J., Allende Prieto, C., Beers, T. C., et al. 2012, ApJ, 759, 131 [NASA ADS] [CrossRef] [Google Scholar]
- Cameron, A. G. W. 1955, ApJ, 121, 144 [NASA ADS] [CrossRef] [Google Scholar]
- Cameron, A. G. W., & Fowler, W. A. 1971, ApJ, 164, 111 [NASA ADS] [CrossRef] [Google Scholar]
- Cantat-Gaudin, T., Anders, F., Castro-Ginard, A., et al. 2020, A&A, 640, A1 [NASA ADS] [CrossRef] [EDP Sciences] [Google Scholar]
- Casali, G., Spina, L., Magrini, L., et al. 2020, A&A, 639, A127 [CrossRef] [EDP Sciences] [Google Scholar]
- Casamiquela, L., Carrera, R., Blanco-Cuaresma, S., et al. 2017, MNRAS, 470, 4363 [NASA ADS] [CrossRef] [Google Scholar]
- Cayrel, R. 1988, in The Impact of Very High S/N Spectroscopy on Stellar Physics, eds. G. Cayrel de Strobel, & M. Spite, 132, 345 [NASA ADS] [CrossRef] [Google Scholar]
- Charbonnel, C., & Primas, F. 2005, A&A, 442, 961 [NASA ADS] [CrossRef] [EDP Sciences] [Google Scholar]
- Charbonnel, C., Lagarde, N., Jasniewicz, G., et al. 2020, A&A, 633, A34 [CrossRef] [EDP Sciences] [Google Scholar]
- Charbonnel, C., Borisov, S., de Laverny, P., & Prantzos, N. 2021, A&A, 649, L10 [NASA ADS] [CrossRef] [EDP Sciences] [Google Scholar]
- Chiappini, C. 2009, in The Galaxy Disk in Cosmological Context, eds. J. Andersen, B. M. Nordströara, & J. Bland-Hawthorn, 254, 191 [Google Scholar]
- Chiappini, C., Matteucci, F., & Romano, D. 2001, ApJ, 554, 1044 [NASA ADS] [CrossRef] [Google Scholar]
- Chugai, N. N., & Kudryashov, A. D. 2020, Astron. Lett., 46, 92 [NASA ADS] [CrossRef] [Google Scholar]
- Clara, M. T., & Martins, C. J. A. P. 2020, A&A, 633, L11 [EDP Sciences] [Google Scholar]
- Coc, A., Goriely, S., Xu, Y., Saimpert, M., & Vangioni, E. 2012, ApJ, 744, 158 [NASA ADS] [CrossRef] [Google Scholar]
- Dalton, G., Trager, S. C., Abrams, D. C., et al. 2012, in Ground-based and Airborne Instrumentation for Astronomy IV, eds. I. S. McLean, S. K. Ramsay, & H. Takami, SPIE Conf. Ser., 8446, 84460 [CrossRef] [Google Scholar]
- D’Antona, F., & Matteucci, F. 1991, A&A, 248, 62 [NASA ADS] [Google Scholar]
- De, K., Kasliwal, M. M., Hankins, M. J., et al. 2021, ApJ, 912, 19 [NASA ADS] [CrossRef] [Google Scholar]
- Deepak, Lambert, D. L., & Reddy, B. E. 2020, MNRAS, 494, 1348 [Google Scholar]
- de Jong, R. S., Bellido-Tirado, O., Chiappini, C., et al. 2012, in Ground-based and Airborne Instrumentation for Astronomy IV, eds. I. S. McLean, S. K. Ramsay, & H. Takami, SPIE Conf. Ser., 8446, 84460T [CrossRef] [Google Scholar]
- de Laverny, P., Recio-Blanco, A., Worley, C. C., & Plez, B. 2012, A&A, 544, A126 [NASA ADS] [CrossRef] [EDP Sciences] [Google Scholar]
- Delgado Mena, E., Bertrán de Lis, S., Adibekyan, V. Z., et al. 2015, A&A, 576, A69 [NASA ADS] [CrossRef] [EDP Sciences] [Google Scholar]
- Denissenkov, P. A., Ruiz, C., Upadhyayula, S., & Herwig, F. 2021, MNRAS, 501, L33 [Google Scholar]
- De Silva, G. M., Freeman, K. C., Bland-Hawthorn, J., et al. 2015, MNRAS, 449, 2604 [NASA ADS] [CrossRef] [MathSciNet] [Google Scholar]
- Domogatskii, G. V., Eramzhian, R. A., & Nadezhin, D. K. 1978, Ap&SS, 58, 273 [NASA ADS] [CrossRef] [Google Scholar]
- Duncan, D. K., Primas, F., Rebull, L. M., et al. 1997, ApJ, 488, 338 [NASA ADS] [CrossRef] [Google Scholar]
- Ferrini, F., Matteucci, F., Pardi, C., & Penco, U. 1992, ApJ, 387, 138 [NASA ADS] [CrossRef] [Google Scholar]
- Feuillet, D. K., Feltzing, S., Sahlholdt, C. L., & Casagrande, L. 2020, MNRAS, 497, 109 [CrossRef] [Google Scholar]
- Fields, B. D., Olive, K. A., Yeh, T.-H., & Young, C. 2020, JCAP, 2020, 010 [CrossRef] [Google Scholar]
- Franchini, M., Morossi, C., Di Marcantonio, P., et al. 2020, ApJ, 888, 55 [CrossRef] [Google Scholar]
- Fu, X., Bressan, A., Molaro, P., & Marigo, P. 2015, MNRAS, 452, 3256 [CrossRef] [Google Scholar]
- Fu, X., Romano, D., Bragaglia, A., et al. 2018, A&A, 610, A38 [NASA ADS] [CrossRef] [EDP Sciences] [Google Scholar]
- Fujimoto, S.-I., Matsuba, R., & Arai, K. 2008, ApJ, 673, L51 [NASA ADS] [CrossRef] [Google Scholar]
- Gaia Collaboration (Prusti, T., et al.) 2016, A&A, 595, A1 [NASA ADS] [CrossRef] [EDP Sciences] [Google Scholar]
- Gaia Collaboration (Brown, A. G. A., et al.) 2021, A&A, 649, A1 [NASA ADS] [CrossRef] [EDP Sciences] [Google Scholar]
- Gao, S., Liu, C., Zhang, X., et al. 2014, ApJ, 788, L37 [NASA ADS] [CrossRef] [Google Scholar]
- Gao, S., Zhao, H., Yang, H., & Gao, R. 2017, MNRAS, 469, L68 [NASA ADS] [CrossRef] [Google Scholar]
- Gao, X., Lind, K., Amarsi, A. M., et al. 2020, MNRAS, 497, L30 [CrossRef] [Google Scholar]
- Gilmore, G., Randich, S., Asplund, M., et al. 2012, The Messenger, 147, 25 [NASA ADS] [Google Scholar]
- Goudelis, A., Pospelov, M., & Pradler, J. 2016, Phys. Rev. Lett., 116, 211303 [Google Scholar]
- Grisoni, V., Spitoni, E., Matteucci, F., et al. 2017, MNRAS, 472, 3637 [Google Scholar]
- Grisoni, V., Spitoni, E., & Matteucci, F. 2018, MNRAS, 481, 2570 [NASA ADS] [Google Scholar]
- Grisoni, V., Matteucci, F., Romano, D., & Fu, X. 2019, MNRAS, 489, 3539 [NASA ADS] [CrossRef] [Google Scholar]
- Grisoni, V., Romano, D., Spitoni, E., et al. 2020, MNRAS, 498, 1252 [CrossRef] [Google Scholar]
- Guiglion, G., de Laverny, P., Recio-Blanco, A., et al. 2016, A&A, 595, A18 [NASA ADS] [CrossRef] [EDP Sciences] [Google Scholar]
- Guiglion, G., Chiappini, C., Romano, D., et al. 2019, A&A, 623, A99 [NASA ADS] [CrossRef] [EDP Sciences] [Google Scholar]
- Heiter, U., Lind, K., Asplund, M., et al. 2015, Phys. Scr., 90, 054010 [Google Scholar]
- Helmi, A. 2020, ARA&A, 58, 205 [Google Scholar]
- Hou, S. Q., He, J. J., Parikh, A., et al. 2017, ApJ, 834, 165 [Google Scholar]
- Iwamoto, K., Brachwitz, F., Nomoto, K., et al. 1999, ApJS, 125, 439 [NASA ADS] [CrossRef] [MathSciNet] [Google Scholar]
- Izzo, L., Della Valle, M., Mason, E., et al. 2015, ApJ, 808, L14 [NASA ADS] [CrossRef] [Google Scholar]
- Jackson, R. J., Jeffries, R. D., Wright, N. J., et al. 2020, MNRAS, 496, 4701 [CrossRef] [Google Scholar]
- Jeffries, R. D., Jackson, R. J., Sun, Q., & Deliyannis, C. P. 2021, MNRAS, 500, 1158 [Google Scholar]
- José, J., & Hernanz, M. 2007, J. Phys. G Nucl. Phys., 34, R431 [Google Scholar]
- Jurić, M., Ivezić, Ž., Brooks, A., et al. 2008, ApJ, 673, 864 [NASA ADS] [CrossRef] [MathSciNet] [Google Scholar]
- Kelly, D. E., Christian, D. J., Mathioudakis, M., & Jevremović, D. 2020, Res. Astron. Astrophys., 20, 104 [Google Scholar]
- Khatri, R., & Sunyaev, R. A. 2011, Astron. Lett., 37, 367 [NASA ADS] [CrossRef] [Google Scholar]
- Kirby, E. N., Guhathakurta, P., Zhang, A. J., et al. 2016, ApJ, 819, 135 [NASA ADS] [CrossRef] [Google Scholar]
- Kusakabe, M., Cheoun, M.-K., Kim, K. S., et al. 2019, ApJ, 872, 164 [NASA ADS] [CrossRef] [Google Scholar]
- Lambert, D. L., & Reddy, B. E. 2004, MNRAS, 349, 757 [NASA ADS] [CrossRef] [Google Scholar]
- Lanzafame, A. C., Frasca, A., Damiani, F., et al. 2015, A&A, 576, A80 [NASA ADS] [CrossRef] [EDP Sciences] [Google Scholar]
- Lemoine, M., Vangioni-Flam, E., & Cassé, M. 1998, ApJ, 499, 735 [NASA ADS] [CrossRef] [Google Scholar]
- Limongi, M., & Chieffi, A. 2018, ApJS, 237, 13 [NASA ADS] [CrossRef] [Google Scholar]
- Lodders, K., Palme, H., & Gail, H. P. 2009, Landolt Börnstein, 4B, 712 [Google Scholar]
- Luo, Y., Kajino, T., Kusakabe, M., & Mathews, G. J. 2019, ApJ, 872, 172 [NASA ADS] [CrossRef] [Google Scholar]
- Magrini, L., Lagarde, N., Charbonnel, C., et al. 2021, A&A, 651, A84 [NASA ADS] [CrossRef] [EDP Sciences] [Google Scholar]
- Matteucci, F., D’Antona, F., & Timmes, F. X. 1995, A&A, 303, 460 [Google Scholar]
- Matteucci, F., Molero, M., Aguado, D. S., & Romano, D. 2021, MNRAS, 505, 200 [NASA ADS] [CrossRef] [Google Scholar]
- Meneguzzi, M., Audouze, J., & Reeves, H. 1971, A&A, 15, 337 [NASA ADS] [Google Scholar]
- Michaud, G., Fontaine, G., & Beaudet, G. 1984, ApJ, 282, 206 [NASA ADS] [CrossRef] [Google Scholar]
- Molaro, P., Izzo, L., Bonifacio, P., et al. 2020a, MNRAS, 492, 4975 [CrossRef] [Google Scholar]
- Molaro, P., Cescutti, G., & Fu, X. 2020b, MNRAS, 496, 2902 [Google Scholar]
- Mucciarelli, A., Salaris, M., & Bonifacio, P. 2012, MNRAS, 419, 2195 [NASA ADS] [CrossRef] [Google Scholar]
- Nordlander, T., Korn, A. J., Richard, O., & Lind, K. 2012, ApJ, 753, 48 [NASA ADS] [CrossRef] [Google Scholar]
- Pancino, E., Lardo, C., Altavilla, G., et al. 2017, A&A, 598, A5 [NASA ADS] [CrossRef] [EDP Sciences] [Google Scholar]
- Pasquini, L., Avila, G., Blecha, A., et al. 2002, The Messenger, 110, 1 [Google Scholar]
- Pitrou, C., Coc, A., Uzan, J.-P., & Vangioni, E. 2018, Phys. Rep., 754, 1 [Google Scholar]
- Prantzos, N. 2012, A&A, 542, A67 [NASA ADS] [CrossRef] [EDP Sciences] [Google Scholar]
- Prantzos, N., de Laverny, P., Guiglion, G., Recio-Blanco, A., & Worley, C. C. 2017, A&A, 606, A132 [NASA ADS] [CrossRef] [EDP Sciences] [Google Scholar]
- Ramírez, I., Meléndez, J., Bean, J., et al. 2014, A&A, 572, A48 [NASA ADS] [CrossRef] [EDP Sciences] [Google Scholar]
- Randich, S., & Magrini, L. 2021, Front. Astron. Space Sci., 8, 6 [NASA ADS] [CrossRef] [Google Scholar]
- Randich, S., Gilmore, G., & Gaia-ESO Consortium 2013, The Messenger, 154, 47 [NASA ADS] [Google Scholar]
- Randich, S., Pasquini, L., Franciosini, E., et al. 2020, A&A, 640, L1 [EDP Sciences] [Google Scholar]
- Rebolo, R., Molaro, P., & Beckman, J. E. 1988, A&A, 192, 192 [NASA ADS] [Google Scholar]
- Recio-Blanco, A., de Laverny, P., Kordopatis, G., et al. 2014, A&A, 567, A5 [NASA ADS] [CrossRef] [EDP Sciences] [Google Scholar]
- Reeves, H., Fowler, W. A., & Hoyle, F. 1970, Nature, 226, 727 [NASA ADS] [CrossRef] [PubMed] [Google Scholar]
- Romano, D., Matteucci, F., Molaro, P., & Bonifacio, P. 1999, A&A, 352, 117 [NASA ADS] [Google Scholar]
- Romano, D., Matteucci, F., Ventura, P., & D’Antona, F. 2001, A&A, 374, 646 [NASA ADS] [CrossRef] [EDP Sciences] [Google Scholar]
- Romano, D., Chiappini, C., Matteucci, F., & Tosi, M. 2005, A&A, 430, 491 [NASA ADS] [CrossRef] [EDP Sciences] [Google Scholar]
- Romano, D., Matteucci, F., Zhang, Z.-Y., Ivison, R. J., & Ventura, P. 2019, MNRAS, 490, 2838 [NASA ADS] [CrossRef] [Google Scholar]
- Romano, D., Franchini, M., Grisoni, V., et al. 2020, A&A, 639, A37 [CrossRef] [EDP Sciences] [Google Scholar]
- Ruchti, G. R., Fulbright, J. P., Wyse, R. F. G., et al. 2011, ApJ, 743, 107 [NASA ADS] [CrossRef] [Google Scholar]
- Sackmann, I. J., & Boothroyd, A. I. 1999, ApJ, 510, 217 [NASA ADS] [CrossRef] [Google Scholar]
- Sbordone, L., Bonifacio, P., Caffau, E., et al. 2010, A&A, 522, A26 [NASA ADS] [CrossRef] [EDP Sciences] [Google Scholar]
- Schönrich, R., Binney, J., & Dehnen, W. 2010, MNRAS, 403, 1829 [NASA ADS] [CrossRef] [Google Scholar]
- Selvelli, P., Molaro, P., & Izzo, L. 2018, MNRAS, 481, 2261 [CrossRef] [Google Scholar]
- Shore, S. N., & De Gennaro Aquino, I. 2020, A&A, 639, L12 [EDP Sciences] [Google Scholar]
- Sieverding, A., Martínez-Pinedo, G., Huther, L., Langanke, K., & Heger, A. 2018, ApJ, 865, 143 [NASA ADS] [CrossRef] [Google Scholar]
- Sieverding, A., Langanke, K., Martínez-Pinedo, G., et al. 2019, ApJ, 876, 151 [NASA ADS] [CrossRef] [Google Scholar]
- Silva Aguirre, V., Ruchti, G. R., Hekker, S., et al. 2014, ApJ, 784, L16 [NASA ADS] [CrossRef] [Google Scholar]
- Singh, R., Reddy, B. E., Bharat Kumar, Y., & Antia, H. M. 2019, ApJ, 878, L21 [NASA ADS] [CrossRef] [Google Scholar]
- Skrutskie, M. F., Cutri, R. M., Stiening, R., et al. 2006, AJ, 131, 1163 [NASA ADS] [CrossRef] [Google Scholar]
- Smiljanic, R., Korn, A. J., Bergemann, M., et al. 2014, A&A, 570, A122 [NASA ADS] [CrossRef] [EDP Sciences] [Google Scholar]
- Smiljanic, R., Franciosini, E., Bragaglia, A., et al. 2018, A&A, 617, A4 [NASA ADS] [CrossRef] [EDP Sciences] [Google Scholar]
- Spada, F., Demarque, P., Kim, Y. C., Boyajian, T. S., & Brewer, J. M. 2017, ApJ, 838, 161 [Google Scholar]
- Spina, L., Randich, S., Magrini, L., et al. 2017, A&A, 601, A70 [NASA ADS] [CrossRef] [EDP Sciences] [Google Scholar]
- Spite, F., & Spite, M. 1982, A&A, 115, 357 [NASA ADS] [Google Scholar]
- Starrfield, S., Truran, J. W., Sparks, W. M., & Arnould, M. 1978, ApJ, 222, 600 [NASA ADS] [CrossRef] [Google Scholar]
- Starrfield, S., Bose, M., Iliadis, C., et al. 2020, ApJ, 895, 70 [CrossRef] [Google Scholar]
- Steigman, G. 2007, Annu. Rev. Nucl. Part. Sci., 57, 463 [NASA ADS] [CrossRef] [Google Scholar]
- Tajitsu, A., Sadakane, K., Naito, H., Arai, A., & Aoki, W. 2015, Nature, 518, 381 [NASA ADS] [CrossRef] [Google Scholar]
- Taylor, C. J., Ritchey, A. M., Federman, S. R., & Lambert, D. L. 2012, ApJ, 750, L15 [NASA ADS] [CrossRef] [Google Scholar]
- Thompson, B. B., Few, C. G., Bergemann, M., et al. 2018, MNRAS, 473, 185 [NASA ADS] [CrossRef] [Google Scholar]
- Travaglio, C., Randich, S., Galli, D., et al. 2001, ApJ, 559, 909 [NASA ADS] [CrossRef] [Google Scholar]
- Ventura, P., D’Antona, F., & Mazzitelli, I. 2000, A&A, 363, 605 [Google Scholar]
- Ventura, P., Di Criscienzo, M., Carini, R., & D’Antona, F. 2013, MNRAS, 431, 3642 [NASA ADS] [CrossRef] [Google Scholar]
- Ventura, P., Dell’Agli, F., Lugaro, M., et al. 2020, A&A, 641, A103 [NASA ADS] [CrossRef] [EDP Sciences] [Google Scholar]
- Wallerstein, G., & Sneden, C. 1982, ApJ, 255, 577 [NASA ADS] [CrossRef] [Google Scholar]
- Wang, E. X., Nordlander, T., Asplund, M., et al. 2021, MNRAS, 500, 2159 [Google Scholar]
- Woosley, S. E., & Weaver, T. A. 1995, ApJS, 101, 181 [NASA ADS] [CrossRef] [Google Scholar]
- Woosley, S. E., Hartmann, D. H., Hoffman, R. D., & Haxton, W. C. 1990, ApJ, 356, 272 [NASA ADS] [CrossRef] [Google Scholar]
- Yi, I., & Narayan, R. 1997, ApJ, 486, 363 [NASA ADS] [CrossRef] [Google Scholar]
- Yoshida, T., Suzuki, T., Chiba, S., et al. 2008, ApJ, 686, 448 [Google Scholar]
- Yuan, H., Liu, X., Xiang, M., Huang, Y., & Chen, B. 2015, ApJ, 803, 13 [CrossRef] [Google Scholar]
All Tables
Stellar parameters and lithium abundances of 3210 stars in the field, ordered by increasing age.
Parameters and average maximum lithium abundance for the selected clusters, sorted by increasing age.
Orbital parameters for the selected clusters and field stars, sorted by increasing age.
All Figures
|
Fig. 1. Average maximum 7Li abundances from iDR6 (this work) and iDR5 (Randich et al. 2020) for the clusters in common. |
| In the text | |
|
Fig. 2. Effective temperature versus stellar age diagrams for the GES iDR6 sample of field stars discussed in this paper, divided into inner disc (top panel, 619 stars), solar vicinity (middle panel, 2129 stars), and outer disc sub-samples (bottom panel, 462 stars). Stellar ages were determined from isochrone fitting using the aussieq2 code and YaPSI stellar models (Spada et al. 2017). Stars with lithium measurements are colour-coded according to their 7Li abundance. Grey dots represent upper limits. |
| In the text | |
|
Fig. 3. Effective temperature versus gravity diagram for the full GES iDR6 sample of field stars discussed in this paper. Stars with lithium measurements are colour-coded according to their 7Li abundance. Grey dots represent upper limits. The approximate location of the 7Li dip region (see also Gao et al. 2020) is highlighted (yellow area). |
| In the text | |
|
Fig. 4. Lithium abundance as a function of effective temperature for our sample of GES iDR6 field stars restricted to targets found in the solar neighbourhood (7 < RGC/kpc < 9). Both 7Li measurements (circles) and upper limits (grey dots) are reported. Whenever possible, high-α (red circles), low-α (blue), metal-rich α-rich (magenta), and super metal-rich solar-α stars (light blue) were identified according to their position in the [α/Fe]–[Fe/H] diagram, adopting the same criteria as Guiglion et al. (2016, 2019, see also Recio-Blanco et al. 2014). Empty circles represent stars without chemical identification. The grey lines show the 7Li content in meteorites (3.26 ± 0.05, Lodders et al. 2009). |
| In the text | |
|
Fig. 5. Lithium abundance as a function of rotational velocity for the full field GES iDR6 stellar sample selected for this paper (3210 objects). The stars are colour-coded according to their effective temperature. Both 7Li measurements (circles) and upper limits (dots) are shown. Rotational velocities are measured from FLAMES-UVES spectra; typical errors on v sin i are ≤5 km s−1. |
| In the text | |
|
Fig. 6. Behaviour of A(Li) as a function of [Fe/H] (left and middle panels) and age (right panel) in the solar neighbourhood, for the thick- (left) and thin-disc components (middle and right panels). Lithium measurements for high- and low-α field stars in GES iDR6 are shown (red and blue circles, respectively), together with upper limits (grey dots). Cluster data are shown with brown shades for the younger clusters and yellow tones for the older ones. Only clusters and stars with 7 < RGC/kpc < 9 are considered for the comparison with the solar neighbourhood models. The meteoritic abundance from Lodders et al. (2009) is indicated with the multiplication sign. The predictions of the parallel GCE model are highlighted with different colours depending on the assumptions made about 7Li synthesis and cosmological lithium abundance. We also show data for metal-rich α-rich stars (magenta circles) and super metal-rich solar-α stars (light blue circles) found in the solar neighbourhood. These are not to be compared with the predictions of solar neighbourhood models and are used only for discussion purposes (see text). Empty circles are stars that lack an [α/Fe] determination in GES iDR6; we assign most of them to the thin-disc component, based on their kinematics (see Sect. 4.5). |
| In the text | |
|
Fig. 7. Radial profiles of lithium abundance. The theoretical predictions refer to the gradient at the Sun’s birth (t = 9.2 Gyr, dotted curve) and at the current time (t = 13.7 Gyr, solid line). Data for our sample of GES iDR6 field stars, chemically separated into different sub-populations only in the solar neighbourhood region, are shown in different colours. Blue, magenta, and light blue circles identify, respectively, low-α, metal-rich α-rich, and metal-rich solar-α stars. Black circles refer to stars that inhabit either the inner or the outer disc. Average maximum 7Li abundances for 26 OCs selected from GES iDR6 are also displayed (small colour-coded circles). The meteoritic abundance from Lodders et al. (2009) is indicated with the multiplication sign. On the top x-axis we report the current metallicity of the ISM as predicted by the model at different radii. |
| In the text | |
|
Fig. 8. Behaviour of A(Li) as a function of [Fe/H] in the local thin disc (RGC = 7 − 9 kpc, left panel) and as a function of the galactocentric distance at the present time (right panel). Lithium measurements for field low-α, mrαr, and super metal-rich solar-α stars from GES iDR6 are shown (blue, magenta, and light blue circles, respectively, left panel only) together with data for OCs colour-coded according to the cluster’s age (see the vertical bar on the right in Fig. 7). Only clusters with ages < 2 Gyr are shown. The predictions of our fiducial GCE model are shown as thick grey lines. The thin solid lines illustrate the effects of reducing the mass range of primary stars entering the formation of nova systems (left panel only) while keeping the predicted current nova outburst rate fixed. The thick green lines refer to a model in which the nova yield (i.e., the total amount of 7Li ejected by a typical nova during its lifetime, dubbed MLi in the legend) is also reduced. See text for details. |
| In the text | |
|
Fig. 9. Toomre diagram (LSR-corrected) for our sub-sample of high-α stars, colour-coded according to their 7Li abundance (see vertical bar on the right). Constant total space velocities with respect to the LSR of Vtot = 85 and 210 km s−1 are marked with dashed curves. Low-α, metal-rich α-rich, and super metal-rich solar-α stars (not shown to avoid overcrowding) are consistent with thin-disc kinematics. |
| In the text | |
|
Fig. 10.
|
| In the text | |
Current usage metrics show cumulative count of Article Views (full-text article views including HTML views, PDF and ePub downloads, according to the available data) and Abstracts Views on Vision4Press platform.
Data correspond to usage on the plateform after 2015. The current usage metrics is available 48-96 hours after online publication and is updated daily on week days.
Initial download of the metrics may take a while.