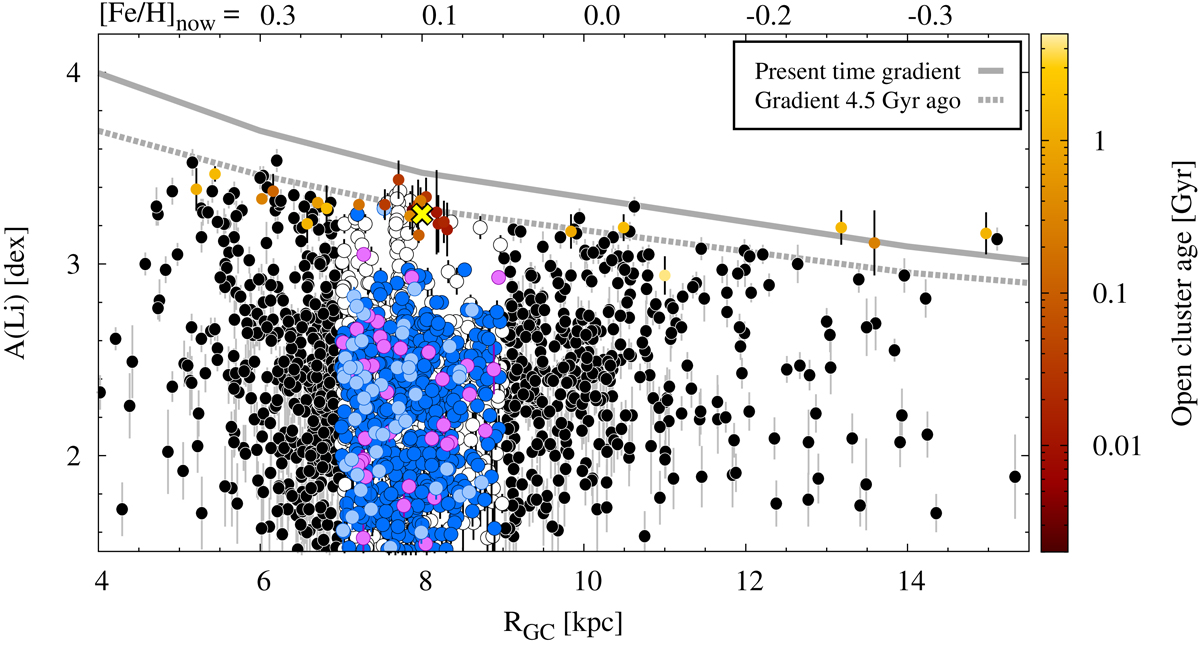
Fig. 7.
Download original image
Radial profiles of lithium abundance. The theoretical predictions refer to the gradient at the Sun’s birth (t = 9.2 Gyr, dotted curve) and at the current time (t = 13.7 Gyr, solid line). Data for our sample of GES iDR6 field stars, chemically separated into different sub-populations only in the solar neighbourhood region, are shown in different colours. Blue, magenta, and light blue circles identify, respectively, low-α, metal-rich α-rich, and metal-rich solar-α stars. Black circles refer to stars that inhabit either the inner or the outer disc. Average maximum 7Li abundances for 26 OCs selected from GES iDR6 are also displayed (small colour-coded circles). The meteoritic abundance from Lodders et al. (2009) is indicated with the multiplication sign. On the top x-axis we report the current metallicity of the ISM as predicted by the model at different radii.
Current usage metrics show cumulative count of Article Views (full-text article views including HTML views, PDF and ePub downloads, according to the available data) and Abstracts Views on Vision4Press platform.
Data correspond to usage on the plateform after 2015. The current usage metrics is available 48-96 hours after online publication and is updated daily on week days.
Initial download of the metrics may take a while.