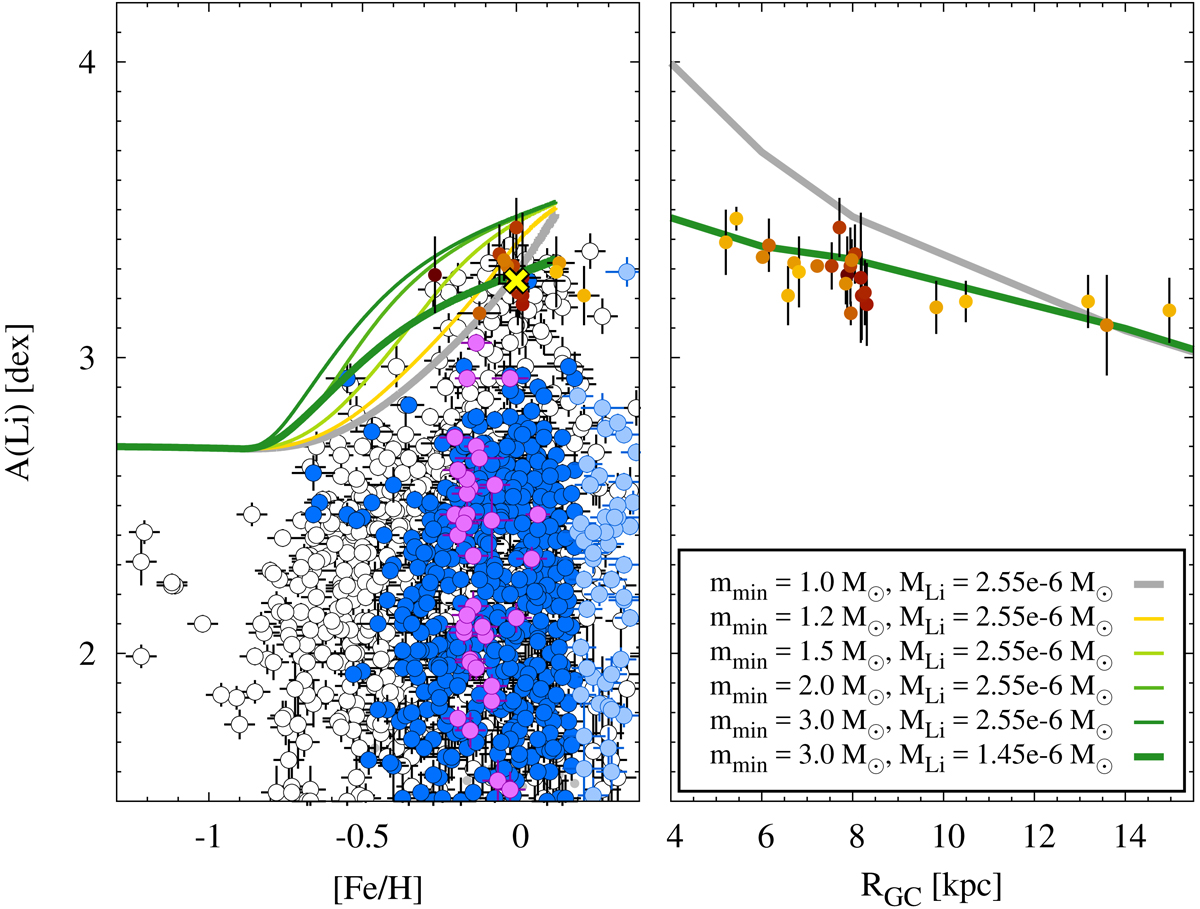
Fig. 8.
Download original image
Behaviour of A(Li) as a function of [Fe/H] in the local thin disc (RGC = 7 − 9 kpc, left panel) and as a function of the galactocentric distance at the present time (right panel). Lithium measurements for field low-α, mrαr, and super metal-rich solar-α stars from GES iDR6 are shown (blue, magenta, and light blue circles, respectively, left panel only) together with data for OCs colour-coded according to the cluster’s age (see the vertical bar on the right in Fig. 7). Only clusters with ages < 2 Gyr are shown. The predictions of our fiducial GCE model are shown as thick grey lines. The thin solid lines illustrate the effects of reducing the mass range of primary stars entering the formation of nova systems (left panel only) while keeping the predicted current nova outburst rate fixed. The thick green lines refer to a model in which the nova yield (i.e., the total amount of 7Li ejected by a typical nova during its lifetime, dubbed MLi in the legend) is also reduced. See text for details.
Current usage metrics show cumulative count of Article Views (full-text article views including HTML views, PDF and ePub downloads, according to the available data) and Abstracts Views on Vision4Press platform.
Data correspond to usage on the plateform after 2015. The current usage metrics is available 48-96 hours after online publication and is updated daily on week days.
Initial download of the metrics may take a while.