Fig. 3.
Download original image
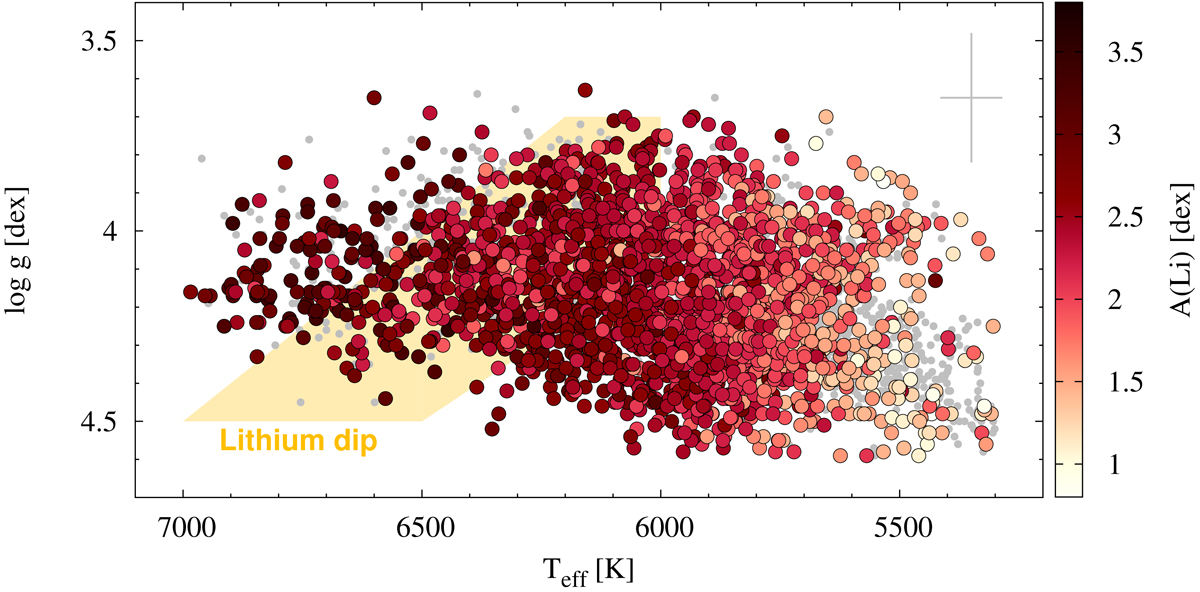
Effective temperature versus gravity diagram for the full GES iDR6 sample of field stars discussed in this paper. Stars with lithium measurements are colour-coded according to their 7Li abundance. Grey dots represent upper limits. The approximate location of the 7Li dip region (see also Gao et al. 2020) is highlighted (yellow area).
Current usage metrics show cumulative count of Article Views (full-text article views including HTML views, PDF and ePub downloads, according to the available data) and Abstracts Views on Vision4Press platform.
Data correspond to usage on the plateform after 2015. The current usage metrics is available 48-96 hours after online publication and is updated daily on week days.
Initial download of the metrics may take a while.