| Issue |
A&A
Volume 652, August 2021
|
|
|---|---|---|
| Article Number | L11 | |
| Number of page(s) | 11 | |
| Section | Letters to the Editor | |
| DOI | https://doi.org/10.1051/0004-6361/202141086 | |
| Published online | 19 August 2021 | |
Letter to the Editor
Formation of an ultra-diffuse galaxy in the stellar filaments of NGC 3314A: Caught in the act?
1
INAF-Astronomical Observatory of Capodimonte, Salita Moiariello 16, 80131 Naples, Italy
e-mail: This email address is being protected from spambots. You need JavaScript enabled to view it.
2
European Southern Observatory, Karl-Schwarzschild-Strasse 2, 85748 Garching bei Muenchen, Germany
3
INAF-Astronomical Observatory of Abruzzo, Via Maggini, 64100 Teramo, Italy
4
Instituto de Astrofísica, Facultad de Fisica, Pontificia Universidad Católica de Chile, Av. Vicuña Mackenna 4860, 7820436 Macul, Santiago, Chile
5
INAF-Osservatorio Astronomico di Padova, Vicolo dell’Osservatorio 5, 35122 Padova, Italy
6
Department of Physics, University of Oxford, Denys Wilkinson Building, Keble Road, Oxford OX1 3RH, UK
7
Centre for Astrophysics and Supercomputing, Swinburne University of Technology, Hawthorn, Victoria 3122, Australia
8
European Southern Observatory, Alonso de Cordova 3107, Vitacura, Santiago, Chile
9
University of Naples “Federico II”, C.U. Monte Sant’Angelo, Via Cinthia, 80126 Naples, Italy
Received:
14
April
2021
Accepted:
9
July
2021
Abstract
The VEGAS imaging survey of the Hydra I cluster has revealed an extended network of stellar filaments to the south-west of the spiral galaxy NGC 3314A. Within these filaments, at a projected distance of ∼40 kpc from the galaxy, we discover an ultra-diffuse galaxy (UDG) with a central surface brightness of μ0, g ∼ 26 mag arcsec−2 and effective radius Re ∼ 3.8 kpc. This UDG, named UDG 32, is one of the faintest and most diffuse low-surface-brightness galaxies in the Hydra I cluster. Based on the available data, we cannot exclude that this object is just seen in projection on top of the stellar filaments and is thus instead a foreground or background UDG in the cluster. However, the clear spatial coincidence of UDG 32 with the stellar filaments of NGC 3314A suggests that it might have formed from the material in the filaments, becoming a detached, gravitationally bound system. In this scenario, the origin of UDG 32 depends on the nature of the stellar filaments in NGC 3314A, which is still unknown. The stellar filaments could result from ram-pressure stripping or have a tidal origin. In this letter we focus on the comparison of the observed properties of the stellar filaments and of UDG 32 and speculate on their possible origin. The relatively red colour (g − r = 0.54 ± 0.14 mag) of the UDG, similar to that of the disk in NGC 3314A, combined with an age older than 1 Gyr and the possible presence of a few compact stellar systems, points towards a tidal formation scenario.
Key words: galaxies: dwarf / galaxies: clusters: individual: Hydra I / galaxies: formation / galaxies: photometry
© ESO 2021
1. Introduction
Ultra-diffuse galaxies (UDGs) have a special role in the realm of the low-surface-brightness (LSB) universe. They are empirically defined to be faint (μ0, g ≥ 24 mag arcsec−2) and diffuse (Re ≥ 1.5 kpc) objects, with stellar masses similar to those of dwarf galaxies (∼107 − 108 M⊙; van Dokkum et al. 2015). The dark matter (DM) content of UDGs is one of the most debated open issues. Recent literature has suggested that UDGs are dwarfs in terms of their DM halo (Lim et al. 2018; Prole et al. 2019a). However, a larger DM amount was inferred for several UDGs (e.g., van Dokkum et al. 2019; Forbes et al. 2020a; Gannon et al. 2021). In contrast, some UDGs with very low DM content have also been discovered (e.g., van Dokkum et al. 2018; Collins et al. 2021). This has raised new questions on the whole framework of galaxy formation and on whether long-lived dwarf galaxies that do not have a tidal origin should have a massive DM halo (Lelli et al. 2015).
To date, a significant population of UDGs has been found in dense environments, such as clusters and groups of galaxies, as well as in the field (Koda et al. 2015; Román & Trujillo 2017; van der Burg et al. 2017; Shi et al. 2017; Müller et al. 2018; Venhola et al. 2017; Prole et al. 2019b; Forbes et al. 2019, 2020b; Janssens et al. 2019; Habas et al. 2020). Based on their colour distribution, morphology, stellar population, and globular cluster (GC) systems, a wide range of observed properties are found for UDGs, which do not fit into a single formation scenario (Leisman et al. 2017; Román & Trujillo 2017; Ferré-Mateu et al. 2018; Martín-Navarro et al. 2019; Lim et al. 2020; Forbes et al. 2020a; Rong et al. 2020).
Several formation channels have been proposed for UDGs. As the first detections of UDGs suggested a high DM content in a few of them, they have been termed ‘failed’ galaxies because they lost gas supply at an early epoch, which prevented the formation of normal, higher-surface-brightness systems despite having effective radii comparable to normal (Milky Way-like) galaxies (van Dokkum et al. 2015). Ultra-diffuse galaxies with stellar masses and DM contents consistent with dwarf galaxies could form as a consequence of anomalously high spins of DM halos (Amorisco & Loeb 2016; Rong et al. 2017; Tremmel et al. 2019) or of the kinematical heating of their stars induced by internal processes (i.e. gas outflows associated with feedback; Di Cintio et al. 2017). According to Sales et al. (2020), a population of genuine LSB galaxies with UDG properties forms in the field and later enters the cluster environment, while the so-called tidal UDGs (T-UDGs) stem from luminous galaxies and evolve into UDGs due to cluster tidal forces that remove their DM content. Tidally released material during galaxy interactions was also invoked to explain the formation of the DM-free tidal dwarf galaxies (Lelli et al. 2015; Duc et al. 2014; Ploeckinger et al. 2018). Finally, Poggianti et al. (2019) suggested that the DM-free UDGs might form from ram-pressure-stripped (RPS) gas clumps in the extended tails of infalling cluster galaxies.
To date, on the observational side, there have been few cases of UDGs clearly associated with tidal debris. In the sample of tidal dwarf galaxies (TDGs) studied by Duc et al. (2014), two objects have Re and μ0 values consistent with being UDGs and are clearly associated with the tidal tails of the massive early-type galaxy NGC 5557. In that work the authors did not describe them as UDGs, because the specific name for this class of galaxies was introduced later (van Dokkum et al. 2015).
The first evidence of UDGs formed through galaxy interactions was presented by Bennet et al. (2018). They reported the discovery of two new UDGs (NGC 2708-Dw1 and NGC 5631-Dw1) that are probably associated with the stellar streams around them caused by the encounters with nearby massive galaxies. Müller et al. (2019) investigated the possible connection between the two UDGs (NGC1052-DF2 and NGC1052-DF4) in the NGC1052 group with the LSB features (loops and stellar streams) detected in the intra-group space. They pointed out that no clear association can be made between NGC1052-DF2’s origin and the tidal interaction in the group where it resides. Recently, Montes et al. (2020) have proposed that the existence of faint stellar tails found in the outskirts of NGC1052-DF4 result from tidal stripping. This mechanism could have also removed a significant percentage of the DM, thus explaining the low DM content of this UDG.
In this letter we report the discovery of a UDG in the Hydra I cluster (51 ± 6 Mpc, Christlein & Zabludoff 2003) located within the newly detected faint stellar filaments of NGC 3314A. We have investigated whether this UDG and the filaments could be associated, and our results point towards new observational evidence for UDG formation in galaxy interactions.
2. A UDG candidate in the stellar filaments of NGC 3314A: UDG 32
NGC 3314AB, a member of the Hydra I cluster (see the top-left panel of Fig. 1), is a system of two spiral galaxies seen in projection on top of each other along the line-of-sight. NGC 3314A is the foreground galaxy, with a heliocentric velocity of cz = 2795 km s−1 (Christlein & Zabludoff 2003), and NGC 3314B has cz = 4665 km s−1 (Keel & White 2001; McMahon et al. 1992). Deep images of the Hydra I cluster, in the g and r bands, were acquired with the European Southern Observatory (ESO) VLT Survey Telescope (VST), as part of the VST Early-type Galaxy Survey (VEGAS)1 and presented in a recent paper by Iodice et al. (2020). The VST images have revealed an extended (∼3.4 arcmin ∼50 kpc) network of stellar filaments SW of NGC 3314AB (see the top-right panel of Fig. 1). Since we do not see any discontinuity in the light distribution, it is reasonable to associate this structure with NGC 3314A.
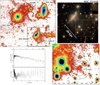 |
Fig. 1. VST images in the g band for the SE group of the Hydra I cluster and of NGC3314 AB. The top-left panel shows the extracted region of the VST mosaic (16.2 × 13.8 arcmin), in the g band, in the SE part of the Hydra I cluster. The brightest galaxy members, NGC 3312, NGC 3314AB, NGC 3316, and HCC 008, are marked. The dashed lines SW of NGC 3312 indicate the region where stellar filaments are detected. The light of the bright stars in the field has been modelled and subtracted from the reduced images (see also Iodice et al. 2020). North is up, and east is to the left. The black square is the region (6.44 × 6.04 arcmin) around the galaxies NGC 3314AB that is shown as a gr colour composite in the top-right panel. The dashed orange box indicates the region around the UDG 32 candidate, in the SW regions of NGC 3314AB, described in the text and shown as a g-band image (4.8 × 4.1 arcmin) in the lower-right panel. The dashed circular annulus indicates the region where we estimated the local background (see text for details). In the lower-right panel we show the azimuthally averaged surface brightness profile in the g band of UDG 32 compared with the best-fit Sersic law (solid red line). The colour g − r profile is shown in the lower-left sub-panels. |
Images from the Wide Field Planetary Camera at Hubble Space Telescope (WFPC2/HST), published by Keel & White (2001), cover 63″ × 70″ (i.e. only ∼17% of the VST field around NGC 3314AB), and thus they do not show the whole extension of this system. In fact, the authors refer to the presence of ‘tails’ in the SW regions of the disk in NGC 3314A. We downloaded and analysed archival data for the Advanced Camera for Survey (ACS) at HST mosaic, in the optical F606W filter, and GALEX images in far-UV (FUV) and near-UV (NUV). They are briefly described in Appendix A. The highest signal-to-noise stacked ACS/HST mosaic (see Fig. A.1) extends out to ∼1.4 arcmin (∼20 kpc) on the SW side. Here, the disk of NGC 3314A has a lopsided morphology, and several filamentary structures, which contain bright knots, are also detected. Since the ACS/HST mosaic covers the ∼60% of the VST images around NGC 3314, a morphological assessment of the outermost regions could not be done. Based on the new VST images, we concluded that the features detected from HST data on the SW side of NGC 3314A are part of the more complex and extended structure of stellar filaments, which we estimated to be ∼20 kpc wide and ∼50 kpc long (see the top-right panel of Fig. 1), becoming fainter (μg ∼ 26−27 mag arcsec−2) at larger radii. The GALEX data show that they have UV emission out to ∼3.7 arcmin (∼54 kpc) from the centre of NGC 3314A (see Fig. A.1).
The HI surface brightness distribution presented by McMahon et al. (1992) shows a long tail (∼30 kpc) extending south from the galaxy centre and a clump to the SE. Both features spatially overlap with the stellar filaments and the prominent star-forming regions in the SE, which were detected in the VST images.
UDG 322 is found within the stellar filaments of NGC 3314A, at a projected distance of 161.5 arcsec (∼40 kpc) from the centre of NGC 3314A (see Fig. 1). This object is outside the HST/ACS field of view. The GALEX images do not show any clear emission associated with UDG 32 (see Fig. A.1). This might suggest that it does not have a UV emission or, alternatively, that the GALEX images are too shallow. Multi-band observations for the Hydra I cluster are also available in the Canada France Hawaii Telescope (CFHT) science archive, which in any case are ∼2.5 mag shallower in the g and r bands relative to the VST data. To date, no further data as deep as the VST images have become available, nor have there been other studies of the region where we detected extended stellar filaments.
2.1. Detection of UDG32
UDG 32 is one of the 20 newly discovered UDG candidates in the Hydra I cluster. The first sample of 12 UDGs detected by visual inspection were presented by Iodice et al. (2020). In order to increase the detection rate of the LSB galaxies in this cluster, we combined the automatic tool SEXTRACTOR (Bertin & Arnouts 1996) with a subsequent visual inspection of the VST mosaics in the g and r bands. This led to the detection of 20 new UDGs. While we plan to present a detailed study of these UDGs in a forthcoming paper (La Marca et al., in prep.), which will also include details on the detection process and UDGs selection, their properties are used here for comparison with one interesting UDG candidate, UDG 32, which is the main focus of this letter.
2.2. Structural properties of UDG32
UDG 32 is one of the most diffuse UDGs detected in the Hydra I cluster, with a central surface brightness μ0 = 26 ± 1 mag arcsec−2 and Re = 3.8 ± 1 kpc. This object was found by visual inspection of the area around NGC 3314AB. Being so faint and diffuse, it falls below the SEXTRACTOR detection threshold with parameters tuned for detection of LSB galaxies in Hydra I (La Marca et al., in prep.). Figure B.1 (right panel) shows that in the new sample of UDGs in Hydra I there are few other UDGs with μ0 and Re values similar to those of UDG 32, within the error estimate. Compared to the previous sample of LSB galaxies in Hydra I by Misgeld et al. (2008), the faint, tidally disrupting dwarf HCC 087 (Koch et al. 2012) is the only object falling in the parameter space occupied by UDGs. In Appendix B we describe the main steps of the surface photometry performed in the area of NGC 3314AB, where UDG 32 is found, and how the structural parameters are derived.
UDG 32 has an integrated colour of g − r = 0.54 ± 0.14 mag and an absolute r-band magnitude of Mr = −14.65 mag. According to the colour-magnitude relation for early-type giant and dwarf galaxies in Hydra I (Misgeld et al. 2008), UDG 32 is consistent with being a cluster member, and its structural parameters are fully consistent with those measured for all UDGs in the cluster (see Fig. B.1). The azimuthally averaged surface brightness and colour profiles derived for UDG 32 are shown in Fig. 1. The redder colours in the centre and the minimum in the surface brightness profile could be due to dust absorption. Adopting the relation given by Into & Portinari (2013)3, the g − r colour and Mr were used to derive the stellar mass for UDG 32, which is M* ∼ 9 × 10⁷ M⊙.
VST images in the region of NGC 3314A were analysed to detect GC-like systems around UDG 32. To this aim, we adopted the same procedure and assumptions to identify old GCs as in the first sample of UDGs in Hydra I cluster (see Iodice et al. 2020), which is described in Appendix D. We find the total number of GC candidates (NGC) within 1.5Re, 3Re, and 5Re to be 0 ≤ NGC ≤ 6. In particular, we identified a compact source near the centre of UDG 32 (at ∼3.5″), with colour, magnitude, and compactness properties close to those expected for a bright, old GC (g − r ∼ 0.6 mag, mg ∼ 24.9 mag).
Based on the mean g − r colour derived for UDG 32, within a 1σ error, we used the E-MILES stellar population synthesis models (Vazdekis et al. 2012) to provide some constraints on the age and metallicity for this object. Results are shown in Fig. 2, where the range of possible ages is reported considering all the possible metallicity values allowed by the stellar population models ([Z/H] ∼ − 2.32 and 0.22 dex). This analysis shows that populations with colours in the range 0.4 ≤ g − r ≤ 0.64 mag span a range of stellar ages from 1 to 5 Gyrs for −0.7 ≤ [Z/H] ≤ 0.5. At lower metallicities (−1.7 ≤ [Z/H] ≤ − 1.2), older stellar ages of up to 13 Gyrs are possible. Assuming that UDG 32 is a normal LSB galaxy, according to the mass-metallicity relation derived for galaxies in the LSB regime (Fig. 5 in Pandya et al. 2018), its stellar mass (∼108 M⊙) would be consistent with a metallicity of Z/H ≥ −1.5. For this value, models shown in Fig. 2 predict ages older than 3 Gyrs and a stellar mass-to-light ratio M/L ≥ 1.2 in the g band. However, it is worth noting that we cannot exclude that there is dust absorption in the UDG. Therefore, UDG 32 might be intrinsically bluer, and, as consequence, even younger ages cannot be excluded without additional data.
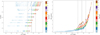 |
Fig. 2. E-MILES single stellar population (SSP) synthesis models. The g − r colours versus metallicity (left panel) and M/L ratio (right panel) predicted by the SSP models (coloured points) corresponding to different ages, indicated by the colour bars to the right, are shown. The solid black line indicates the integrated colour measured for UDG 32, and the two dashed lines correspond to the 1σ error. |
According to the hypothesis that UDG 32 formed from the stellar material in the filaments of NGC 3314A, we would expect it to have a similar colour as the galaxy. Therefore, we derived the integrated g − r colour in several regions along the filaments, covering both diffuse emission regions and bright knots (see Fig. 3 and Appendix B). The colour of UDG 32 is fully consistent with the range of colours in the filaments, which is 0.3 ≤ g − r ≤ 0.65 mag (see the top-right panel of Fig. 3). On average, the bright knots in the filaments have bluer colours, with 0 ≤ g − r ≤ 0.5 mag; therefore, these could be star-forming clumps. However, taking into account that the underlying diffuse emission and dust absorption might affect the fluxes in the bright knots, bluer intrinsic colours in these regions can also be expected. On average, the distribution of colours in the filaments does not depend on the distance from the centre of NGC 3314A (see the lower-right panel of Fig. 3).
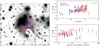 |
Fig. 3. Integrated colours in the stellar filaments of NGC 3314A. Left panel: enlarged portion (4.8 × 4.1 arcmin) of the Hydra I mosaic in the g band centred on NGC 3314A, where the apertures adopted to compute the integrated colours, shown in the right panel, are marked. The three bright stars located SW of the stellar filaments were modelled and subtracted from the image. Blue and red open circles are for bright knots and diffuse regions, respectively. We used circular areas of 5.25 arcsec in radius. This was set on the most extended bright knots to enclose most of the emission. Right panel: colour-magnitude relation (upper panel) for the apertures covering the filaments in NGC 3314A (shown in the left panel) and for the Hydra I UDG 32 (green point). In the lower panel the integrated g − r colours of the filament regions and of Hydra I UDG32 are plotted as a function of the projected distance from the galaxy centre of NGC 3314A. Colours and magnitudes are not corrected for internal dust absorption. |
3. Discussion: Formation scenarios
In this section we discuss how the structural properties of UDG 32 fit within the proposed hypothesis of this system being associated with the stellar filaments of NGC 3314A. The spatial coincidence suggests that it might have formed from the baryons (gas and/or stars) in the filaments or that it is a (foreground or background) UDG in the cluster, projected on top of the stellar filaments. The available data do not allow us to choose between these two equally viable formation channels. However, due to the non-uniform distribution of the UDGs inside the Hydra I cluster (see Fig. C.1), the chance of finding a UDG projected on top of a cluster member is lower (∼9%) in the area around NGC 3314A than in the cluster core (∼50%; see Appendix C for details).
Under the hypothesis that UDG 32 originated from the filaments, the formation mechanism depends on the nature of these structures.
3.1. On the nature of the stellar filaments in NGC 3314A: Ram-pressure stripping versus tidal interaction
The morphology of the filaments and the presence of several bright, possibly star-forming knots resemble those seen in jellyfish galaxies (see Poggianti et al. 2017, and references therein) as well as in spiral galaxies with unwinding arms (Bellhouse et al. 2021). In both cases, the filaments originate from the RPS of the gas in the disk that subsequently formed new stars. Both the HI and radio continuum maps (see Figs. 2 and 3 in McMahon et al. 1992) show emissions elongated in the direction of stellar filaments in NGC 3314A. Ram-pressure stripping due to the interaction with the Hydra I intra-cluster medium, which dominates the cluster core out to about 165 kpc in projected radius (Hayakawa et al. 2006), would explain the alignment, under the assumption that NGC 3314A is part of a group infalling into the cluster potential.
In an alternative scenario, the disturbed morphology of NGC 3314A may be the result of a past tidal interaction with a nearby cluster member, as proposed by McMahon et al. (1992). To explain the asymmetries found in the HI distribution, the authors suggested that NGC 3314A and the giant spiral galaxy NGC 3312 could be members of a weakly interacting group in the foreground of the Hydra I cluster. NGC 3312 is a cluster member at a similar radial velocity as NGC 3314A (ΔVhel = 35 km s−1), located SE of the cluster core (see Fig. 1). VST images show that the disk morphology of NGC 3312 is also quite disturbed, where protruding stellar filaments are detected SW of the disk (see Fig. 1). Ongoing tidal interaction with the background galaxy of the system, NGC 3314B, could be reasonably excluded since this galaxy has an undisturbed morphology and a very different radial velocity (Keel & White 2001). However, a high-speed encounter in the past between the two galaxies or with other cluster members that induced a tidal distortion in the disk of NGC 3314A cannot be excluded. There are two more bright galaxies in the field, NGC 3316 and HCC 008, and the deep VST images reveal a distorted morphology in their outskirts (see Fig. 1). They are cluster members with larger radial velocities (cz ∼ 4000 km s−1; Christlein & Zabludoff 2003). The intra-cluster region between NGC 3312 and NGC 3314A is strongly affected by the residual light from the two bright stars in the cluster core, modelled and removed from the image (see Iodice et al. 2020), which limits the detection of other LSB features as possible remnants of a past interaction between the two galaxies.
3.2. On the origin of UDG 32
Based on the nature of the stellar filaments in NGC 3314A, two possible scenarios are viable for the origin of UDG 32, assuming that these systems are physically connected. If the stellar filaments in NGC 3314A result from RPS, the UDG might have formed from the gas clumps. Alternatively, the UDG might originate from the stripped material (stars and gas) in the filaments that was caused by a tidal interaction of the parent galaxy with other group members in the past.
The possible origin of UDGs from the star-forming clumps of gas in jellyfish galaxies has recently been suggested by Poggianti et al. (2019). To date, no UDGs have been indisputably identified within the filaments of a jellyfish galaxy. The stellar mass of UDG 32 (M ∼ 108 M⊙) is consistent with the stellar mass range (105 − 108 M⊙) of the clumps in jellyfish galaxies (Poggianti et al. 2019). If the UDG originated from RPS, we would expect a young stellar age (107 up to 109 yr, Poggianti et al. 2019) and bluer colours than those observed for UDG 32. However, according to Poggianti et al. (2019), star-forming clumps are affected by moderate extinction due to dust (AV ∼ 0.5 mag). In NGC 3314A, Keel & White (2001) found that the extinction in isolated and well-defined dust clumps reaches AB = 0.4 mag (AV = 0.3 mag), and even larger (AB > 1 mag) in the interspersed dusty arms. Therefore, if UDG 32 formed from the materials in the filaments, dust could be present and their intrinsic colours might be bluer.
Gravitationally bound systems, with a baryonic mass similar to that of dwarf galaxies, could form in the tidally stripped material during galaxy interactions: This is the mechanism proposed for the formation of TDGs, which have been observed in several interacting systems (Duc 2012; Ploeckinger et al. 2018). If the interaction of gas-rich galaxies is recent or ongoing, the TDGs are still star forming and should be blue. In the sample of TDGs studied by Duc et al. (2014), two galaxies have Re and μ0 values consistent with being UDGs (NGC5557-E1 and NGC5557-E2). Their stellar masses (1.2 × 10⁸ M⊙ and 0.15 × 10⁸ M⊙, respectively) are comparable with that of UDG 32 in Hydra I. On the other hand, they have bluer colours (g − r ∼ 0.2–0.4 mag) with respect to UDG 32, significant HI emission, and ongoing star formation.
Assuming that NGC 3314A might have weakly interacted in the past with a cluster member, which induced the formation of the stellar filaments, UDG 32 might originate from the material in the tidal tails of gas and stars. This formation mechanism for UDGs was suggested by Bennet et al. (2018) and recently revisited by Jones et al. (2021). The newly discovered UDGs they studied are clearly associated with stellar streams connected to the parent galaxy, which could result from past galaxy interaction in the group. Both UDGs in that study are very diffuse, have Re of 2.60 and 2.15 kpc, are faint (μ0, g = 26−27 mag arcsec−2), have reddish colours (g − r = 0.4−0.5 mag), and have a low UV emission, suggesting the absence of active star formation. All the above quantities and properties are quite similar to those observed in UDG 32.
As pointed out by Jones et al. (2021), the presence of GCs in UDGs might be a key quantity for determining which of the different formation scenarios is more reliable. Ultra-diffuse galaxies formed as TDGs from RPS gas should not host typical, old GCs. The possible presence of a few old GCs in UDG 32 (see Sect. 2.1), with NGC similar to that found in other UDGs in the cluster (Iodice et al. 2020), would support the possibility that this system is in projection on top of the stellar filaments. It is worth noting that the number of GCs detected in UDG 32 is still consistent with zero, although this represents a lower limit. However, in the tidal stripping scenario also proposed here for the origin of UDG 32, the GCs could be tidally stripped together with the stars. Therefore, it remains a viable formation path for this UDG. The formation mechanism for UDG 32 is unlikely the same as that of UDGs hosting rich GC systems (Beasley & Trujillo 2016; Forbes et al. 2020a), unless the tidal stripping also removed a substantial fraction of its GCs (Bellazzini et al. 2020).
4. Conclusions and perspectives
In this letter we have reported the discovery of a UDG, named UDG 32, that lies within the extended faint stellar filaments of the spiral galaxy NGC 3314A, at ∼40 kpc from the galaxy centre. UDG 32 is one of the faintest and most diffuse galaxies found in the cluster. We investigated the hypothesis that UDG 32 might have formed from the stellar and/or gas material in the filaments.
To the best of our knowledge, the detection of the faint system of stellar filaments extending over ∼50 kpc towards the SW from NGC 3314A from deep VST images of the Hydra I cluster is a new discovery. The origin of the filaments is yet to be explained. We addressed the possibility that the stars in the filaments could have formed in the RPS gas or, alternatively, that the spiral disk of NGC 3314A could have been tidally distorted through an interaction with a cluster member. The above scenarios could provide two possible formation channels for UDG 32: It might have built up from one of the gas clumps resulting from RPS or from the tidal material of interacting galaxies. The rather red colour (g − r = 0.54 ± 0.14 mag) of UDG 32, similar to that in the disk of NGC 3314A, an age older than 1 Gyr, and the possible presence of a few old GCs would be consistent with a moderately evolved stellar content and, therefore, with the tidal formation scenario. Differently from the few other UDGs known in the literature and associated with tidal features, the stellar filaments in NGC 3314A are the most extended LSB structure in which a UDG is clearly detected.
The possibility that UDG 32 is a foreground or background UDG falling in that region of the cluster cannot be ruled out. Follow-up spectroscopy is required to confirm the cluster membership of the newly discovered UDG 32, and thus its physical association with NGC 3314A, and to unveil the nature of the stellar filaments. To probe the physical association of UDG 32 with the filaments in NGC3314A, a homogenous map of the stellar and gas kinematics is needed. The velocity of stripped gas in RPS galaxies can differ from the systemic velocity of the parent galaxy by up to ∼1000 km s−1 (see Bellhouse et al. 2017). Therefore, given the location of the UDG at the outer edge of the stellar filaments, its redshift should be consistent with the possible radial velocity gradient inside the filaments, from the disk of NGC 3314A outwards. From stellar and gas kinematic maps we would also be able to disentangle the RPS from the tidal origin of the stellar filaments in NGC 3314A. In fact, RPS affects only the gas, leaving the stellar components unperturbed (see Poggianti et al. 2017; Gullieuszik et al. 2017).
To date, there have been no detected UDGs formed in RPS filaments; therefore, if confirmed, this would be the first case. The structure of NGC 3314A could be even more complex, that is, tidal forces might have acted in the past and RPS may still be ongoing. This is the scenario proposed to account for the optical and HI structure in NGC 1427A, a member of the Fornax cluster (Lee-Waddell et al. 2018). The new WALLABY data for the Hydra I cluster (Wang et al. 2021) will help to disentangle the nature of the stellar filaments in NGC 3314A.
RA = 159.26775 [deg], Dec = −27.715428 [deg].
This empirical relation was derived for the age range 106 − 1010 yr and for metallicities between Z = 0.0001 and Z = 0.019 Z⊙.
Derived as the flux corresponding to 5σ, with the RMS of the background σ estimated over an empty area of 1 arcsec.
Acknowledgments
We thank the anonymous referee for his/her useful suggestions that helped to improve the paper. E. I. wishes to thank Paolo Serra for extensive discussions. A. L. M. acknowledges the financial support from INAF-OAC. M. C. acknowledges support from MIUR, PRIN 2017 (grant 20179ZF5KS). We acknowledge support from the VST INAF funds. G. D. acknowledges support from CONICYT project Basal AFB-170002. C. S. is supported by an ‘Hintze Fellow’ at the Oxford Centre for Astrophysical Surveys, which is funded through generous support from the Hintze Family Charitable Foundation.
References
- Amorisco, N. C., & Loeb, A. 2016, MNRAS, 459, L51 [NASA ADS] [CrossRef] [Google Scholar]
- Beasley, M. A., & Trujillo, I. 2016, ApJ, 830, 23 [NASA ADS] [CrossRef] [Google Scholar]
- Bellazzini, M., Ibata, R., Malhan, K., et al. 2020, A&A, 636, A107 [CrossRef] [EDP Sciences] [Google Scholar]
- Bellhouse, C., Jaffé, Y. L., Hau, G. K. T., et al. 2017, ApJ, 844, 49 [NASA ADS] [CrossRef] [Google Scholar]
- Bellhouse, C., McGee, S. L., Smith, R., et al. 2021, MNRAS, 500, 1285 [Google Scholar]
- Bennet, P., Sand, D. J., Zaritsky, D., et al. 2018, ApJ, 866, L11 [NASA ADS] [CrossRef] [Google Scholar]
- Bertin, E., & Arnouts, S. 1996, A&AS, 117, 393 [NASA ADS] [CrossRef] [EDP Sciences] [Google Scholar]
- Cantiello, M., D’Abrusco, R., Spavone, M., et al. 2018, A&A, 611, A93 [NASA ADS] [CrossRef] [EDP Sciences] [Google Scholar]
- Cantiello, M., Venhola, A., Grado, A., et al. 2020, A&A, 639, A136 [CrossRef] [EDP Sciences] [Google Scholar]
- Caso, J. P., De Bórtoli, B. J., Ennis, A. I., & Bassino, L. P. 2019, MNRAS, 488, 4504 [CrossRef] [Google Scholar]
- Christlein, D., & Zabludoff, A. I. 2003, ApJ, 591, 764 [NASA ADS] [CrossRef] [Google Scholar]
- Collins, M. L. M., Read, J. I., Ibata, R. A., et al. 2021, MNRAS, 505, 5686 [CrossRef] [Google Scholar]
- Di Cintio, A., Brook, C. B., Dutton, A. A., et al. 2017, MNRAS, 466, L1 [NASA ADS] [CrossRef] [Google Scholar]
- Duc, P.-A. 2012, Astrophys. Space Sci. Proc., 28, 305 [NASA ADS] [CrossRef] [Google Scholar]
- Duc, P.-A., Paudel, S., McDermid, R. M., et al. 2014, MNRAS, 440, 1458 [NASA ADS] [CrossRef] [Google Scholar]
- Ebeling, H., White, D. A., & Rangarajan, F. V. N. 2006, MNRAS, 368, 65 [NASA ADS] [Google Scholar]
- Ferré-Mateu, A., Alabi, A., Forbes, D. A., et al. 2018, MNRAS, 479, 4891 [NASA ADS] [CrossRef] [Google Scholar]
- Forbes, D. A. 2017, MNRAS, 472, L104 [NASA ADS] [CrossRef] [Google Scholar]
- Forbes, D. A., Alabi, A., Romanowsky, A. J., Brodie, J. P., & Arimoto, N. 2020a, MNRAS, 492, 4874 [CrossRef] [Google Scholar]
- Forbes, D. A., Dullo, B. T., Gannon, J., et al. 2020b, MNRAS, 494, 5293 [Google Scholar]
- Forbes, D. A., Gannon, J., Couch, W. J., et al. 2019, A&A, 626, A66 [NASA ADS] [CrossRef] [EDP Sciences] [Google Scholar]
- Gannon, J. S., Dullo, B. T., Forbes, D. A., et al. 2021, MNRAS, 502, 3144 [Google Scholar]
- Gullieuszik, M., Poggianti, B. M., Moretti, A., et al. 2017, ApJ, 846, 27 [NASA ADS] [CrossRef] [Google Scholar]
- Habas, R., Marleau, F. R., Duc, P.-A., et al. 2020, MNRAS, 491, 1901 [Google Scholar]
- Hayakawa, A., Hoshino, A., Ishida, M., et al. 2006, PASJ, 58, 695 [NASA ADS] [Google Scholar]
- Into, T., & Portinari, L. 2013, MNRAS, 430, 2715 [NASA ADS] [CrossRef] [Google Scholar]
- Iodice, E., Capaccioli, M., Grado, A., et al. 2016, ApJ, 820, 42 [NASA ADS] [CrossRef] [Google Scholar]
- Iodice, E., Spavone, M., Capaccioli, M., et al. 2019, A&A, 623, A1 [NASA ADS] [CrossRef] [EDP Sciences] [Google Scholar]
- Iodice, E., Cantiello, M., Hilker, M., et al. 2020, A&A, 642, A48 [EDP Sciences] [Google Scholar]
- Janssens, S. R., Abraham, R., Brodie, J., Forbes, D. A., & Romanowsky, A. J. 2019, ApJ, 887, 92 [CrossRef] [Google Scholar]
- Jones, M. G., Bennet, P., Mutlu-Pakdil, B., et al. 2021, ApJ, submitted, [arXiv:2104.12805] [Google Scholar]
- Keel, W. C., & White, R. E. I. 2001, AJ, 1369, 122 [Google Scholar]
- Koch, A., Burkert, A., Rich, R. M., et al. 2012, ApJ, 755, L13 [NASA ADS] [CrossRef] [Google Scholar]
- Koda, J., Yagi, M., Yamanoi, H., & Komiyama, Y. 2015, ApJ, 807, L2 [NASA ADS] [CrossRef] [Google Scholar]
- Lee-Waddell, K., Serra, P., Koribalski, B., et al. 2018, MNRAS, 474, 1108 [NASA ADS] [CrossRef] [Google Scholar]
- Leisman, L., Haynes, M. P., Janowiecki, S., et al. 2017, ApJ, 842, 133 [NASA ADS] [CrossRef] [Google Scholar]
- Lelli, F., Duc, P.-A., Brinks, E., et al. 2015, A&A, 584, A113 [NASA ADS] [CrossRef] [EDP Sciences] [Google Scholar]
- Lim, S., Peng, E. W., Côté, P., et al. 2018, ApJ, 862, 82 [NASA ADS] [CrossRef] [Google Scholar]
- Lim, S., Côté, P., Peng, E. W., et al. 2020, ApJ, 899, 69 [CrossRef] [Google Scholar]
- Martín-Navarro, I., Romanowsky, A. J., Brodie, J. P., et al. 2019, MNRAS, 484, 3425 [NASA ADS] [CrossRef] [Google Scholar]
- McMahon, P. M., van Gorkom, J. H., Richter, O. G., & Ferguson, H. C. 1992, AJ, 103, 399 [NASA ADS] [CrossRef] [Google Scholar]
- Misgeld, I., Mieske, S., & Hilker, M. 2008, A&A, 486, 697 [NASA ADS] [CrossRef] [EDP Sciences] [Google Scholar]
- Montes, M., Infante-Sainz, R., Madrigal-Aguado, A., et al. 2020, ApJ, 904, 114 [Google Scholar]
- Müller, O., Jerjen, H., & Binggeli, B. 2018, A&A, 615, A105 [NASA ADS] [CrossRef] [EDP Sciences] [Google Scholar]
- Müller, O., Rich, R. M., Román, J., et al. 2019, A&A, 624, L6 [NASA ADS] [CrossRef] [EDP Sciences] [Google Scholar]
- Pandya, V., Romanowsky, A. J., Laine, S., et al. 2018, ApJ, 858, 29 [NASA ADS] [CrossRef] [Google Scholar]
- Peng, Y.-J., Lilly, S. J., Kovač, K., et al. 2010, ApJ, 721, 193 [NASA ADS] [CrossRef] [Google Scholar]
- Peng, E. W., Ferguson, H. C., Goudfrooij, P., et al. 2011, ApJ, 730, 23 [Google Scholar]
- Ploeckinger, S., Sharma, K., Schaye, J., et al. 2018, MNRAS, 474, 580 [NASA ADS] [CrossRef] [Google Scholar]
- Poggianti, B. M., Moretti, A., Gullieuszik, M., et al. 2017, ApJ, 844, 48 [Google Scholar]
- Poggianti, B. M., Gullieuszik, M., Tonnesen, S., et al. 2019, MNRAS, 482, 4466 [Google Scholar]
- Prole, D. J., Hilker, M., van der Burg, R. F. J., et al. 2019a, MNRAS, 484, 4865 [CrossRef] [Google Scholar]
- Prole, D. J., van der Burg, R. F. J., Hilker, M., & Davies, J. I. 2019b, MNRAS, 488, 2143 [NASA ADS] [Google Scholar]
- Rejkuba, M. 2012, Ap&SS, 341, 195 [NASA ADS] [CrossRef] [Google Scholar]
- Román, J., & Trujillo, I. 2017, MNRAS, 468, 703 [NASA ADS] [CrossRef] [Google Scholar]
- Rong, Y., Guo, Q., Gao, L., et al. 2017, MNRAS, 470, 4231 [NASA ADS] [CrossRef] [Google Scholar]
- Rong, Y., Mancera Piña, P. E., Tempel, E., Puzia, T. H., & De Rijcke, S. 2020, MNRAS, 498, L72 [Google Scholar]
- Sales, L. V., Navarro, J. F., Peñafiel, L., et al. 2020, MNRAS, 494, 1848 [CrossRef] [Google Scholar]
- Shi, D. D., Zheng, X. Z., Zhao, H. B., et al. 2017, ApJ, 846, 26 [NASA ADS] [CrossRef] [Google Scholar]
- Spavone, M., Capaccioli, M., Napolitano, N. R., et al. 2017, A&A, 603, A38 [NASA ADS] [CrossRef] [EDP Sciences] [Google Scholar]
- Tremmel, M. J., Wright, A., Munshi, F., et al. 2019, Am. Astron. Soc. Meeting Abstr., 233, 416.04 [Google Scholar]
- van der Burg, R. F. J., Hoekstra, H., Muzzin, A., et al. 2017, A&A, 607, A79 [NASA ADS] [CrossRef] [EDP Sciences] [Google Scholar]
- van Dokkum, P. G., Romanowsky, A. J., Abraham, R., et al. 2015, ApJ, 804, L26 [NASA ADS] [CrossRef] [Google Scholar]
- van Dokkum, P., Abraham, R., Brodie, J., et al. 2016, ApJ, 828, L6 [NASA ADS] [CrossRef] [Google Scholar]
- van Dokkum, P., Danieli, S., Cohen, Y., et al. 2018, Nature, 555, 629 [NASA ADS] [CrossRef] [Google Scholar]
- van Dokkum, P., Wasserman, A., Danieli, S., et al. 2019, ApJ, 880, 91 [CrossRef] [Google Scholar]
- Vazdekis, A., Ricciardelli, E., Cenarro, A. J., et al. 2012, MNRAS, 424, 157 [NASA ADS] [CrossRef] [Google Scholar]
- Venhola, A., Peletier, R., Laurikainen, E., et al. 2017, A&A, 608, A142 [NASA ADS] [CrossRef] [EDP Sciences] [Google Scholar]
- Villegas, D., Jordán, A., Peng, E. W., et al. 2010, ApJ, 717, 603 [Google Scholar]
- Wang, J., Staveley-Smith, L., Westmeier, T., et al. 2021, ApJ, 915, 70 [Google Scholar]
Appendix A: Archival data for NGC3314AB
In Fig. A.1 the ACS/HST and GALEX archival data for NGC 3314AB are shown. The ACS/HST mosaic is in the F606W filter. It covers a total area of 5.28′×3.67′ and has a total integration of 18hrs. The GALEX data cover an area of ∼1 deg2, and the FUV emission has a total integration time of 261 sec.
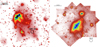 |
Fig. A.1. GALEX FUV emission in the region centred on NGC 3314AB of 6.44′×6.04′ (left panel) and ACS/HST stacked mosaic (∼5.28′×3.67′) of NGC 3314AB in the F606W filter (right panel). The FUV image has been treated with ASMOOTH (Ebeling et al. 2006), selecting a S/N above the background of τmin = 1.5. The region of UDG 32 (marked with the empty black circle in both panels) is outside the ACS/HST mosaic. |
Appendix B: Surface photometry and structural parameters for UDG 32
In this section we describe the main steps adopted to derive the surface photometry and the structural parameters for UDG 32. As described by Iodice et al. (2020), the observing strategy and data reduction adopted for Hydra I are optimised to study galaxies and features in the LSB regime. The long integration times (2.8 hours and 3.22 hours in the g and r bands, respectively) allowed integrated magnitude sensitivities4 of mg = 28.6 ± 0.2 mag and mr = 28.1 ± 0.2 mag to be reached. The observations used in this work were acquired with the step-dither observing strategy, which guarantees an accurate estimate of the sky background (see e.g. Iodice et al. 2016; Venhola et al. 2017). Therefore, the final reduced mosaics for the Hydra I cluster are already sky-subtracted. In addition, since in the area of this cluster there is a bright (seventh-magnitude) foreground star on the NE side of the cluster core, during the data acquisition we took special care to always put this star in one of the two wide OmegaCam gaps, thereby reducing the scattered light. The residual light from this bright star was modelled and subtracted from the mosaic in both bands. The light distribution of the second brightest star in the field, located SE of the core, was also modelled and subtracted from the parent image (see Fig. 1 in Iodice et al. 2020). On the residual image, we analysed the SE region of the cluster, where NGC 3314A and UDG 32 are located (see Fig. 1).
The main steps of the photometry, deriving surface brightness profiles, colour profiles, and integrated magnitudes and colours, are extensively described in many VEGAS papers (see Iodice et al. 2016; Spavone et al. 2017; Iodice et al. 2019, and references therein). In short, we estimated the residual sky fluctuations around each galaxy of the cluster out to the most extended radius and, therefore, the corresponding limiting radius (Rlim) where the galaxy light blends into this residual sky. During this process, all bright (background and foreground) sources, including the artefacts derived from the modelling of the brightest stars in the field, were masked and excluded from the analysis.
In the case of UDG 32, we proceeded in two steps. Firstly, we estimated the average background at large distances from the centre of NGC 3314A, which starts to dominate at Rlim ≥ 120 arcsec, and we estimated the RMS scatter to be ∼20% and ∼15% in the g and r bands, respectively. Since UDG 32 is located on top of the stellar filaments of NGC 3314A, the diffuse light from the filaments also contributes to the integrated light of this object. Therefore, in order to account for this contribution, a local background value around UDG 32 is required. This was computed in a circular annulus of 20 ≤ R ≤ 40 arcsec centred on the UDG (see the lower-right panel of Fig. 1). The local background was then adopted to estimate the integrated magnitudes and colours, as well as the surface brightness profiles derived for UDG 32, reported in this work.
The background value derived around NGC 3314A was used to compute the integrated magnitudes of the regions in the stellar filaments (see Sect. 2). In fact, the local background around each of them cannot be considered, since it coincides with the flux that we aim at measuring.
Using the same analysis and technique presented by Iodice et al. (2020), for UDG 32, as well as for all the new LSB candidates detected in the Hydra I cluster, we: (i) measured the total magnitudes, as aperture photometry for R ≤ Rlim, and the average g − r colours and (ii) derived the structural parameters by fitting the 2D light distribution, in the g band, with GALFIT (Peng et al. 2010), adopting a single Sersic function. In Fig. B.1 we show the colour-magnitude relation and the structural parameters for the whole sample of UDGs, including UDG 32, and dwarf galaxies in the Hydra I cluster. For UDG 32, as for all UDGs in the sample, we adopted the cluster distance of 51 ± 6 Mpc. Assuming that UDG 32 is physically associated with NGC 3314A, which has a distance of ∼37.3 Mpc (Christlein & Zabludoff 2003), we obtain Re = 2.5 ± 1 kpc. Figure B.1 shows that this estimate of Re is still consistent with the average values derived for the other UDGs in the sample, which have similar faint surface brightnesses and large sizes 2 ≤ Re ≤ 3 kpc. For UDG 32, the 2D model and residuals obtained by GALFIT are shown in Fig. B.2.
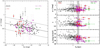 |
Fig. B.1. Structural parameters for UDGs in the Hydra I cluster. Left panel: Colour-magnitude relation (CMR) for the full sample of dwarf galaxies (black points) detected in the VST Hydra I mosaic (Iodice et al. 2020) and from Misgeld et al. (2008). Red filled circles indicate the UDG candidates found by Iodice et al. (2020). The solid black line is the CMR for the Hydra I cluster early-type galaxies derived by (dashed lines indicate the 1σ scatter Misgeld et al. 2008). The magenta filled circles are the new UDGs detected in the cluster. The green point indicates UDG 32. Right panels: Structural and photometric parameters for the newly discovered UDGs (filled magenta circles) and for UDG 32 in the filament of NGC 3314A (filled green circles) as a function of the effective radius. The UDGs previously presented by Iodice et al. (2020) are marked with red circles. The UDG definition criteria, Re ≥ 1.5 kpc and μ0 ≥ 24 mag/arcsec2 (van Dokkum et al. 2015), are shown by the dashed lines. The black points are the dwarf galaxies in Hydra I from Misgeld et al. (2008) and Iodice et al. (2020). The vertical shaded region indicates the range of uncertainty on Re. |
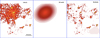 |
Fig. B.2. Results from the 2D fit of the light distribution for UDG 32, in the g band, with the GALFIT tool (Peng et al. 2010). The parent image is shown in the left panel. The 2D model and residuals are shown in the middle and right panels, respectively. Bright stars as well as foreground and background objects are masked and excluded from the fit. |
Appendix C: 2D number density distribution of UDGs in Hydra I
Figure C.1 shows the 2D number density distribution of all UDGs detected in Hydra I. The smoothed distribution is obtained by convolving the galaxy distribution with a Gaussian kernel with a standard deviation of σ = 5 arcmin. This suggests that UDGs in Hydra I are not uniformly distributed: The UDG distribution peaks close to the cluster core, and a lower number density is found at larger cluster-centric radii. Based on this evidence, we derived the probability of finding a UDG in a circle of fixed area as a function of the number density levels. Therefore, we defined a circle that covers the whole extension of the NGC 3314A stellar filaments with a radius of 0.0272 deg and a total area of Atail = 0.00232 deg2, centred on R.A. = 159.28 Dec. = -27.71 deg. The probability of finding a UDG within Atail is derived inside each density level as NUDGs × Areatails/Areatotal, where ATOT is the total area between the two contiguous contours. The probability values are plotted in the right panel of Fig. C.1. In the region of the cluster where UDG 32 is located, ATOT = 0.275 deg2, and the total number of UDGs inside this level is 11. Therefore, assuming that they are randomly distributed inside it, the probability in this region is ∼9.3%.
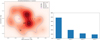 |
Fig. C.1. Projected distribution of UDGs in the Hydra I cluster. Left panel: 2D distribution of UDGs in the Hydra I cluster. The peak of the UDG density distribution is close to the core of the cluster, where the two brightest cluster galaxies, NGC 3311 and NGC 3309, are shown with the two black triangles. A lower number density is found at larger cluster-centric radii. All UDGs are marked as grey circles. The black square and open black circle mark the position of UDG 32 and the region of NGC 3314A. The two brightest stars in the field are marked with magenta points. The solid coloured lines represent the density contours. Right panel: Probability histogram of finding a UDG inside an area of 0.00232 deg2 (assumed to cover the extension of NGC3314A and its stellar filaments; see text for details), as a function of the UDGs number density. Each level of the UDG number density is also shown in the left panel. |
Appendix D: Search for globular clusters around UDG 32
To detect candidate GCs around UDG 32, we adopted the same procedure and assumptions to identify old GCs as for the first sample of UDGs in Hydra I, described by Iodice et al. (2020) and more extensively presented in Cantiello et al. (2018, 2020). In short, we ran SEXTRACTOR on a large image cutout of ∼10.5′×9.5′, in the g and r bands, where the model distribution of the UDG has been subtracted. For each source, and in each band, we derived the automated aperture magnitude (MAG_AUTO) to estimate the total magnitude of the source and the aperture magnitude within a four- and six-pixel diameter (MAG_APER) to estimate its g − r[6 pixels] colour and the concentration index (as CIX = MAG_APERX[4pixel]−MAG_APERX[6pixel]), which is an indicator of source compactness (Peng et al. 2011). To identify GC candidates, we selected sources with: i)g-band magnitude s23.5 ≤ mg ≤ 26 mag, the expected range between the turn-over magnitudes (TOMs) of the GC luminosity function (GCLF) and 3σGCLF mag brighter (Villegas et al. 2010); ii) 0.25 ≤ g − r ≤ 1.25 mag; iii) SEXTRACTORCLASS_STAR ≥ 0.4; iv) elongation (i.e. major-to-minor axis ratio) ≤2 in both bands; and v)CIX within ±0.1 mag of the sequence of local point sources.
We find that the number of GC candidates over the ∼10.5′×9.5′ area around the UDG is ∼3.0 ± 3 arcmin−2. The total number of GCs (NGC) was derived within 1.5 Re, adopting the approach suggested by van Dokkum et al. (2016), and also within 3 and 5Re, the higher value being close to the upper limit for bound systems (Forbes 2017; Caso et al. 2019). All estimates were corrected for the contamination of foreground stars, background galaxies, and possible intra-cluster GCs, which is ∼3 sources/arcmin2, derived in the regions between 5′≤R ≤ 10′ around the UDG. Since the photometry reaches roughly the TOM peak, and assuming the GCLF is a also Gaussian in UDGs (e.g. Rejkuba 2012; van Dokkum et al. 2016), we derived NGC as twice the background-corrected GC density over the 3 and 5Re area of the UDG, times the area. The only difference with the NGC within 1.5 Re is that it is assumed that only half of the GC population is within 1.5 Re, and hence the total population is estimated as four times the background-corrected GC density over 1.5 Re area, times the area. Therefore, we find 0 ≤ NGC ≤ 6 within all assumed radii. A similar value for NGC was also found using more stringent criteria (0.4 ≤ g − r ≤ 1.1 mag, CLASS_STAR≥0.6, CIX within ±0.05 mag). In particular, we identify a compact source near the centre of the UDG (at ∼3.5″), with colour, magnitude, and compactness properties close to what is expected for GCs (g − r ∼ 0.6 mag, mg ∼ 24.9, CLASS_STAR∼0.9 in both bands, and CIX consistent with the stellar sequence within ≤0.05 mag).
All Figures
|
Fig. 1. VST images in the g band for the SE group of the Hydra I cluster and of NGC3314 AB. The top-left panel shows the extracted region of the VST mosaic (16.2 × 13.8 arcmin), in the g band, in the SE part of the Hydra I cluster. The brightest galaxy members, NGC 3312, NGC 3314AB, NGC 3316, and HCC 008, are marked. The dashed lines SW of NGC 3312 indicate the region where stellar filaments are detected. The light of the bright stars in the field has been modelled and subtracted from the reduced images (see also Iodice et al. 2020). North is up, and east is to the left. The black square is the region (6.44 × 6.04 arcmin) around the galaxies NGC 3314AB that is shown as a gr colour composite in the top-right panel. The dashed orange box indicates the region around the UDG 32 candidate, in the SW regions of NGC 3314AB, described in the text and shown as a g-band image (4.8 × 4.1 arcmin) in the lower-right panel. The dashed circular annulus indicates the region where we estimated the local background (see text for details). In the lower-right panel we show the azimuthally averaged surface brightness profile in the g band of UDG 32 compared with the best-fit Sersic law (solid red line). The colour g − r profile is shown in the lower-left sub-panels. |
| In the text | |
|
Fig. 2. E-MILES single stellar population (SSP) synthesis models. The g − r colours versus metallicity (left panel) and M/L ratio (right panel) predicted by the SSP models (coloured points) corresponding to different ages, indicated by the colour bars to the right, are shown. The solid black line indicates the integrated colour measured for UDG 32, and the two dashed lines correspond to the 1σ error. |
| In the text | |
|
Fig. 3. Integrated colours in the stellar filaments of NGC 3314A. Left panel: enlarged portion (4.8 × 4.1 arcmin) of the Hydra I mosaic in the g band centred on NGC 3314A, where the apertures adopted to compute the integrated colours, shown in the right panel, are marked. The three bright stars located SW of the stellar filaments were modelled and subtracted from the image. Blue and red open circles are for bright knots and diffuse regions, respectively. We used circular areas of 5.25 arcsec in radius. This was set on the most extended bright knots to enclose most of the emission. Right panel: colour-magnitude relation (upper panel) for the apertures covering the filaments in NGC 3314A (shown in the left panel) and for the Hydra I UDG 32 (green point). In the lower panel the integrated g − r colours of the filament regions and of Hydra I UDG32 are plotted as a function of the projected distance from the galaxy centre of NGC 3314A. Colours and magnitudes are not corrected for internal dust absorption. |
| In the text | |
|
Fig. A.1. GALEX FUV emission in the region centred on NGC 3314AB of 6.44′×6.04′ (left panel) and ACS/HST stacked mosaic (∼5.28′×3.67′) of NGC 3314AB in the F606W filter (right panel). The FUV image has been treated with ASMOOTH (Ebeling et al. 2006), selecting a S/N above the background of τmin = 1.5. The region of UDG 32 (marked with the empty black circle in both panels) is outside the ACS/HST mosaic. |
| In the text | |
|
Fig. B.1. Structural parameters for UDGs in the Hydra I cluster. Left panel: Colour-magnitude relation (CMR) for the full sample of dwarf galaxies (black points) detected in the VST Hydra I mosaic (Iodice et al. 2020) and from Misgeld et al. (2008). Red filled circles indicate the UDG candidates found by Iodice et al. (2020). The solid black line is the CMR for the Hydra I cluster early-type galaxies derived by (dashed lines indicate the 1σ scatter Misgeld et al. 2008). The magenta filled circles are the new UDGs detected in the cluster. The green point indicates UDG 32. Right panels: Structural and photometric parameters for the newly discovered UDGs (filled magenta circles) and for UDG 32 in the filament of NGC 3314A (filled green circles) as a function of the effective radius. The UDGs previously presented by Iodice et al. (2020) are marked with red circles. The UDG definition criteria, Re ≥ 1.5 kpc and μ0 ≥ 24 mag/arcsec2 (van Dokkum et al. 2015), are shown by the dashed lines. The black points are the dwarf galaxies in Hydra I from Misgeld et al. (2008) and Iodice et al. (2020). The vertical shaded region indicates the range of uncertainty on Re. |
| In the text | |
|
Fig. B.2. Results from the 2D fit of the light distribution for UDG 32, in the g band, with the GALFIT tool (Peng et al. 2010). The parent image is shown in the left panel. The 2D model and residuals are shown in the middle and right panels, respectively. Bright stars as well as foreground and background objects are masked and excluded from the fit. |
| In the text | |
|
Fig. C.1. Projected distribution of UDGs in the Hydra I cluster. Left panel: 2D distribution of UDGs in the Hydra I cluster. The peak of the UDG density distribution is close to the core of the cluster, where the two brightest cluster galaxies, NGC 3311 and NGC 3309, are shown with the two black triangles. A lower number density is found at larger cluster-centric radii. All UDGs are marked as grey circles. The black square and open black circle mark the position of UDG 32 and the region of NGC 3314A. The two brightest stars in the field are marked with magenta points. The solid coloured lines represent the density contours. Right panel: Probability histogram of finding a UDG inside an area of 0.00232 deg2 (assumed to cover the extension of NGC3314A and its stellar filaments; see text for details), as a function of the UDGs number density. Each level of the UDG number density is also shown in the left panel. |
| In the text | |
Current usage metrics show cumulative count of Article Views (full-text article views including HTML views, PDF and ePub downloads, according to the available data) and Abstracts Views on Vision4Press platform.
Data correspond to usage on the plateform after 2015. The current usage metrics is available 48-96 hours after online publication and is updated daily on week days.
Initial download of the metrics may take a while.