Fig. 1.
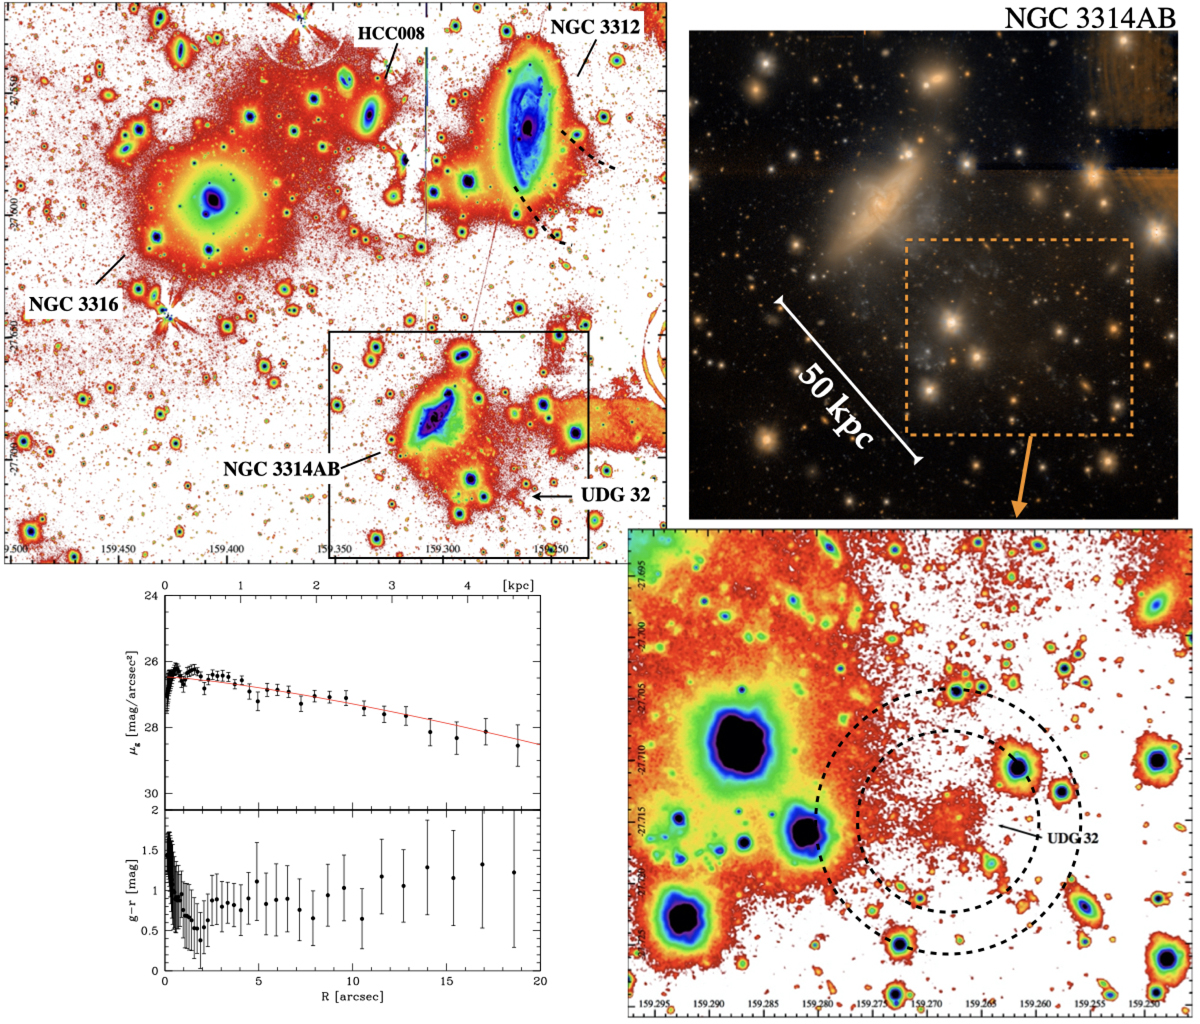
VST images in the g band for the SE group of the Hydra I cluster and of NGC3314 AB. The top-left panel shows the extracted region of the VST mosaic (16.2 × 13.8 arcmin), in the g band, in the SE part of the Hydra I cluster. The brightest galaxy members, NGC 3312, NGC 3314AB, NGC 3316, and HCC 008, are marked. The dashed lines SW of NGC 3312 indicate the region where stellar filaments are detected. The light of the bright stars in the field has been modelled and subtracted from the reduced images (see also Iodice et al. 2020). North is up, and east is to the left. The black square is the region (6.44 × 6.04 arcmin) around the galaxies NGC 3314AB that is shown as a gr colour composite in the top-right panel. The dashed orange box indicates the region around the UDG 32 candidate, in the SW regions of NGC 3314AB, described in the text and shown as a g-band image (4.8 × 4.1 arcmin) in the lower-right panel. The dashed circular annulus indicates the region where we estimated the local background (see text for details). In the lower-right panel we show the azimuthally averaged surface brightness profile in the g band of UDG 32 compared with the best-fit Sersic law (solid red line). The colour g − r profile is shown in the lower-left sub-panels.
Current usage metrics show cumulative count of Article Views (full-text article views including HTML views, PDF and ePub downloads, according to the available data) and Abstracts Views on Vision4Press platform.
Data correspond to usage on the plateform after 2015. The current usage metrics is available 48-96 hours after online publication and is updated daily on week days.
Initial download of the metrics may take a while.