Fig. 2.
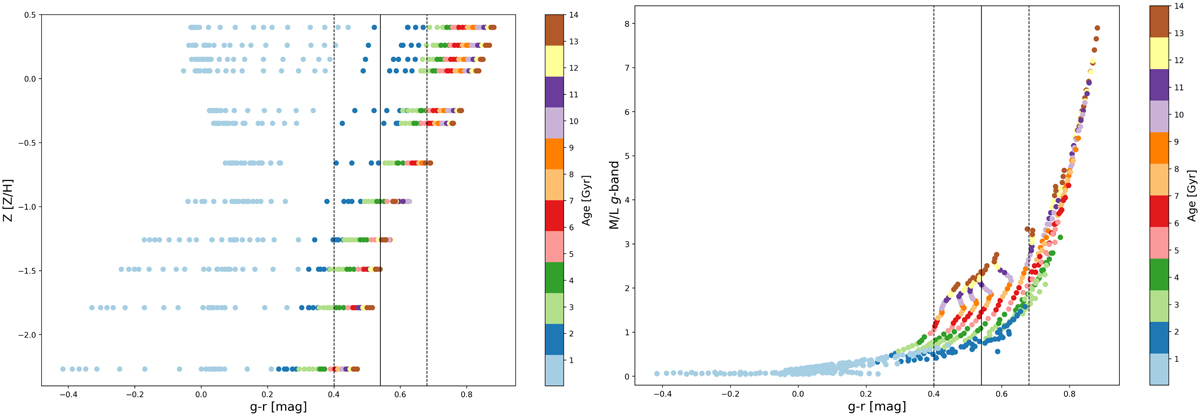
E-MILES single stellar population (SSP) synthesis models. The g − r colours versus metallicity (left panel) and M/L ratio (right panel) predicted by the SSP models (coloured points) corresponding to different ages, indicated by the colour bars to the right, are shown. The solid black line indicates the integrated colour measured for UDG 32, and the two dashed lines correspond to the 1σ error.
Current usage metrics show cumulative count of Article Views (full-text article views including HTML views, PDF and ePub downloads, according to the available data) and Abstracts Views on Vision4Press platform.
Data correspond to usage on the plateform after 2015. The current usage metrics is available 48-96 hours after online publication and is updated daily on week days.
Initial download of the metrics may take a while.