Fig. 3.

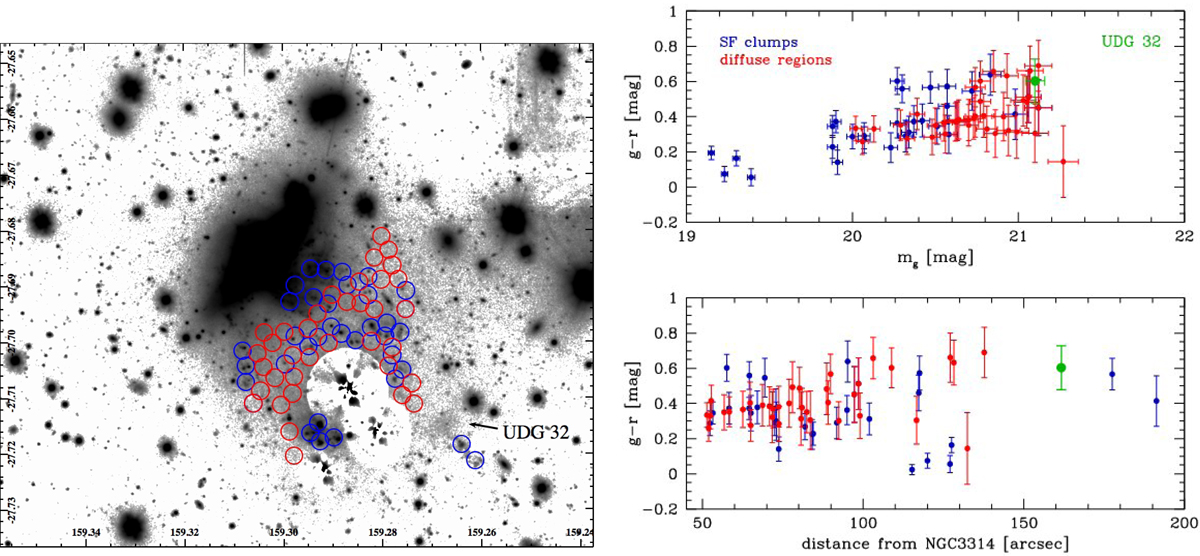
Integrated colours in the stellar filaments of NGC 3314A. Left panel: enlarged portion (4.8 × 4.1 arcmin) of the Hydra I mosaic in the g band centred on NGC 3314A, where the apertures adopted to compute the integrated colours, shown in the right panel, are marked. The three bright stars located SW of the stellar filaments were modelled and subtracted from the image. Blue and red open circles are for bright knots and diffuse regions, respectively. We used circular areas of 5.25 arcsec in radius. This was set on the most extended bright knots to enclose most of the emission. Right panel: colour-magnitude relation (upper panel) for the apertures covering the filaments in NGC 3314A (shown in the left panel) and for the Hydra I UDG 32 (green point). In the lower panel the integrated g − r colours of the filament regions and of Hydra I UDG32 are plotted as a function of the projected distance from the galaxy centre of NGC 3314A. Colours and magnitudes are not corrected for internal dust absorption.
Current usage metrics show cumulative count of Article Views (full-text article views including HTML views, PDF and ePub downloads, according to the available data) and Abstracts Views on Vision4Press platform.
Data correspond to usage on the plateform after 2015. The current usage metrics is available 48-96 hours after online publication and is updated daily on week days.
Initial download of the metrics may take a while.


