Fig. C.1.
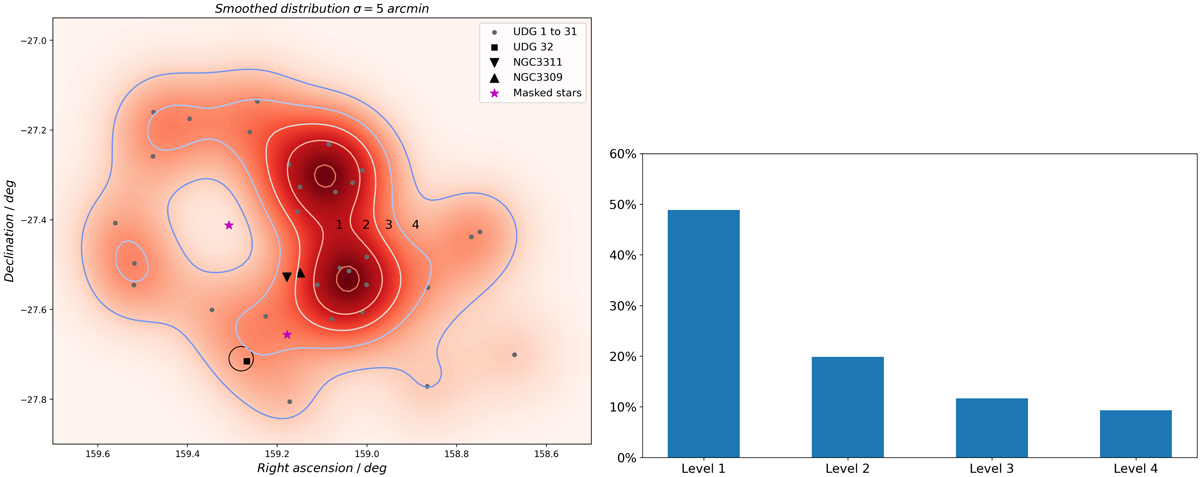
Projected distribution of UDGs in the Hydra I cluster. Left panel: 2D distribution of UDGs in the Hydra I cluster. The peak of the UDG density distribution is close to the core of the cluster, where the two brightest cluster galaxies, NGC 3311 and NGC 3309, are shown with the two black triangles. A lower number density is found at larger cluster-centric radii. All UDGs are marked as grey circles. The black square and open black circle mark the position of UDG 32 and the region of NGC 3314A. The two brightest stars in the field are marked with magenta points. The solid coloured lines represent the density contours. Right panel: Probability histogram of finding a UDG inside an area of 0.00232 deg2 (assumed to cover the extension of NGC3314A and its stellar filaments; see text for details), as a function of the UDGs number density. Each level of the UDG number density is also shown in the left panel.
Current usage metrics show cumulative count of Article Views (full-text article views including HTML views, PDF and ePub downloads, according to the available data) and Abstracts Views on Vision4Press platform.
Data correspond to usage on the plateform after 2015. The current usage metrics is available 48-96 hours after online publication and is updated daily on week days.
Initial download of the metrics may take a while.