| Issue |
A&A
Volume 652, August 2021
|
|
|---|---|---|
| Article Number | A44 | |
| Number of page(s) | 18 | |
| Section | Extragalactic astronomy | |
| DOI | https://doi.org/10.1051/0004-6361/202039976 | |
| Published online | 06 August 2021 | |
The role of AGN feedback in the structure, kinematics, and evolution of ETGs in Horizon simulations
1
Departamento de Matemática. Facultad de Ciencias Exactas y Naturales. Universidad de Buenos Aires. Pabellón I. Ciudad Universitaria, C1428EGA Buenos Aires, Argentina
e-mail: This email address is being protected from spambots. You need JavaScript enabled to view it.
2
Departamento Física Teórica, Universidad Autónoma de Madrid, 28049 Cantoblanco, Madrid, Spain
3
Instituto de Astronomía y Física del Espacio, CONICET-UBA. 1428, Buenos Aires, Argentina
4
Instituto de Astrofísica, Pontificia Universidad Católica, Av. Vicuña Mackenna 4860, Santiago, Chile
5
Centro de Astro-Ingeniería, Pontificia Universidad Católica de Chile, Av. Vicuña Mackenna 4860, Santiago, Chile
6
Institute for Theoretical Physics, Utrecht University, Princetonplein 5, 3584 CC, Utrecht, The Netherlands
7
Universidad Autónoma de Madrid, 28049 Cantoblanco, Madrid, Spain
8
Institut d’Astrophysique de Paris, CNRS & Sorbonne Université, UMR 7095, 98 bis Boulevard Arago, 75014 Paris, France
9
Université Côte d’Azur, Observatoire de la Côte d’Azur, CNRS, Laboratoire Lagrange, Bd. de l’observatoire, 06304 Nice, France
10
Department of Physics, University of Oxford, Keble Road, Oxford OX1 3RH, UK
11
Korea Institute for Advanced Study, 85 Hoegiro, Dongdaemun-gu, Seoul 02455, Republic of Korea
Received:
23
November
2020
Accepted:
18
May
2021
Abstract
Context. Feedback processes play a fundamental role in the regulation of the star formation (SF) activity in galaxies and, in particular, in the quenching of early-type galaxies (ETGs) as has been inferred by observational and numerical studies of Λ-CDM models. At z = 0, ETGs exhibit well-known fundamental scaling relations, but the connection between scaling relations and the physical processes shaping ETG evolution remains unknown.
Aims. This work aims to study the impact of the energetic feedback due to active galactic nuclei (AGN) on the formation and evolution of ETGs. We focus on assessing the impact of AGN feedback on the evolution of the mass–plane and the fundamental plane (FP; defined using mass surface density) as well as on morphology, kinematics, and stellar age across the FP.
Methods. The Horizon-AGN and Horizon-noAGN cosmological hydrodynamical simulations were performed with identical initial conditions, including the same physical processes except for the activation of the AGN feedback in the former. We selected a sample of central ETGs from both simulations using the same criteria and exhaustively studied their SF activity, kinematics, and scaling relations for z ≤ 3.
Results. We find that Horizon-AGN ETGs identified at z = 0 follow the observed fundamental scaling relations (mass–plane, FP, and mass–size relation) and qualitatively reproduce kinematic features albeit conserving a rotational inner component with a mass fraction regulated by the AGN feedback. We discover that AGN feedback seems to be required to reproduce the bimodality in the spin parameter distribution reported by observational works and the mass–size relation; more massive galaxies have older stellar populations, larger sizes, and are slower rotators. We study the evolution of the fundamental relations with redshift, finding a mild evolution of the mass–plane of Horizon-AGN ETGs for z < 1, whereas a stronger change is detected for z > 1. The ETGs in Horizon-noAGN show a strong systematic redshift evolution of the mass–plane. The FP of Horizon-AGN ETGs agrees with observations at z = 0. When AGN feedback is switched off, a fraction of galaxies depart from the expected FP at all analysed redshifts owing to the presence of a few extended galaxies with an excess of stellar surface density. We find that AGN feedback regulates the SF activity as a function of stellar mass and redshift being able to reproduce the observed relations. Our results show the impact of AGN feedback on the mass-to-light ratio (M/L) and its relation with the tilt of the luminosity FP (L-FP; defined using the averaged surface brightness). Overall, AGN feedback has an impact on the regulation of the SF activity, size, stellar surface density, stellar ages, rotation, and masses of ETGs that is reflected on the fundamental relations, particularly on the FP. We detect a dependence of the FP on stellar age and galaxy morphology that evolves with redshfit. The characteristics of the galaxy distribution on the FP according to these properties change drastically by z ∼ 1 in Horizon-AGN and hence this feature could provide further insight into the action of AGN feedback.
Key words: galaxies: elliptical and lenticular, cD / galaxies: evolution / galaxies: fundamental parameters / galaxies: kinematics and dynamics
© ESO 2021
1. Introduction
In the current cosmological paradigm, a number of complex processes, such as major and/or minor mergers, secular evolution, and other interactions or environmental effects contribute to shaping the morphology of galaxies (e.g., Tissera et al. 2012; Avila-Reese et al. 2014; Somerville & Davé 2015; Rodriguez-Gomez et al. 2016; Dubois et al. 2016, and references therein) and, particularly, ellipticals or early-type galaxies (ETGs). The general picture for ETG formation considers various scenarios to explain their observed variety of properties (e.g., Kormendy 2016). Some analytical models (Solar et al. 2020), as well as N-body simulations (Wechsler et al. 2002; Zhao et al. 2003), have shown that two different phases can be distinguished along halo mass assembly: first, a violent, fast phase that has high-mass aggregation rates (i.e., merger rates); and later on, a slow phase, in which the mass aggregation rates are much lower. Subsequent numerical works agree with this scenario and its implications for the properties of massive galactic objects at low z (e.g., Domínguez-Tenreiro et al. 2006, 2011; Oser et al. 2010; Cook et al. 2009). Instead, Naab et al. (2013) proposes two phases: an in situ star formation (SF) at high redshift, followed by minor mergers that allow the accretion of stars from other galaxies at later stages. More recently, Clauwens et al. (2018) distinguish three different formation phases as a function of stellar mass in galaxies from the EAGLE simulation (Crain et al. 2015; Schaye et al. 2015). These authors conclude that low-mass galaxies grow as a result of in situ SF caused partially by mergers and present random stellar motion. Intermediate-mass galaxies are mostly disc-dominated. Finally, in high-mass galaxies, in situ SF becomes less important and they are more spheroidal. Feedback processes are essential to regulate the SF, and therefore to explain the quenching of ETGs (e.g., Burkert 2004; Hayward & Hopkins 2016; Dubois et al. 2016). In particular, the importance of active galactic nuclei (AGN) feedback for regulating the growth and SF for massive galaxies has been extensively discussed in numerical simulations (Crain et al. 2009; Schaye et al. 2010; Haas et al. 2013; Somerville & Davé 2015; Rosas-Guevara et al. 2016). These simulations implement more sophisticated modelling, which leads to more realistic quenched massive elliptical galaxies (e.g., Pillepich et al. 2018; Habouzit et al. 2019).
A remarkable characteristic of ETGs is that they determine clear scaling relations. The fundamental plane (FP; Faber et al. 1987; Dressler et al. 1987; Djorgovski & Davis 1987) links size, velocity dispersion, and luminosity (e.g., Mo et al. 2010). Under some assumptions, such as homology and constant mass-to-light ratio (M/L), the virial theorem can provide a physical interpretation for the FP (e.g., Binney & Tremaine 1987). However, the observed parameters of this plane are tilted from virial predictions (e.g., Bernardi et al. 2003; Hyde & Bernardi 2009; Cappellari et al. 2013a; Saulder et al. 2013). This tilt has been a matter of controversy, which has fostered various explanations such as the variation of the M/L (Faber et al. 1987), non-homology in the surface brightness distribution (e.g., Prugniel & Simien 1997; Graham & Colless 1997; Bertin et al. 2002; Trujillo et al. 2004), or variation in the fraction of dark matter (e.g., Renzini & Ciotti 1993; Ciotti et al. 1996; Borriello et al. 2003). Cappellari (2016) reports that the expected virial relation is recovered when the surface brightness is replaced by the dynamical mass. Based on hydrodynamical simulations in a cosmological context, Oñorbe et al. (2005, 2006) analysed the FP of massive galaxies and find a tilt from the virial parameters at galactic scales, whereas, at halo scales, the virial relations hold. These authors claim that the tilt originates at high redshift (Oñorbe et al. 2011) and that it only shows a mild evolution after z ∼ 1.5 (Domínguez-Tenreiro et al. 2006), presumably owing to a spatial homology breaking. This is associated with a systematic decrease with increasing galaxy mass of the relative amount of dissipation experienced by the baryonic mass component during mass assembly (see also Taranu et al. 2015).
Recently Lu et al. (2020) analysed the fundamental relations for ETGs in the Next Generation Illustris Simulations (IllustrisTNG; Marinacci et al. 2018; Naiman et al. 2018; Nelson et al. 2018; Pillepich et al. 2018; Springel et al. 2018) and find a FP with a mild evolution and a mass–plane relation in place, with a small scatter (∼0.08 dex), since z = 2. Regarding the mass–size relation, Li et al. (2018) report that the evolution of the stellar populations (SPs) results with variations of properties such as mean age and metallicity across this plane in the MaNGA survey. Rosito et al. (2019a) studied this relation for a sample of galaxies with a large variety of morphologies selected from the EAGLE project and the variation of some important galaxy properties across the mass–size relation. They also analysed the angular momentum distribution across the mass–size relation, finding that more massive galaxies are more extended for a fixed value of the spin parameter. In particular, they report a bimodality in the λ − ε plane with galaxies in the first peak populated by fast rotators with younger SPs and in the second peak, by slow rotators with older SPs; these results agree with observational works (Graham et al. 2018).
Feedback mechanisms also play an important role in producing realistic galaxy sizes, affecting the mass–size relation. Crain et al. (2015) emphasise that galaxy sizes have to be taken into account when calibrating EAGLE project simulations since the absence of feedback produces more compact galaxies than those observed as a result of the excessive gas dissipation. Moreover, they remark that the variation of subgrid parameters that allows black holes to achieve high accretion rates in low-mass haloes (< 1011.5 M⊙) enables an earlier AGN feedback effect, thereby leading to the production of more extended massive galaxies (Rosas-Guevara et al. 2015). Habouzit et al. (2019) report a good agreement of IllustrisTNG galaxies with recent observations regarding the mass–size relation. This simulation includes an improved model of AGN feedback in comparison to that implemented in Illustris (Genel et al. 2014).
Although ETGs are supported by velocity dispersion, the amount of rotation among them varies; fast rotators are notably more frequent than slow rotators (Emsellem et al. 2011). A more complete ETGs kinematic classification is summarised in Cappellari (2016), who shows that the rotational component plays a non-negligible role in the structure of ETGs. The importance of rotation in elliptical galaxies can also be seen in cosmological simulations as shown in Oñorbe et al. (2007), who find clear rotation curves in some of these galaxies. Rosito et al. (2018, 2019b) analysed the presence of a disc component in the inner region of ETGs, coexisting with a spheroidal-dominated component (i.e., bulge); this is identified in simulations of the Fenix project (Pedrosa & Tissera 2015) and the EAGLE project (Crain et al. 2015; Schaye et al. 2015), respectively.
The main goal of the present work is to unveil the role of AGN feedback on the fundamental scaling relations and their evolution with time. For this purpose, we analyse two simulations from the Horizon project (Dubois et al. 2014; Kaviraj et al. 2017), which share the same initial conditions and subgrid physics except for the AGN feedback: Horizon-AGN and Horizon-noAGN (Peirani et al. 2017, i.e., no AGN feedback is modelled). Central ETGs are identified by applying the same selection criteria in both simulations and thus, a cross-identify procedure is not applied in our work. We also analyse the star formation rates (SFRs), kinematics, and the ages of the SPs in order to interpret the results.
Several results that are relevant to our work have been already reported using the Horizon project. Dubois et al. (2016) remark on the importance of simulating AGN feedback to reproduce properly the morphology of galaxies, especially of massive galaxies. Furthermore, they conclude that the assembly of ETGs is mostly driven by mergers, having higher fractions of ex situ stars than disc-dominated galaxies, and that the quenching, regulated by AGN feedback, freezes the resultant morphology triggered by those mergers. Additionally, by isolating the effect of AGN feedback, Beckmann et al. (2017) compared the stellar mass ratios of twin galaxies from these simulations, that is they cross-identify individual galaxies from both simulations, thus analysing the impact of AGN feedback on quenching as a function of stellar mass: smaller galaxies quench at higher redshifts than massive galaxies (M* > 1011 M⊙) and more massive galaxies are more affected by AGN feedback. These authors highlight the impact of AGN feedback in regulating the SF in galaxies of different morphologies as a result of the decrease of total gas due to outflows and the difficulty to recover the gas from the halo. Massive ETGs are also studied by Peirani et al. (2019), who find that AGN feedback plays a fundamental role in achieving an agreement with observational trends; in particular, they focus on the mass-weighted density slope (Dutton & Treu 2014) and its correlation with other galaxy features, such as mass and effective radius. Recently, van de Sande et al. (2019) find that Horizon-AGN galaxies are larger at a given stellar mass than those observed in the SAMI galaxy survey (Croom et al. 2012; Bryant et al. 2015), ATLAS3D project (Cappellari et al. 2011), CALIFA survey (Sánchez et al. 2012), and MASSIVE survey (Ma et al. 2014).
This paper is organised as follows. In Sect. 2, we present the methodology adopted to perform our research: the descriptions of the simulations, definitions of the main properties to be studied, and criteria for selecting and classifying the samples of central ETGs that are analysed exhaustively throughout this work. In Sect. 3, the characteristics of the simulated samples at z = 0 are analysed. The evolution of the fundamental relations is studied in Sect. 4 and the results are discussed in Sect. 5. Section 6 summarises our main findings.
2. Methods
2.1. Horizon-AGN and Horizon-noAGN simulations
The Horizon simulations are cosmological hydrodynamical simulations that are consistent with a Λ-CDM universe, where Ωm = 0.272, ΩΛ = 0.728, Ωb = 0.045, H0 = 100 h km s−1 Mpc−1 being h = 0.704, and the normalisation of the power spectrum σ8 = 0.81 (Dubois et al. 2014). These parameters are consistent with a WMAP cosmology (Komatsu et al. 2011). The simulated box size is 100 h−1 Mpc per side with 10243 dark matter particles of 8 × 10⁷ M⊙ (Dubois et al. 2014).
These simulations are run with the RAMSES code (Teyssier 2002), which is based on the adaptative mesh refinement technique (AMR). The initial mesh is refined down to Δx = 1 kpc. This refinement is developed by means of a quasi-Lagrangian method. If the number of dark matter particles in a cell exceeds eight, or the total baryonic matter inside the cell is eight times greater than the dark matter resolution, a new refinement is performed. Furthermore, the minimum size of the cells in physical units (taking into account the scale factor) remains approximately constant. The initial conditions are computed via the MPGRAFIC code (Prunet et al. 2008).
Gas cooling processes (including hydrogen, helium, and some metals) are described following the Sutherland & Dopita (1993) model. Cooling down to 104 K is allowed. On the other hand, gas heating occurs after reionisation (z ∼ 10) and is modelled with a UV background following Haardt & Madau (1996). Star formation takes place when the gas density is greater than 0.1 H cm−3 and is produced randomly (Rasera & Teyssier 2006; Dubois & Teyssier 2008). Such a process follows a Schmidt law,  , where
  is the SFR density, ρg is the gas density, tff the gas local free-fall time, and ϵ* = 0.02 is a constant (Kennicutt 1998; Krumholz & Tan 2007). The stellar mass resolution is 2 × 10⁶ M⊙ and a Salpeter initial mass function (IMF) is assumed (Salpeter 1955). The simulations also include Type Ia (SNIa) and Type II (SNII) supernovae (SN) feedback (Dubois et al. 2014). Gas metallicity is modified by galactic winds and the enriched gas is ejected during a SN event. The following elements are modelled: O, Fe, C, N, Mg, and Si (Dubois et al. 2014).
Individual galactic structures are identified using the AdaptaHOP code (Aubert et al. 2004) updated by Tweed et al. (2009). In the original galaxy catalogue, only objects resolved with more than 50 stellar particles are considered, yielding 150 000 galaxies a z = 0. In the present work, we applied a more restrictive minimum particle number by requesting simulated galaxies to have more than 5000 stellar particles in order to be able to properly resolve galaxies and the evolution with redshift of their fundamental relations.
In the case of Horizon-AGN, black holes are created in regions with gas density higher than a fixed threshold and have an initial mass of 105 M⊙. Black holes are not allowed to form within small distances from each other (less than 50 kpc). The accretion rate (ṀBH) and Eddington accretion rate (ṀEdd) are calculated as in Dubois et al. (2012). There are two AGN feedback modes implemented according to the quotient χ= ṀBH/ṀEdd. If χ < 0.01, the situation corresponds to a ‘radio’ mode, otherwise, to a ‘quasar’ mode (Merloni & Heinz 2008). The fraction of energy released by the black hole is assumed to be a free parameter that depends on the mode. Even though the calibration of Horizon-AGN enforcing the MBH − σ relation, there is evidence that the gas fractions inside haloes are higher than those observed (Chisari et al. 2018). Thus, the results of our work can be assumed to be conservative in gauging the impact of AGN feedback.
These models reproduce a number of black holes observational constraints, such as the black hole mass function and relations between these objects and galaxy properties (Volonteri et al. 2016). There are, however, some differences between these mock objects with the observed objects. In particular, the faint end of the luminosity function is overestimated in the presence of massive black holes at z ∼ 0.5−2, which is a common problem in cosmological simulations (Sijacki et al. 2015). A complete analysis of Horizon-AGN black holes can be found in Volonteri et al. (2016) where the authors propose a stronger SN feedback to improve the reproduction of the observational trends. On the other hand, Beckmann et al. (2017) find a relation between the mass of the smallest galaxy affected by AGN feedback with redshift for Horizon-AGN galaxies that agrees with observations (Baldry et al. 2004; Peng et al. 2010).
2.2. Measured properties of simulated galaxies
For the purpose of developing a comprehensive analysis of the simulated galaxies from Horizon-AGN and Horizon-noAGN and comparing thus their properties, we computed a number of relevant parameters that are used in this work as follows:
-
(a)
Stellar optical radius (Ropt, Tissera et al. 2012): The 3D radius that encloses ∼80% of the stellar mass.
-
(b)
Total stellar mass (M*): The sum of masses of individual stellar particles within Ropt.
-
(c)
Stellar half-mass radius (Rhm): The 3D radius that encloses 50% of the total stellar mass.
-
(d)
Stellar V/σ: The mean rotational velocity (in cylindrical coordinates) over the average velocity dispersion considering the three cylindrical components of velocity. These parameters are measured using all stellar particles belonging to the same galactic structure identified by the AdaptaHOP code (e.g., Dubois et al. 2014; Chisari et al. 2015).
-
(e)
Frot: The ratio of the mass of the stellar disc spatially coexisting with the bulge (i.e., within 0.5Rhm) to the bulge stellar mass. See Appendix A for details about the definition of the galaxy components.
-
(f)
Star formation rate: The quotient between the mass of stars younger than Δt and Δt, being Δt = 0.5 Gyr within the Ropt. We did not use an ‘instantaneous’ measure of the SF activity to avoid numerical noise due to the low number of very young particles (see also Rosito et al. 2018, 2019b).
-
(g)
Specific SFR: sSFR = SFR/M*. For the sSFR of galaxies with no recent SF, we impose a fiducial value of 10−13 yr−1.
-
(h)
Stellar velocity dispersion (σe): This value is computed considering stellar particles within Rhm.
-
(i)
Dynamical mass:
 . This estimation is performed assuming virialisation and an spherical distribution. The G is the universal gravitational constant.
 -
(j)
Average surface density:
 .
. -
(k)
Spin parameter (λ): This parameter is computed with the formula
 (e.g., Emsellem et al. 2011; Lagos et al. 2018), where V and σ are the tangential velocity and velocity dispersion along the line of sight, respectively, and R the 3D radius, for consistency with the calculation of other parameters in this paper. The brackets ⟨.⟩ correspond to a mass-weighted average. The calculations are done by considering all stars within Rhm.
Hereafter, in figures involving data binning to estimate the medians and the 25 and 75%, we only consider bins with more than ten galaxies in order to obtain more robust and reliable trends.
It is important to mention that even though these quantities clearly characterise the simulated galaxies, their detailed computations may differ from the methods applied to measure analogous properties in observations. Therefore, we must bear in mind that, in some cases, the comparison can be only done qualitatively.
2.3. Definition and selection of ETGs
We selected central galaxies defined as the main system within a virial radius that are resolved with more than 5000 stellar particles in both simulations. Therefore, satellite galaxies are not included in this work. Taking into account the maximum mesh size resolution, galaxies with Rhm lower than 2 kpc are not considered. We also removed galaxies with stellar masses greater than 1012.5 M⊙ from the Horizon-noAGN simulation. These galaxies with unrealistic properties represent 0.3% of our sample at z = 0 (Beckmann et al. 2017). The importance of AGN feedback in reproducing the high-mass end of the galaxy stellar mass function was previously noted by Beckmann et al. (2017) and is consistent with the fact that AGN feedback prevents excessive SF and in its absence, more massive galaxies can be formed. These criteria are applied at all analysed redshifts.
To distinguish ETGs from late-type galaxies (LTGs), we followed Chisari et al. (2015) who adopt a threshold at V/σ = 0.55 (see Sect. 2.2). Taking this into account, galaxies with stellar V/σ < 0.55 are considered ETGs since they are dominated by dispersion velocity. By applying this criterion, the number of members in our ETG samples are 4370 and 1560 for the Horizon-AGN and Horizon-noAGN run, respectively, at z = 0. We remark that all analysed ETGs are central galaxies and hence, hereafter we drop ‘central’ in the text for the sake of simplicity, but we retain it in the figure and table captions.
In Table 1 we summarise the number of members in the resulting samples of ETGs for both simulations at each analysed redshift. As can be appreciated, the number of well-resolved ETGs decreases with increasing redshift in both runs, but there are fewer ETGs in Horizon-noAGN. Nevertheless, the fraction of ETGs over the total number of galaxies with more than 5000 stellar particles, Rhm greater than 2 kpc and masses lower than 1012.5 M⊙ remains approximately constant as a function of redshift in both simulations. It must be stressed that the only difference between both runs is the turn-on or turn-off of only the AGN feedback; the rest of the physics implemented, including SN feedback, is always present.
Well-resolved central ETGs the Horizon simulations at different redshifts.
The selection of galaxies and their morphological classification is performed using the same definitions for both simulations at all analysed redshifts and hence, they are not followed along their merger trees. We follow this approach because it is especially useful to compare statistically the properties of the simulated objects, taking into account the lack of tuning of Horizon-noAGN simulation.
3. Characterisation of Horizon ETGs at z = 0
In this section, we analyse the main properties of our subsamples of ETGs from Horizon-AGN and Horizon-noAGN. A complete characterisation of galaxies from these two simulations and a detailed comparison between them are performed by Dubois et al. (2016). In that work, properties such as halo mass, V/σ (and other kinematic parameters), and size are shown as a function of stellar mass at different redshifts. Hereafter, we restrict the analysis to our samples of ETGs obtained as described in the last section.
In Fig. 1 we show the total stellar mass distributions for both galaxy samples. The histograms are, hereafter, normalised so that their enclosed area is 1, thus approximating a probability density function (PDF). This allows for a direct comparison of the involved quantities. The number of well-resolved, and more massive, ETGs from Horizon-AGN is remarkably larger than those from Horizon-noAGN. The low number of massive ETGs from Horizon-noAGN agrees with the results of Dubois et al. (2016), as mentioned above, and points out the importance of modelling AGN feedback to achieve a better description of massive galaxies. There is, however, a small tail of very massive ETGs (2.4%) in the stellar mass distribution of the Horizon-noAGN sample that have total stellar masses greater than 1012 M⊙.
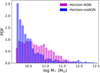 |
Fig. 1. Stellar mass distributions for the selected samples at z = 0 of central ETGs from Horizon-AGN (magenta) and Horizon-noAGN (blue). The differences show that in the absence of AGN feedback there are fewer massive central ETGs. The existence of a small tail of massive galaxies in Horizon-noAGN, which may be a result of the lack of AGN feedback, is noted. |
3.1. Star formation activity
We analysed the relation between the sSFR and total stellar mass for our samples of ETGs, which are defined in Sect. 2.2, from which we can verify the action of AGN. For comparison, we included observations of isolated elliptical galaxies from the UNAM-KIAS catalogue (Hernández-Toledo et al. 2010). We also considered the criterion reported by Lacerna et al. (2014) to distinguish active and passive galaxies.
As shown in Fig. 2, ETGs from Horizon-AGN show a decreasing sSFR for increasing stellar mass; this agrees with the observations, albeit simulated galaxies are still more active. A similar result is found for galaxies from Illustris simulation, for which feedback does not seem sufficient to suppress SF in some galaxies as reported in Genel et al. (2014). Other numerical works have already highlighted the impact of AGN feedback on the regulation of the SF activity (e.g., Crain et al. 2009, 2015; Schaye et al. 2010; Haas et al. 2013; Pillepich et al. 2018; Habouzit et al. 2019) as mentioned in the Introduction. In a previous work, Chisari et al. (2018) conclude the need to modelling stronger AGN feedback in Horizon-AGN to decrease the amount of gas inside galactic haloes and thus match the observations.
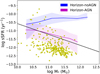 |
Fig. 2. Specific SFR as a function of stellar mass for central ETGs from Horizon-AGN (magenta) and from Horizon-noAGN (blue). The 25 and 75% are depicted by the shaded region. The line separating active and passive galaxies (above and below the line, respectively) reported by Lacerna et al. (2014) and observations of isolated ETGs from UNAM-KIAS catalogue (yellow stars; Hernández-Toledo et al. 2010) are included. |
On the other hand, ETGs from Horizon-noAGN are, as expected, significantly more star forming with median sSFR, which are almost independent of stellar mass, as shown in Fig. 2. It must be noted, however, that in this simulation, SN feedback is not further tuned to act alone (i.e., the only difference with Horizon-AGN is the lack of black hole formation) and, hence, the differences with observations might be overestimated. In fact, galaxies from the Fenix simulation, which does not include AGN feedback but has been performed with a SN feedback model that reproduces the angular momentum content and the mass–size relation (Pedrosa & Tissera 2015), show a clear trend between sSFR and stellar mass; this is in agreement with observations as reported by Rosito et al. (2018). These findings support previous claims that this scaling relation can be used to calibrate the feedback mechanisms to reproduce them as pointed out in previous results (see Introduction).
We checked that imposing sSFR = 10−13 yr−1 to galaxies with no young SPs does not affect significantly the results shown in Fig. 2. We computed the median log sSFR without these non-star-forming galaxies in the same mass bins considered in the figure. The differences between these medians and those plotted are negligible regarding the typical values of sSFR (< 0.2 dex). These galaxies with no recent SF represent the 9% and the 17% of the ETGs from Horizon-AGN and Horizon-noAGN.
3.2. Mass–size relation
In this section, we investigate possible dependences of the mass–size relation on the age and level of rotation (V/σ) of the SPs. We compare the mass–size relation obtained from Horizon-AGN and Horizon-noAGN samples. We use an implementation in Python, coded by Cappellari et al. (2013b) of the 2D locally weighted regression method (Cleveland & Devlin 1988) so as to obtain smoothed distributions.
3.2.1. Galaxies formed under the action of AGN feedback
We first study the mass–size relation as a function of stellar V/σ and stellar age. Here, Following Rosito et al. (2019a) and Li et al. (2018), we analysed the mass–size relation using the dynamical mass, Mdyn, estimated assuming virialisation. Dubois et al. (2016) already report a strong correlation between stellar mass and the effective radius. Hence, the relation is also present between Mdyn and stellar Rhm, as shown in the upper panels of Fig. 3. We note that van de Sande et al. (2019) find that galaxies from Horizon-AGN are more extended for all stellar masses than those observed, as mentioned in the Introduction.
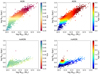 |
Fig. 3. Mass–size relation as a function of stellar V/σ (left panels) and mass-weighted average stellar age (right panels) for both samples of central ETGs at z = 0. |
In Fig. 3 (left upper panel) a correlation between mass and V/σ is found, such that more massive galaxies are more dispersion-dominated. This is the expected trend, considering that galaxies with a lower level of rotation are, generally, more massive, which agrees with observational findings (e.g., Emsellem et al. 2011). Li et al. (2018) report that more massive galaxies present higher values of velocity dispersion. However, in their work, there is little dependence of velocity dispersion on radius. In our sample, since the increase in Rhm with dynamical mass is almost linear, and the correlation is, therefore, stronger, V/σ decreases significantly with increasing size, as well as with dynamical mass.
With respect to age variations across the mass–size relation, from the right upper panel of Fig. 3, it is clear that at higher masses, galaxies are dominated by older SPs. A very low number of old, low-mass galaxies can be seen, but this is not representative of the whole sample. This population is overemphasised by the smoothing method1. This small, less massive old population cannot be seen in the non-smoothed distribution and we can therefore conclude that this trend is due to the smoothing method. Our results are consistent with those from van de Sande et al. (2019).
3.2.2. Galaxies formed in the absence of AGN
The mass–size relation for galaxies formed in the absence of AGN feedback shows that they have lower radii at a given Mdyn, as shown in the lower panels of Fig. 3. As mentioned in the Introduction, it can be clearly seen that the presence of AGN feedback is needed to produce more extended massive galaxies (Dubois et al. 2013). This is consistent with the fact that Horizon-noAGN ETGs also present higher values of the average surface density, defined in Sect. 2.2, with a maximum Σe ∼ 1010.2 M⊙ kpc−2. In contrast, the maximum Σe for ETGs in Horizon-AGN is ∼109 M⊙ kpc−2. This fact was previously reported by Peirani et al. (2019), who conclude that without AGN feedback, simulated galaxies are more compact than observed galaxies, whereas the values of Σe for massive ellipticals from Horizon-AGN match the observational data. Nevertheless, these authors remark that low-mass ETGs from that simulation are not compact enough to be in agreement with observations (see the Introduction for comments on previous works such as Crain et al. 2015; Rosas-Guevara et al. 2015, and Habouzit et al. 2019). We return to this point in Sect. 4.
The trend of rotation across mass–size relation is less clear, but massive galaxies still show lower values of stellar V/σ (Fig. 3), as expected. For the stellar age, an old low-mass population can be found, but it cannot be attributed to the smoothing method. This fact may be ascribed to the action of SN feedback, which is stronger for small galaxies (Larson 1974; White & Rees 1978; Dekel & Silk 1986; White & Frenk 1991), and therefore would quench SF in these objects at earlier times. When the AGN feedback is on, the regulation of the SF is clearly different across the whole mass range so a smoother variation of the mean age is achieved as a function of mass as shown in Fig. 3.
Considering that the SN feedback in this simulation has not been tuned to achieve better modelling of galaxy properties on its own (i.e., it is the same as that used when the AGN feedback is active), a good match with observations is not to be expected.
3.3. Inner stellar discs
As reported in Rosito et al. (2018) using the Fenix sample and Rosito et al. (2019b) the EAGLE sample, there is a rotational component embedded within the bulge, so-called inner stellar disc. In this subsection, we explore the presence of this component in the Horizon galaxies. We calculated Frot that is a measure of the relevance of these inner discs defined in Sect. 2.2. For this analysis, we discarded galaxies with inner discs resolved with less than 250 star particles to mitigate numerical effects. With this condition, subsamples comprising 1262 and 345 members are defined for Horizon-AGN and Horizon-noAGN, respectively.
As shown in the left panel of Fig. 4, for ETGs in Horizon-AGN there is a clear correlation between Frot and the globally measured V/σ (as in Dubois et al. 2014) with a p-value ∼0. This is consistent with the results of Rosito et al. (2018, 2019b), where anti-correlations between Frot and bulge-to-total stellar mass ratio (B/T) are also reported. For galaxies in Horizon-noAGN, no clear correlation is found (Spearman correlation coefficient ∼0.06 and p-value ∼0.30).
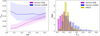 |
Fig. 4. Left panel: Frot as a function of V/σ for central ETGs from Horizon-AGN (magenta) and Horizon-noAGN (blue) simulations. The 25 and 75% are depicted by the shaded regions. Right panel: histograms of Frot for central ETGs selected from Horizon-AGN (magenta), Horizon-noAGN (blue), and EAGLE (yellow) at z = 0. |
In Fig. 4 (right panel), normalised histograms of Frot for our subsamples (Horizon-AGN and Horizon-noAGN ETGs) are shown. For comparison, the distribution obtained by Rosito et al. (2019b) for the largest volume run of the EAGLE project simulations is included. It can be seen that the peaks of the distributions for Horizon-AGN and EAGLE ETGs are close to each other, but the latter is significantly higher while the former has a larger fraction of ETGs with negligible inner rotation. Horizon-noAGN galaxies present larger values of Frot, as can be seen in the same figure. This suggests that AGN feedback can reduce the formation of inner discs and hence, the inner regions are more dispersion-dominated.
3.4. Slow and fast rotators
As in many observational works (e.g., Emsellem et al. 2011), we find that most Horizon-AGN ETGs are fast rotators (see also van de Sande et al. 2019). This is assessed using the spin parameter λ within Rhm (see Sect. 2.2). If we consider λ ∼ 0.2 as a suitable threshold to distinguish fast and slow rotators as in Rosito et al. (2019a), only 18% of the simulated ETGs are found to be slow rotators. In the left panel of Fig. 5 we show histograms of the spin parameters for these ETGs. For Horizon-AGN, we can observe a bimodality with peaks at λ ∼ 0.1 (slow rotators) and λ ∼ 0.6. Graham et al. (2018) find a bimodal distribution of this parameter in observations, albeit the second peak is reported to be at λ ∼ 0.9. The differences in the calculation of this parameter in that observational work must however be taken into account. We remark that in a previous work by Choi et al. (2018), where they used a relation between the spin parameter and the ellipticity to classify galaxies as slow/fast rotators, as in Emsellem et al. (2011), they find a fraction of 11.2% of slow rotators in Horizon-AGN. In their work, Choi et al. (2018) find a correlation of the amount of rotation with mass which is explained by the fact that massive galaxies have experienced a larger number of mergers regardless of their environment and thus they rotate more slowly.
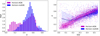 |
Fig. 5. Left panel: histograms of the spin parameter for central ETGs from Horizon-AGN (magenta) and Horizon-noAGN (blue). Right panel: spin parameter as a function of V/σ for Horizon-AGN (magenta) and Horizon-noAGN (blue) samples. The shaded regions depict the 25 and 75%. We include the scatter plots for both simulations. |
As expected, there is an even smaller fraction of slow rotators (defined above) in Horizon-noAGN (1%). This is consistent with the fact that in the absence of AGN, it is more difficult to reproduce massive ETGs (Dubois et al. 2016). For this simulation the distribution of λ is unimodal with a peak at about λ ∼ 0.55 (Fig. 5, left panel). Therefore, we can conclude that AGN feedback is important for reproducing the bimodality present in the observations (Graham et al. 2018) and hence, the angular momentum distribution of the SPs.
For the Horizon-AGN sample, the correlation between the spin parameter and V/σ is excellent (right panel of Fig. 5, magenta lines). For ETGs in Horizon-noAGN there is also a clear correlation when stellar V/σ > 0.1. The high values of λ for galaxies with V/σ ≤ 0.1 in the Horizon-noAGN run are due to a small number of outliers. Therefore, the existence of the correlation between morphology and spin parameter is not affected. In Fig. 4 it can be appreciated that ETGs with these low V/σ have high inner stellar disc fractions that are consistent with the high λ parameters shown in Fig. 5.
4. Fundamental scaling relations and their redshift evolution
In this section, we investigate the impact of the AGN feedback on the two fundamental relations: the mass–plane and the FP. The parameters of these fundamental relations are compared to those obtained assuming virialisation and their evolution with redshift.
4.1. The mass–plane
The mass–plane, which can be understood as a consequence of the virial theorem (Bolton et al. 2007), relates the dynamical mass with the galaxy radius, R, and the velocity dispersion, σ of galaxies as follows:
 (1)
(1)
According to the virial theorem, the exponents should be α = 2 and β = 1 (see Binney & Tremaine 1987).
Instead of working with dynamical masses, we used stellar masses as in Oñorbe et al. (2005) and Oñorbe et al. (2006, see Introduction). The galaxy properties used to estimate this plane are the total stellar mass, Rhm and σe explained in Sect. 2.2. In both Horizon simulations, we performed ordinary multiple linear regressions, where M* is the dependent variable, to obtain the parameters in Eq. (1) at each analysed redshift, as shown in Fig. 6. For comparison, we also included the virial relation (α = 2 and β = 1) for z = 0. The constant term in that relation at z = 0 is set ad hoc. From this figure, we can appreciate that, in the presence of AGN, the mass–plane is in place since z = 3, and this is approximately consistent with the expectation from the virial theorem. On the other hand, the mass–plane for Horizon-noAGN ETGs is also in place since z = 3, but it is clearly tilted from the virial relation. This indicates that, given the same conditions, AGN feedback plays an important role in the regulation of the SF, allowing the simulated galaxies to better reproduce the observed mass–plane. The larger impact is detected for β, which is associated with the galaxy size. All the parameters of the linear regression are summarised in Table 2. The fact that we find different parameters from the linear regressions for Horizon-noAGN indicates that AGN feedback affects not only the stellar mass, size, and velocity dispersion, but also the relation among them as clearly unveiled by the mass–plane.
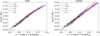 |
Fig. 6. Mass–plane as a function of redshift for central ETGs from Horizon-AGN (left panel) and Horizon-noAGN (right panel). The magenta, blue, red, green, and yellow lines depict the simulated relations at z = 0, z = 0.5, z = 1, z = 2, and z = 3, respectively. The shaded regions delimit the 25 and 75%. The virial relation for z = 0 is shown with a black solid line. Observations from ATLAS3D project (Cappellari et al. 2011,2013a, b) at z = 0 are included for comparison (black crosses). |
Evolution of mass–plane parameters with and without AGN feedback.
To compare with recent observations at z = 0, we calculated the mass–plane for ETGs from ATLAS3D project (Cappellari et al. 2011) by ordinary multiple linear regressions. We adopted the stellar mass estimated by the JAM method, which provides a more robust estimation that does not largely depend on the IMF (Cappellari et al. 2013b) and which better compares with the stellar mass estimated from the simulations. The effective radius (comparable with Rhm) and the velocity dispersion within that radius are extracted from Cappellari et al. (2013a). The resulting parameters for Eq. (1) are αobs = 1.930 ± 0.030, βobs = 0.925 ± 0.020 and Cobs = 6.241 ± 0.064. We calculated the errors by a bootstrap method. Li et al. (2018) also calculated the mass–plane parameters for nearby elliptical and LTGs classified by their Sérsic indexes (Sérsic 1968). These authors considered the major axis of the fitted ellipse of the half-light isophote instead of the effective radius, and twice the dynamical mass instead of the stellar mass. By using least trimmed squares (LTS) regression (Rousseeuw & Leroy 1987), they obtain αobs = 1.959 ± 0.018 and βobs = 0.964 ± 0.013 for the ETGs. From Fig. 6, it can be seen that both simulated mass–planes overlap the observations. However, the fitted parameters shown in Table 2 differ significantly from the observed parameters within their errors. At z = 0, the parameters computed for Horizon-noAGN are noticeably farther away from the observed parameters than those obtained from Horizon-AGN considering the estimated errors. This is particular clear for β parameter. Regarding this, in the case of Horizon-AGN, there is approximately the same level of scatter σ ≈ 0.10 at all analysed redshifts, while for Horizon-noAGN the scatters slightly increases with increasing redshift.
To evaluate the evolution of the mass–plane and to assess the effect of AGN feedback, we used the parameters of Eq. (1) computed at z = 0 as a reference to estimate the relation defined by Eq. (2) for ETGs at different redshifts as follows:
 (2)
(2)
In Fig. 7 we show the difference between Mfit and the galaxy stellar mass measured at different redshifts as a function of the stellar mass. This procedure was applied to both Horizon runs using the corresponding parameters for their mass–planes. As shown in this figure, a systematic displacement towards higher positive differences is detected for galaxies from both simulations. When the AGN feedback is on, we note that there is no important evolution in the mass–plane up to z = 1, so that the stellar masses are very close to Mfit within a wide range. However, for 1 < z < 3 the differences are larger, indicating a stronger evolution of the mass-plane over this redshift interval (see Table 2). Hence, although the mass–plane is set since z ∼ 3, it converges to the z = 0 plane by z ∼ 1. We come back to this point in Sect. 5 in relation to the FP evolution.
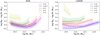 |
Fig. 7. Differences between logMfit (defined in Eq. (2)) computed with parameters at z = 0 and stellar mass at different redshifts for central ETGs from Horizon-AGN (left panel) and Horizon-noAGN (right panel). The magenta, blue, red, green, and yellow lines depict the simulated relations at z = 0, z = 0.5, z = 1, z = 2, and z = 3, respectively. The shaded regions are delimited by the 25 and 75%. |
For Horizon-noAGN ETGs, the evolution is more noticeable, with larger displacements for increasing redshift. From Table 2 we can see that the scatter of the regressions increases significantly for higher redshift and that the errors in the parameter β are very large at z = 2 and z = 3. In fact, β is nearly zero for z = 2 and, hence, there is almost no dependence on size in the mass–plane. For z = 3 there are a small number of galaxies and the error for β is also very high. Hence the large errors do not allow us to achieve robust conclusions with regards to the linear regressions at very high redshift.
4.2. The fundamental plane
The FP (Faber et al. 1987; Dressler et al. 1987; Djorgovski & Davis 1987) is an alternative representation of the fundamental relation depicted in the mass–plane, assuming homology and a constant M/L for all elliptical galaxies. Therefore, the functional form is similar and is given by
 (3)
(3)
The subscript ‘e’ indicates that the velocity dispersion is measured within Reff, which is replaced by Rhm in the computation of simulated data. Here, Ie is the average surface brightness within the effective radius defined as  . By assuming virialisation and homology, α = 2 and β = −1 are obtained (e.g., Mo et al. 2010). However, the observed FP shows a tilt with respect to the virial prediction, which could be attributed to a variation of M/L, the dark matter fraction, or possible non-universality of the IMF. It has been shown that a dynamical estimation of the stellar masses takes much of this tilt into account (Cappellari 2016). Since we are mainly interested in unveiling the role of AGN feedback on the FP, we work with stellar masses instead of luminosities (see Sect. 5 for a discussion on the latter).
We performed a similar analysis to that described in the last subsection for the mass–plane. For each analysed redshift, we estimated the parameters in the Eq. (3) for ETGs in the Horizon-AGN and Horizon-noAGN samples. We applied an ordinary multiple linear regression where the dependent variable is now Rhm. We replaced Ie by Σe and thus the FP is defined by the total stellar mass of the simulated galaxies. These stellar masses are comparable to the MJAM estimated by Cappellari et al. (2013a). To compare with the observations of these authors, a multiple linear regression was applied to the observed FP from which the following values were obtained: αobs = 1.678 ± 0.035 and βobs = −0.848 ± 0.019. The errors were calculated with a bootstrap method.
From Fig. 8 it can be appreciated that the simulated FPs are defined well. For both runs, the planes show low scatter in these regressions at all analysed redshifts. Table 3 summarises the parameters obtained for both Horizon simulations.
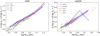 |
Fig. 8. Fundamental plane as a function of redshift for central ETGs from Horizon-AGN (left panel) and Horizon-noAGN (right panel). The magenta, blue, red, green, and yellow lines depict the simulated relations at z = 0, z = 0.5, z = 1, z = 2, and z = 3, respectively. The regions between the 25 and 75% are shaded. The virial relation for galaxies at z = 0 (black solid line) is included. For comparison, the observational results from ATLAS3D are indicated in black crosses. |
Evolution of FP parameters in Horizon simulations using Σe.
For the Horizon-AGN sample (left panel of Fig. 8), the FPs are slightly tilted from the virial relation for galaxies at z = 0 (see Table 3 and Fig. 8). This is consistent with many observational studies, as mentioned in the introduction. More specifically, the β parameter related with Σe is the most affected at z = 0, while the α parameter, related to σe is closer to the expected theoretical value. Regarding β, we note that |β|≤|βobs|. This can be related to the fact that MJAM is a good approximation of the total stellar mass (Cappellari et al. 2013b), but there may be other factors to take into account, such as variations of the IMF. Again, the zero-point of the virial relation was set ad hoc.
On the other hand, the FP obtained from Horizon-noAGN galaxies using the virial parameters at z = 0 (right panel of Fig. 8) presents a remarkable break with respect to the slopes of the simulated FP at all the analysed redshifts. This means that even though we can fit a plane at different redshifts with low scatter, in the absence of AGN feedback the observed and the theoretical relations cannot be reproduced, especially at radii larger than 4 kpc (log Rhm = 0.6). It is clear that without the regulation of the stellar mass and size by AGN feedback, the FP plane departures largely from the expectation of the virial theorem.
Another approach to assess the FP and its evolution is to use the observed parameters at z = 0 as reference values and estimate the changes with respect to these parameters. Following Rosito et al. (2018, 2019b), we estimated the FP for the observational data of Cappellari et al. (2013a). We used the MJAM to compute Σe at z = 0. Then, the observed parameters were applied to estimate the FP (Eq. (4)) as a function of redshift. The constant term is set ad hoc to better compare with observations as follows:
 (4)
(4)
Hence, we obtained the expected Rhm in case of no evolution of the FP since z = 0. These values are compared to the simulated Rhm at a given z. The results are shown in the upper panels of Fig. 9. From this figure, we can see a consistency in the simulated FP for the Horizon-AGN sample with these parameters. However, in the absence of AGN feedback, the FP departures from the observed relation at high radii. This break from the FP in the Horizon-noAGN ETGs is produced by an excess of stellar mass at given Rhm, which produces the high Σe as previously mentioned. This sub-population of compact galaxies starts to be noticeable for z < ∼1. To illustrate this, in the lower panels of Fig. 9 we show the relation for z = 0 together with the individual simulated galaxies. It can be appreciated that the deviation from the observed FP at large radii in Horizon-noAGN is caused by galaxies with high average surface density (Σe > 109.5 M⊙ kpc−2) at a given Rhm (right, lower panel). Hence, AGN feedback plays an important role in regulating the SF and prevents the formation of very dense galaxies, which otherwise depart from the FP. This trend agrees with Peirani et al. (2019), who already reported higher values of Σe for galaxies formed in the absence of AGN in the Horizon simulation. These galaxies clearly do not follow the FP; however, they are still consistent with the mass–plane. For comparison, we include the scatter plot for Horizon-AGN at z = 0, where we do not find such dense galaxies.
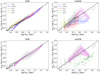 |
Fig. 9. Upper panels: fundamental plane for Horizon-AGN (left panel) and Horizon-noAGN (right panel) central ETGs obtained with the parameters calculated with data from Cappellari et al. (2013a) estimated at z = 0 (magenta lines), z = 0.5 (blue lines), z = 1 (red lines), z = 2 (green lines), and z = 3 (yellow lines). The regions between the 25 and 75% are shaded. For comparison, the observational results from ATLAS3D (black crosses) are also included. Lower panels: similar relations for z = 0 including the individual galaxies. The scatter plot of the simulated galaxies is depicted in grey circles in both panels. Horizon-noAGN central ETGs with average surface density greater than 109.5 M⊙ kpc−2 are highlighted (green squares). Such dense galaxies do not exist in the Horizon-AGN sample. The 1:1 line is depicted in black. |
Finally, to analyse the luminosity FP (i.e., the FP obtained using Ie instead of Σe, L-PF2), we used the luminosities in r band3 to estimate Ie. In Fig. 10, we show the L-FP as a function of redshift for the Horizon-AGN. For comparison, the expected relation from the virial theorem is also included. As can be seen, the tilt is strong at all redshifts (Table 4) whereas, when using the stellar mass, the deviation from the virial expectations is weaker for z = 0 (Fig. 8). Our results suggest that an important factor causing the tilt in the L-FP is the variation of the M/L from galaxy to galaxy and as a function of redshift. We further address this point in the Discussion.
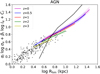 |
Fig. 10. Luminosity-FP for Horizon-AGN central ETGs sample computing the average surface brightness for both observations (Cappellari et al. 2013a) and simulation, using the luminosity in the r band. |
Evolution of L-FP parameters for Horizon-AGN central ETGs and for the subsample obtained with the restriction V/σ < 0.3.
5. Discussion on the FP
In the previous section, we have shown that the impact of AGN feedback on ETGs allows the FP to be reproduced in close agreement with observations. In this section, we explore in more detail the correlation between different galaxy properties and the FP as a function of redshift with the aim to discover how AGN feedback works at different mass scales and redshifts.
5.1. Specific SFR, age, and morphology dependence
One of the main roles of AGN feedback is the regulation of the SF activity. This can be clearly appreciated from Fig. 11, where the median sSFRs as a function of the stellar mass for the different analysed redshifts are shown. For the noAGN run, the sSFR decreases with decreasing redshift as expected. However, this value remains approximately constant as a function of stellar mass (right panel). The activation of the AGN feedback modulates the SF activity across time with the larger impact at z ∼ 1 from where it starts to be quenched, principally for high-mass galaxies (see also Beckmann et al. 2017). The overall effects are a change in the slope of this relation and a larger suppression of the SF activity than in the noAGN run for lower redsfhits. Both of these contribute to better reproduce the observed trend.
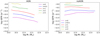 |
Fig. 11. Specific SFR as a function of stellar mass for Horizon-AGN (left panel) and Horizon-noAGN (right panel) central ETGs at different redshifts. At z = 1 there is a change in the slope for the Horizon-AGN samples, while the sSFR does not depend on stellar mass in the absence of AGN feedback. |
The quenching of the SF activity is reflected on the evolution of mean ages of the SPs. In Fig. 12 we show the FP for both simulations as a function of mass-weighted average stellar age4. At z = 0, galaxies dominated by old stars lie above the 1:1 line, particularly for large radii. The opposite trend can be observed for higher redshifts (z = 2 and z = 3), while the transition between these behaviours occurs at z ∼ 1, in agreement with the SF trends of Fig. 11.
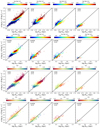 |
Fig. 12. Fundamental plane for Horizon-AGN and Horizon-noAGN central ETGs fitted at different redshifts. The symbols are coloured according to mass-weighted average stellar age (upper panels) and the stellar V/σ (lower panels). The 1:1 line is depicted in black. |
We also find that V/σ varies across that plane as shown in Fig. 12 (left panels) similar to the behaviour shown by the ages. This suggests a link between SF histories and galaxy morphologies (quantified by V/σ, see Fig. A.2). Those galaxies which are faster rotators tend to have younger SPs, on average. At z ∼ 1, galaxies dominated by velocity dispersion present larger sizes compared to those more rotation dominated. Those with V/σ within the range [0.30–0.35] depict a U-shape in the distribution across the FP at a given galaxy size. In the absence of AGN feedback, galaxies dominated by velocity dispersion are systematically located above the 1:1 relation.
5.2. Mass-to-light ratio variation across the FP
Hereafter, we only focus on the Horizon-AGN run, which better reproduces the observations. The regulation of the SF activity by AGN feedback also modulates the luminosities and, consequently, the M/L ratios. As shown in the upper panel of Fig. 13, the FP as a function of M/L in the r band shows a clear change from a sequence of galaxies populated by young stars, which have low M/L and are dominated by rotation and populate the region above the 1:1 relation for z > 1, to galaxies with older populations and larger M/L at z ∼ 0. As previously stated, at z ∼ 1 the action of AGN feedback can be linked to a quenching of the SF and the progressive ageing of the SPs.
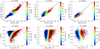 |
Fig. 13. Upper panels: fundamental plane for Horizon-AGN central ETGs as a function of M/L at z = 0, 1 and z = 2. Symbols are coloured by M/L. Lower panels: relation between M/L ratio and velocity dispersion for the same galaxies. Symbols are coloured by the average surface density Σe. |
In summary, the action of AGN feedback in the Horizon simulations regulates the SF activity so that it is significantly quenched by z ∼ 1 and is mainly quenched for massive galaxies. This also has an impact on the M/L ratios, which get larger with decreasing redshift as the SPs get older (Fig. 13). However, this is not the only effect. Some galaxies have lower Σe at similar M/L, as shown in lower panel of Fig. 13. Additionally, we also find that V/σ varies so that more massive spheroidal-dominated galaxies are able to form. Hence, the regulation of the SF activity by the AGN feedback shapes the M/L ratio for galaxies of intermediate and large σe.
In a recent observational work, Bernardi et al. (2020) analysed the FP of nearby galaxies from MaNGA DR15 (Aguado et al. 2019). They find a tight plane, especially for slow rotator ETGs. In agreement with Saglia et al. (1993), who found a dependence of the FP on morphology, Bernardi et al. (2020) remark that the FP parameters are linked to the morphological mix of ETGs. Our results are in global agreement with this trend at z = 0, although the simulated L-FP is more tilted for the coefficient of the surface brightness compared to the results reported by Bernardi et al. (2020) (αobs = 1.275 ± 0.025 and βobs = −0.723 ± 0.013). The scatter found in observed L-FP (0.077 dex) is similar to that measured in the Horizon-AGN (0.067 dex).
Lu et al. (2020) study the evolution of the FP from the IllustrisTNG-100 simulation, finding a tight plane since z = 2, which is in general agreement with our findings. There are, however, some differences in the fitted parameters as can be seen from the comparison of their Table 1 and our Table 4 regarding the whole ETG sample. Our αI parameters are slightly different to theirs taking the errors at all redshifts into account (with the exception of z = 2 in which both calculations are consistent). On the other hand, βI values are always more negative than those reported by Lu et al. (2020). In both works, the parameters evolve with time with similar scatter. However, we note that Lu et al. (2020) selected their sample by applying different criteria. To improve the comparison between theirs and our results, we restricted our sample to the most dispersion-dominated ETGs by imposing V/σ < 0.3; hereafter, we call this the restricted sample. This restricted sample excludes faster rotator ETGs in Horizon-AGN. In Table 4 we show the PF parameters for this subsample. The αI parameters are consistent to those reported by Lu et al. (2020) within the errors.
As shown in Fig. 14, there is a clear age dependence of the L-FP, which is similar at all analysed redshifts. Those ETGs dominated by older stars are located above the 1:1 relation, having more positive residuals (defined by Res = αIlogσe + βIlogIe + C − logRhm, where the coefficients are computed at each redshift and summarised in Table 4). However, we find that ETGs with similar mean ages are located on planes that are slightly tilted with respect to the overall L-FP.
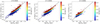 |
Fig. 14. Luminosity-FP for Horizon-AGN central ETGs fitted at different redshifts, where ETGs are defined as those with V/σ < 0.3. The symbols are coloured according to mass-weighted stellar ages. The 1:1 line is depicted in black. |
These trends are different from what we found for the stellar mass FP where, for z > 1, ETGs dominated by younger SPs tend to have positive Res. At z = 1, however, there is an inversion in the relation that drives the final age distribution at z = 0. The variation of stellar age across the FP is related to the variation of the M/L for galaxies with different Σe. From the lower panel of Fig. 13, we can see that high Σe galaxies have high σe and low M/L at high redshift, but at a given σe some galaxies become denser as the M/L get higher for lower redshift. For z < 1 the dependence on Σe has changed slope with some galaxies becoming less dense for a given σe and M/L.
In Fig. 15 we show the residuals of the L-FP as a function of the median stellar age at z = 0 for the restricted sample. Additionally, we also highlight the residuals considering an extra condition to select only passive galaxies (Lacerna et al. 2014) from the restricted sample so that log(sSFR)≤ − 0.65(log(M* − 10.56)) − 10.94 (M* is in units of M⊙ and sSFR is in units of yr−1).
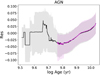 |
Fig. 15. Residuals of the L-FP at z = 0 with the restriction V/σ < 0.3 as a function of mass weighted average age (black line). The residuals of the subsample of passive galaxies (defined by Lacerna et al. 2014) are depicted in magenta lines. The regions between the 25 and 75% are shaded. |
As shown in Fig. 15, the relation between Res and stellar age obtained for passive, dispersion-dominated Horizon-AGN ETGs depicts a monotonous increasing function of stellar age5, which is in good agreement with Lu et al. (2020). However, there are 22 ETGs from the restricted sample (1.11%) with ages lower than 109.75 yr. Their residuals present a different behaviour as a function of stellar age because 14 of them are positive (0.07% of the restricted sample). These slow rotator ETGs have been rejuvenated and hence determined a turn in the residual relation. The confrontation of these results with recent reported observation of ETGs could shed light on the efficiency of feedback mechanisms.
6. Conclusions
We have performed a comprehensive study of ETGs from the Horizon-AGN and Horizon-noAGN simulations, which allows us to analyse the role of AGN feedback in reproducing the main scaling relations for this type of galaxies. We select central galaxies resolved with more than 5000 stellar particles, Rhm larger than 2 kpc and total stellar masses lower than 1012.5 M⊙. Galaxies are classified as ETGs if V/σ < 0.55 following Chisari et al. (2015).
Our main conclusions are as follows:
-
Albeit dispersion-dominated by definition, ETGs show a variety of morphologies, ranging from less to more rotational supported systems. These galaxies show a rotational component within their inner region (defined in Sect. 3.3). The stellar mass fraction of this rotational component to the dispersion-dominated component correlates with V/σ for ETGs in Horizon-AGN in agreement with previous results (Rosito et al. 2018, 2019b), as shown in Fig. 4. The ETGs in Horizon-noAGN show higher fractions (∼0.20) that are independent of stellar mass. This implies that ETGs are more dominated by rotation in the Horizon-noAGN and that AGN feedback contributes to building up more dispersion-dominated systems, thereby leading to a better agreement with observations.
-
The presence of AGN feedback is required to reproduce the bimodality in the spin parameter found in Graham et al. (2018), and hence, this impacts the angular momentum retained by ETGs and is consistent with the previous item (Fig. 5, see also van de Sande et al. 2021). The presence of AGN feedback is also required to regulate the SF activity and reproduce the decreasing trend with stellar mass (Fig. 2) in better agreement with observations (e.g., Wuyts et al. 2011).
-
In both simulations, there is a tight relation between mass and radius, as shown in Fig. 3. Horizon-AGN galaxies present clearer trends of rotation and age (more massive galaxies are older and slower rotators) across the mass–size relation than those found in the absence of AGN. Moreover, a few low-mass galaxies dominated by old SPs are found in Horizon-noAGN, which may be attributed to the fact that these systems are more affected by SN feedback. We note that this process has not been recalibrated in Horizon-noAGN. Hence, its role might not be described well. In Horizon-AGN, the transition to ETGs dominated by younger stars and more rotationally supported occurs at ∼6 kpc. Around this radius, the mean stellar mass is ∼2.2 × 10¹⁰ M⊙ and the mean dynamical mass is ∼7.0 × 10¹⁰ M⊙.
-
As shown in Fig. 7, in Horizon-AGN, we find that the mass–plane evolves for z > 1. This agrees with the redshift at which AGN feedback starts to have an impact on the slope of the relation between sSFR and stellar mass (Fig. 11). In Horizon-noAGN, the mass–plane evolves strongly for z > 0 (Fig. 7). The tilt from the virial relation is more important in the absence of AGN feedback (Fig. 6). In the Horizon-AGN simulation, the coefficient of the velocity dispersion remains closer to that expected from the virial theorem as a function of redshift, whereas the coefficient of Rhm is slightly smaller than the theoretical one.
-
Figure 9 shows that the FP of ETGs with AGN follows a similar relation to the observed FP at z = 0 (Cappellari et al. 2013a). The evolution of the Horizon-AGN FP with redshift is very mild from z ∼ 2. Conversely, the Horizon-noAGN FP departs from the observed FP for radii larger than ∼4 kpc at all analysed redshifts. The main difference is caused by the presence of extended galaxies with high surface density (see also Peirani et al. 2019).
-
It can be seen from Fig. 2 that the SF activity is regulated by AGN feedback so that the observed anti-correlation between the sSFR and the stellar mass is reproduced. We note that such regulation is not sufficient to reproduce Hernández-Toledo et al. (2010) lower values of sSFR. However, recent observations report the existence of rejuvenated AGN galaxies (Yates & Kauffmann 2014; Lacerna et al. 2020), which should be taken into account when revising the models. Horizon-noAGN ETGs present an excess of sSFR with similar values for all analysed stellar masses. The evolution of the sSFR as a function of time shows a similar flat trend contrary to the relations obtained when AGN feedback is turned on (Fig. 11). AGN feedback regulates the level of SF activity as a function of redshift and consequently, it also modulates its dependence on stellar mass, producing relations in better agreement with observations. The impact of AGN feedback is very clear from z ∼ 1.
-
The strong impact of AGN feedback from z ∼ 1 is impressed in the evolution of the mass–plane and the FP. Both relations show a stronger evolution since this redshift. The imprint of AGN feedback on the power spectrum and subsequent regulation of the SF at galaxy scales leave features in the dependence of the scatter of the FP on stellar age and V/σ (Fig. 12). Hence, the analysis of the FP and its scatter as a function of redshift opens the possibility to underpin the variation of the AGN feedback efficiency across time.
-
The action of AGN feedback has also an impact on the M/L ratios, which get larger with decreasing redshift as the SP ages (as shown in Fig. 14). The variation of the M/L as a function of stellar mass surface density (at least in part) explains the differences found in L-FP, which is strongly tilted with respect to the theoretical prediction compared to the weaker tilt found when using surface stellar density and has a different dependence on stellar age.
-
Figure 15 shows that when restricting the analysis of the FP to passive ETGs, we found that those with median ages older than 109.75 yr have residuals that increase for increasing age in agreement with Lu et al. (2020) for the IllustrisTNG simulation and with observations (e.g., van Dokkum & Franx 1996; Terlevich & Forbes 2002). However, 0.70% of Horizon ETGs with V/σ < 0.3 have been slightly rejuvenated and have median positive residuals for which there seems to be an anti-correlation with age; but there are not enough data to draw a robust conclusion. The presence of these ETGs suggests the need for further suppression of SF activity.
Overall, our findings show that the FP is more sensitive to the action of the AGN feedback than the mass–plane since it affects the stellar surface density and the M/L significantly. The evolution of the FP as well as its dependence on stellar age and galaxy morphology can thus provide detailed insights into the action of AGN feedback as a function of time.
Although in some cases the smoothing methods can overemphasise features, we carefully checked for possible spurious results between the smoothed and non-smoothed versions.
Hereafter, the subscript I will be used to denote the fitting parameters for the L-PFs.
Simulated AB magnitudes are obtained by means of SP models from Bruzual & Charlot (2003) and a Salpeter IMF. The total flux for each frequency is passed through the different SDSS filters, in particular, the r band (see more details in Chisari et al. 2015)
Hereafter, we fix the colour-bar limits to the first and third quartiles of the corresponding values.
We applied the moving median to estimate this relation.
Acknowledgments
We thank the referee for useful comments, which helped to improve this paper. PBT acknowledges support from CONICYT project Basal AFB-170002 (Chile) and Fondecyt Regular 1200703-2020. This work was partially supported through MINECO/FEDER (Spain) PGC2018- 094975-C21 grant. This project has received funding from the European Union’s Horizon 2020 Research and Innovation Programme under the Marie Skłodowska-Curie grant agreement No 734374- LACEGAL. MSR and PBT acknowledge funding from the same Horizon 2020 grant for a secondment at the Astrophysics group of Univ. Autónoma de Madrid (Madrid, Spain). This work has made use of the HPC resources of CINES (Jade and Occigen supercomputer) under the time allocations 2013047012, 2014047012 and 2015047012 made by GENCI. This work is partially supported by the Spin(e) grants ANR-13-BS05-0005 (http://cosmicorigin.org) of the French Agence Nationale de la Recherche and by the ILP LABEX (under reference ANR-10-LABX-63 and ANR-11- IDEX-0004-02). We thank S. Rouberol for running smoothly the Horizon cluster for us. Part of the analysis of the simulation was performed on the DiRAC facility jointly funded by STFC, BIS and the University of Oxford. This work is part of the Delta ITP consortium, a program of the Netherlands Organisation for Scientific Research (NWO) that is funded by the Dutch Ministry of Education, Culture and Science (OCW). NEC was partly supported by a Royal Astronomical Society Research fellowship during the preparation of this work.
References
- Aguado, D. S., Ahumada, R., Almeida, A., et al. 2019, ApJS, 240, 23 [Google Scholar]
- Aubert, D., Pichon, C., & Colombi, S. 2004, MNRAS, 352, 376 [NASA ADS] [CrossRef] [Google Scholar]
- Avila-Reese, V., Zavala, J., & Lacerna, I. 2014, MNRAS, 441, 417 [NASA ADS] [CrossRef] [Google Scholar]
- Baldry, I. K., Glazebrook, K., Brinkmann, J., et al. 2004, ApJ, 600, 681 [Google Scholar]
- Beckmann, R. S., Devriendt, J., Slyz, A., et al. 2017, MNRAS, 472, 949 [NASA ADS] [CrossRef] [Google Scholar]
- Bernardi, M., Sheth, R. K., Annis, J., et al. 2003, AJ, 125, 1866 [Google Scholar]
- Bernardi, M., Domínguez Sánchez, H., Margalef-Bentabol, B., Nikakhtar, F., & Sheth, R. K. 2020, MNRAS, 494, 5148 [Google Scholar]
- Bertin, G., Ciotti, L., & Del Principe, M. 2002, A&A, 386, 149 [NASA ADS] [CrossRef] [EDP Sciences] [Google Scholar]
- Binney, J., & Tremaine, S. 1987, Galactic Dynamics (Princeton: Princeton University Press) [Google Scholar]
- Bolton, A. S., Burles, S., Treu, T., Koopmans, L. V. E., & Moustakas, L. A. 2007, ApJ, 665, L105 [CrossRef] [Google Scholar]
- Borriello, A., Salucci, P., & Danese, L. 2003, MNRAS, 341, 1109 [NASA ADS] [CrossRef] [Google Scholar]
- Bruzual, G., & Charlot, S. 2003, MNRAS, 344, 1000 [NASA ADS] [CrossRef] [Google Scholar]
- Bryant, J. J., Owers, M. S., Robotham, A. S. G., et al. 2015, MNRAS, 447, 2857 [NASA ADS] [CrossRef] [Google Scholar]
- Burkert, A. 2004, in The Formation and Evolution of Massive Young Star Clusters, eds. H. J. G. L. M. Lamers, L. J. Smith, & A. Nota, ASP Conf. Ser., 322, 489 [Google Scholar]
- Cappellari, M. 2016, ARA&A, 54, 597 [NASA ADS] [CrossRef] [Google Scholar]
- Cappellari, M., Emsellem, E., Krajnović, D., et al. 2011, MNRAS, 413, 813 [NASA ADS] [CrossRef] [Google Scholar]
- Cappellari, M., McDermid, R., Alatalo, K., et al. 2013a, MNRAS, 432, 1709 [NASA ADS] [CrossRef] [Google Scholar]
- Cappellari, M., McDermid, R. M., Alatalo, K., et al. 2013b, MNRAS, 432, 1862 [Google Scholar]
- Chisari, N., Codis, S., Laigle, C., et al. 2015, MNRAS, 454, 2736 [NASA ADS] [CrossRef] [Google Scholar]
- Chisari, N. E., Richardson, M. L. A., Devriendt, J., et al. 2018, MNRAS, 480, 3962 [NASA ADS] [CrossRef] [Google Scholar]
- Choi, H., Yi, S. K., Dubois, Y., et al. 2018, ApJ, 856, 114 [Google Scholar]
- Ciotti, L., Lanzoni, B., & Renzini, A. 1996, MNRAS, 282, 1 [Google Scholar]
- Clauwens, B., Schaye, J., Franx, M., & Bower, R. G. 2018, MNRAS, 478, 3994 [NASA ADS] [CrossRef] [Google Scholar]
- Cleveland, W. S., & Devlin, S. J. 1988, J. Am. Statist. Assoc., 83, 596 [CrossRef] [Google Scholar]
- Cook, M., Lapi, A., & Granato, G. L. 2009, MNRAS, 397, 534 [NASA ADS] [CrossRef] [Google Scholar]
- Crain, R. A., Theuns, T., Dalla Vecchia, C., et al. 2009, MNRAS, 399, 1773 [NASA ADS] [CrossRef] [Google Scholar]
- Crain, R. A., Schaye, J., Bower, R. G., et al. 2015, MNRAS, 450, 1937 [NASA ADS] [CrossRef] [Google Scholar]
- Croom, S. M., Lawrence, J. S., Bland-Hawthorn, J., et al. 2012, MNRAS, 421, 872 [NASA ADS] [Google Scholar]
- Dekel, A., & Silk, J. 1986, ApJ, 303, 39 [Google Scholar]
- Djorgovski, S., & Davis, M. 1987, ApJ, 313, 59 [Google Scholar]
- Domínguez-Tenreiro, R., Oñorbe, J., Sáiz, A., Artal, H., & Serna, A. 2006, ApJ, 636, L77 [NASA ADS] [CrossRef] [Google Scholar]
- Domínguez-Tenreiro, R., Oñorbe, J., Martínez-Serrano, F., & Serna, A. 2011, MNRAS, 413, 3022 [CrossRef] [Google Scholar]
- Dressler, A., Lynden-Bell, D., Burstein, D., et al. 1987, ApJ, 313, 42 [Google Scholar]
- Dubois, Y., & Teyssier, R. 2008, A&A, 477, 79 [NASA ADS] [CrossRef] [EDP Sciences] [Google Scholar]
- Dubois, Y., Devriendt, J., Slyz, A., & Teyssier, R. 2012, MNRAS, 420, 2662 [NASA ADS] [CrossRef] [Google Scholar]
- Dubois, Y., Gavazzi, R., Peirani, S., & Silk, J. 2013, MNRAS, 433, 3297 [Google Scholar]
- Dubois, Y., Pichon, C., Welker, C., et al. 2014, MNRAS, 444, 1453 [NASA ADS] [CrossRef] [Google Scholar]
- Dubois, Y., Peirani, S., Pichon, C., et al. 2016, MNRAS, 463, 3948 [Google Scholar]
- Dutton, A. A., & Treu, T. 2014, MNRAS, 438, 3594 [CrossRef] [Google Scholar]
- Emsellem, E., Cappellari, M., Krajnović, D., et al. 2011, MNRAS, 414, 888 [Google Scholar]
- Faber, S. M., Dressler, A., Davies, R. L., Burstein, D., & Lynden-Bell, D. 1987, in Nearly Normal Galaxies. From the Planck Time to the Present, ed. S. M. Faber, 175 [Google Scholar]
- Genel, S., Vogelsberger, M., Springel, V., et al. 2014, MNRAS, 445, 175 [Google Scholar]
- Graham, A., & Colless, M. 1997, MNRAS, 287, 221 [Google Scholar]
- Graham, M. T., Cappellari, M., Li, H., et al. 2018, MNRAS, 477, 4711 [Google Scholar]
- Haardt, F., & Madau, P. 1996, ApJ, 461, 20 [NASA ADS] [CrossRef] [Google Scholar]
- Haas, M. R., Schaye, J., Booth, C. M., et al. 2013, MNRAS, 435, 2931 [NASA ADS] [CrossRef] [Google Scholar]
- Habouzit, M., Genel, S., Somerville, R. S., et al. 2019, MNRAS, 484, 4413 [CrossRef] [Google Scholar]
- Hayward, C. C., & Hopkins, P. F. 2016, MNRAS, 465, 1682 [NASA ADS] [CrossRef] [Google Scholar]
- Hernández-Toledo, H. M., Vázquez-Mata, J. A., Martínez-Vázquez, L. A., Choi, Y.-Y., & Park, C. 2010, AJ, 139, 2525 [NASA ADS] [CrossRef] [Google Scholar]
- Hyde, J. B., & Bernardi, M. 2009, MNRAS, 396, 1171 [NASA ADS] [CrossRef] [Google Scholar]
- Kaviraj, S., Laigle, C., Kimm, T., et al. 2017, MNRAS, 467, 4739 [NASA ADS] [Google Scholar]
- Kennicutt, R. C., Jr 1998, ARA&A, 36, 189 [Google Scholar]
- Komatsu, E., Smith, K. M., Dunkley, J., et al. 2011, ApJS, 192, 18 [NASA ADS] [CrossRef] [Google Scholar]
- Kormendy, J. 2016, Galactic Bulges, 418, 431 [NASA ADS] [CrossRef] [Google Scholar]
- Krumholz, M. R., & Tan, J. C. 2007, ApJ, 654, 304 [NASA ADS] [CrossRef] [Google Scholar]
- Lacerna, I., Rodríguez-Puebla, A., Avila-Reese, V., & Hernández-Toledo, H. M. 2014, ApJ, 788, 29 [NASA ADS] [CrossRef] [Google Scholar]
- Lacerna, I., Ibarra-Medel, H., Avila-Reese, V., et al. 2020, A&A, 644, A117 [CrossRef] [EDP Sciences] [Google Scholar]
- Lagos, C. D. P., Schaye, J., Bahé, Y., et al. 2018, MNRAS, 476, 4327 [Google Scholar]
- Larson, R. B. 1974, MNRAS, 169, 229 [NASA ADS] [CrossRef] [Google Scholar]
- Li, H., Mao, S., Cappellari, M., et al. 2018, MNRAS, 476, 1765 [NASA ADS] [Google Scholar]
- Lu, S., Xu, D., Wang, Y., et al. 2020, MNRAS, 492, 5930 [Google Scholar]
- Ma, C.-P., Greene, J. E., McConnell, N., et al. 2014, ApJ, 795, 158 [Google Scholar]
- Marinacci, F., Vogelsberger, M., Pakmor, R., et al. 2018, MNRAS, 480, 5113 [NASA ADS] [Google Scholar]
- Merloni, A., & Heinz, S. 2008, MNRAS, 388, 1011 [NASA ADS] [Google Scholar]
- Mo, H., van den Bosch, F. C., & White, S. 2010, Galaxy Formation and Evolution (Cambridge: Cambridge University Press) [Google Scholar]
- Naab, T. 2013, in The Intriguing Life of Massive Galaxies, eds. D. Thomas, A. Pasquali, & I. Ferreras, IAU Symp., 295, 340 [NASA ADS] [Google Scholar]
- Naiman, J. P., Pillepich, A., Springel, V., et al. 2018, MNRAS, 477, 1206 [CrossRef] [Google Scholar]
- Nelson, D., Pillepich, A., Springel, V., et al. 2018, MNRAS, 475, 624 [NASA ADS] [CrossRef] [Google Scholar]
- Oñorbe, J., Domínguez-Tenreiro, R., Sáiz, A., Serna, A., & Artal, H. 2005, ApJ, 632, L57 [NASA ADS] [CrossRef] [Google Scholar]
- Oñorbe, J., Domínguez-Tenreiro, R., Sáiz, A., Artal, H., & Serna, A. 2006, MNRAS, 373, 503 [NASA ADS] [CrossRef] [Google Scholar]
- Oñorbe, J., Domínguez-Tenreiro, R., Sáiz, A., & Serna, A. 2007, MNRAS, 376, 39 [NASA ADS] [CrossRef] [Google Scholar]
- Oñorbe, J., Martínez-Serrano, F. J., Domínguez-Tenreiro, R., Knebe, A., & Serna, A. 2011, ApJ, 732, L32 [CrossRef] [Google Scholar]
- Oser, L., Ostriker, J. P., Naab, T., Johansson, P. H., & Burkert, A. 2010, ApJ, 725, 2312 [NASA ADS] [CrossRef] [Google Scholar]
- Pedrosa, S. E., & Tissera, P. B. 2015, A&A, 584, A43 [NASA ADS] [CrossRef] [EDP Sciences] [Google Scholar]
- Peirani, S., Dubois, Y., Volonteri, M., et al. 2017, MNRAS, 472, 2153 [CrossRef] [Google Scholar]
- Peirani, S., Sonnenfeld, A., Gavazzi, R., et al. 2019, MNRAS, 483, 4615 [NASA ADS] [CrossRef] [Google Scholar]
- Peng, Y.-J., Lilly, S. J., Kovač, K., et al. 2010, ApJ, 721, 193 [NASA ADS] [CrossRef] [Google Scholar]
- Pillepich, A., Nelson, D., Hernquist, L., et al. 2018, MNRAS, 475, 648 [NASA ADS] [CrossRef] [Google Scholar]
- Prugniel, P., & Simien, F. 1997, A&A, 321, 111 [NASA ADS] [Google Scholar]
- Prunet, S., Pichon, C., Aubert, D., et al. 2008, ApJS, 178, 179 [NASA ADS] [CrossRef] [Google Scholar]
- Rasera, Y., & Teyssier, R. 2006, A&A, 445, 1 [NASA ADS] [CrossRef] [EDP Sciences] [Google Scholar]
- Renzini, A., & Ciotti, L. 1993, ApJ, 416, L49 [NASA ADS] [CrossRef] [Google Scholar]
- Rodriguez-Gomez, V., Pillepich, A., Sales, L. V., et al. 2016, MNRAS, 458, 2371 [NASA ADS] [CrossRef] [Google Scholar]
- Rosas-Guevara, Y. M., Bower, R. G., Schaye, J., et al. 2015, MNRAS, 454, 1038 [CrossRef] [Google Scholar]
- Rosas-Guevara, Y., Bower, R. G., Schaye, J., et al. 2016, MNRAS, 462, 190 [NASA ADS] [CrossRef] [Google Scholar]
- Rosito, M. S., Pedrosa, S. E., Tissera, P. B., et al. 2018, A&A, 614, A85 [NASA ADS] [CrossRef] [EDP Sciences] [Google Scholar]
- Rosito, M. S., Tissera, P. B., Pedrosa, S. E., & Lagos, C. D. P. 2019a, A&A, 629, L3 [CrossRef] [EDP Sciences] [Google Scholar]
- Rosito, M. S., Tissera, P. B., Pedrosa, S. E., & Rosas-Guevara, Y. 2019b, A&A, 629, A37 [CrossRef] [EDP Sciences] [Google Scholar]
- Rousseeuw, P. J., & Leroy, A. M. 1987, Robust Regression and Outlier Detection (New Jersey: John Wiley& Sons, Inc.) [CrossRef] [Google Scholar]
- Saglia, R. P., Bender, R., & Dressler, A. 1993, A&A, 279, 75 [NASA ADS] [Google Scholar]
- Salpeter, E. E. 1955, ApJ, 121, 161 [Google Scholar]
- Sánchez, S. F., Kennicutt, R. C., Gil Paz, A., et al. 2012, A&A, 538, A8 [NASA ADS] [CrossRef] [EDP Sciences] [Google Scholar]
- Saulder, C., Mieske, S., Zeilinger, W. W., & Chilingarian, I. 2013, A&A, 557, A21 [NASA ADS] [CrossRef] [EDP Sciences] [Google Scholar]
- Schaye, J., Dalla Vecchia, C., Booth, C. M., et al. 2010, MNRAS, 402, 1536 [Google Scholar]
- Schaye, J., Crain, R. A., Bower, R. G., et al. 2015, MNRAS, 446, 521 [Google Scholar]
- Sérsic, J. L. 1968, Atlas de Galaxias Australes (Argentina: Observatorio Astronomico) [Google Scholar]
- Sijacki, D., Vogelsberger, M., Genel, S., et al. 2015, MNRAS, 452, 575 [NASA ADS] [CrossRef] [Google Scholar]
- Solar, M., Tissera, P. B., & Hernandez-Jimenez, J. A. 2020, MNRAS, 491, 4894 [CrossRef] [Google Scholar]
- Somerville, R. S., & Davé, R. 2015, ARA&A, 53, 51 [Google Scholar]
- Springel, V., Pakmor, R., Pillepich, A., et al. 2018, MNRAS, 475, 676 [NASA ADS] [CrossRef] [Google Scholar]
- Sutherland, R. S., & Dopita, M. A. 1993, ApJS, 88, 253 [NASA ADS] [CrossRef] [Google Scholar]
- Taranu, D., Dubinski, J., & Yee, H. K. C. 2015, ApJ, 803, 78 [Google Scholar]
- Terlevich, A. I., & Forbes, D. A. 2002, MNRAS, 330, 547 [NASA ADS] [CrossRef] [Google Scholar]
- Teyssier, R. 2002, A&A, 385, 337 [NASA ADS] [CrossRef] [EDP Sciences] [Google Scholar]
- Tissera, P. B., White, S. D. M., & Scannapieco, C. 2012, MNRAS, 420, 255 [NASA ADS] [CrossRef] [Google Scholar]
- Trujillo, I., Burkert, A., & Bell, E. F. 2004, ApJ, 600, L39 [Google Scholar]
- Tweed, D., Devriendt, J., Blaizot, J., Colombi, S., & Slyz, A. 2009, A&A, 506, 647 [NASA ADS] [CrossRef] [EDP Sciences] [Google Scholar]
- van de Sande, J., Lagos, C. D. P., Welker, C., et al. 2019, MNRAS, 484, 869 [NASA ADS] [CrossRef] [Google Scholar]
- van de Sande, J., Vaughan, S. P., Cortese, L., et al. 2021, MNRAS, 505, 3078 [CrossRef] [Google Scholar]
- van Dokkum, P. G., & Franx, M. 1996, MNRAS, 281, 985 [NASA ADS] [CrossRef] [Google Scholar]
- Volonteri, M., Dubois, Y., Pichon, C., & Devriendt, J. 2016, MNRAS, 460, 2979 [Google Scholar]
- Wechsler, R. H., Bullock, J. S., Primack, J. R., Kravtsov, A. V., & Dekel, A. 2002, ApJ, 568, 52 [NASA ADS] [CrossRef] [Google Scholar]
- White, S. D. M., & Rees, M. J. 1978, MNRAS, 183, 341 [NASA ADS] [CrossRef] [Google Scholar]
- White, S. D. M., & Frenk, C. S. 1991, ApJ, 379, 52 [NASA ADS] [CrossRef] [Google Scholar]
- Wuyts, S., Förster Schreiber, N. M., van der Wel, A., Magnelli, B., & Guo, Y. 2011, ApJ, 742, 96 [NASA ADS] [CrossRef] [Google Scholar]
- Yates, R. M., & Kauffmann, G. 2014, MNRAS, 439, 3817 [CrossRef] [Google Scholar]
- Zhao, D. H., Jing, Y. P., Mo, H. J., & Börner, G. 2003, ApJ, 597, L9 [NASA ADS] [CrossRef] [Google Scholar]
Appendix A: Morphological classification
In this work, we apply the criterion in Chisari et al. (2015) to morphologically classify galaxies in ETGs and LTGs. In this appendix, we verify the consistency of this criterion with that used by Rosito et al. (2018, 2019a), and Rosito et al. (2019b), in which galaxies are classified via the B/T ratio following the method described in Tissera et al. (2012), where B/T = 0.5 is the adopted threshold for a galaxy to be considered spheroid dominated.
We measure the amount of rotation in the analysed samples quantitatively. For this purpose, we calculate a parameter σ/V for each stellar particle within Ropt. We define the dispersion locally by taking radial bins around the centre of a galaxy in which we calculate the average of each velocity component. Thus, σ for each particle is calculated relative to that average and V is the particle tangential velocity. If 0 < σ/V < 1, that particle is considered part of the disc and thus, we are able to calculate disc-to-total stellar mass ratio (D/T), which may play the role of B/T in the works mentioned above. On the other hand, the bulge is defined by the stellar particles with |σ/V|< 1 located within 0.5Rhm. We note that here the definition of the bulge is different from that employed by Rosito et al. (2018) and Rosito et al. (2019b). In those works, the bulge particles are defined as the ones without ordered rotation that are most gravitationally bound. In Fig. A.1 we show the distribution of σ/V for an individual ETGs from Horizon-AGN simulation. It is clear that there is no counter-disc and that the galaxy is dominated by velocity dispersion.
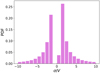 |
Fig. A.1. Distribution of σ/V estimated for each stellar particles for a typical ETG selected from the Horizon-AGN simulation. |
As regards the comparison between D/T calculated as described above and the global parameter V/σ (Dubois et al. 2014) utilised for the classification in this work, we find an excellent correlation between them, with a p-value of the Spearman coefficient near 0 in the selected sample of Horizon-AGN (see Fig. A.2). Therefore, we conclude the consistency between both classifications.
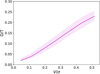 |
Fig. A.2. D/T as a function of V/σ for central ETGs from Horizon-AGN simulation. The remarkable correlation (p-value ∼ 0) between them verify the consistency of our morphological classification and that presented in Rosito et al. (2018). |
All Tables
Evolution of L-FP parameters for Horizon-AGN central ETGs and for the subsample obtained with the restriction V/σ < 0.3.
All Figures
|
Fig. 1. Stellar mass distributions for the selected samples at z = 0 of central ETGs from Horizon-AGN (magenta) and Horizon-noAGN (blue). The differences show that in the absence of AGN feedback there are fewer massive central ETGs. The existence of a small tail of massive galaxies in Horizon-noAGN, which may be a result of the lack of AGN feedback, is noted. |
| In the text | |
|
Fig. 2. Specific SFR as a function of stellar mass for central ETGs from Horizon-AGN (magenta) and from Horizon-noAGN (blue). The 25 and 75% are depicted by the shaded region. The line separating active and passive galaxies (above and below the line, respectively) reported by Lacerna et al. (2014) and observations of isolated ETGs from UNAM-KIAS catalogue (yellow stars; Hernández-Toledo et al. 2010) are included. |
| In the text | |
|
Fig. 3. Mass–size relation as a function of stellar V/σ (left panels) and mass-weighted average stellar age (right panels) for both samples of central ETGs at z = 0. |
| In the text | |
|
Fig. 4. Left panel: Frot as a function of V/σ for central ETGs from Horizon-AGN (magenta) and Horizon-noAGN (blue) simulations. The 25 and 75% are depicted by the shaded regions. Right panel: histograms of Frot for central ETGs selected from Horizon-AGN (magenta), Horizon-noAGN (blue), and EAGLE (yellow) at z = 0. |
| In the text | |
|
Fig. 5. Left panel: histograms of the spin parameter for central ETGs from Horizon-AGN (magenta) and Horizon-noAGN (blue). Right panel: spin parameter as a function of V/σ for Horizon-AGN (magenta) and Horizon-noAGN (blue) samples. The shaded regions depict the 25 and 75%. We include the scatter plots for both simulations. |
| In the text | |
|
Fig. 6. Mass–plane as a function of redshift for central ETGs from Horizon-AGN (left panel) and Horizon-noAGN (right panel). The magenta, blue, red, green, and yellow lines depict the simulated relations at z = 0, z = 0.5, z = 1, z = 2, and z = 3, respectively. The shaded regions delimit the 25 and 75%. The virial relation for z = 0 is shown with a black solid line. Observations from ATLAS3D project (Cappellari et al. 2011,2013a, b) at z = 0 are included for comparison (black crosses). |
| In the text | |
|
Fig. 7. Differences between logMfit (defined in Eq. (2)) computed with parameters at z = 0 and stellar mass at different redshifts for central ETGs from Horizon-AGN (left panel) and Horizon-noAGN (right panel). The magenta, blue, red, green, and yellow lines depict the simulated relations at z = 0, z = 0.5, z = 1, z = 2, and z = 3, respectively. The shaded regions are delimited by the 25 and 75%. |
| In the text | |
|
Fig. 8. Fundamental plane as a function of redshift for central ETGs from Horizon-AGN (left panel) and Horizon-noAGN (right panel). The magenta, blue, red, green, and yellow lines depict the simulated relations at z = 0, z = 0.5, z = 1, z = 2, and z = 3, respectively. The regions between the 25 and 75% are shaded. The virial relation for galaxies at z = 0 (black solid line) is included. For comparison, the observational results from ATLAS3D are indicated in black crosses. |
| In the text | |
|
Fig. 9. Upper panels: fundamental plane for Horizon-AGN (left panel) and Horizon-noAGN (right panel) central ETGs obtained with the parameters calculated with data from Cappellari et al. (2013a) estimated at z = 0 (magenta lines), z = 0.5 (blue lines), z = 1 (red lines), z = 2 (green lines), and z = 3 (yellow lines). The regions between the 25 and 75% are shaded. For comparison, the observational results from ATLAS3D (black crosses) are also included. Lower panels: similar relations for z = 0 including the individual galaxies. The scatter plot of the simulated galaxies is depicted in grey circles in both panels. Horizon-noAGN central ETGs with average surface density greater than 109.5 M⊙ kpc−2 are highlighted (green squares). Such dense galaxies do not exist in the Horizon-AGN sample. The 1:1 line is depicted in black. |
| In the text | |
|
Fig. 10. Luminosity-FP for Horizon-AGN central ETGs sample computing the average surface brightness for both observations (Cappellari et al. 2013a) and simulation, using the luminosity in the r band. |
| In the text | |
|
Fig. 11. Specific SFR as a function of stellar mass for Horizon-AGN (left panel) and Horizon-noAGN (right panel) central ETGs at different redshifts. At z = 1 there is a change in the slope for the Horizon-AGN samples, while the sSFR does not depend on stellar mass in the absence of AGN feedback. |
| In the text | |
|
Fig. 12. Fundamental plane for Horizon-AGN and Horizon-noAGN central ETGs fitted at different redshifts. The symbols are coloured according to mass-weighted average stellar age (upper panels) and the stellar V/σ (lower panels). The 1:1 line is depicted in black. |
| In the text | |
|
Fig. 13. Upper panels: fundamental plane for Horizon-AGN central ETGs as a function of M/L at z = 0, 1 and z = 2. Symbols are coloured by M/L. Lower panels: relation between M/L ratio and velocity dispersion for the same galaxies. Symbols are coloured by the average surface density Σe. |
| In the text | |
|
Fig. 14. Luminosity-FP for Horizon-AGN central ETGs fitted at different redshifts, where ETGs are defined as those with V/σ < 0.3. The symbols are coloured according to mass-weighted stellar ages. The 1:1 line is depicted in black. |
| In the text | |
|
Fig. 15. Residuals of the L-FP at z = 0 with the restriction V/σ < 0.3 as a function of mass weighted average age (black line). The residuals of the subsample of passive galaxies (defined by Lacerna et al. 2014) are depicted in magenta lines. The regions between the 25 and 75% are shaded. |
| In the text | |
|
Fig. A.1. Distribution of σ/V estimated for each stellar particles for a typical ETG selected from the Horizon-AGN simulation. |
| In the text | |
|
Fig. A.2. D/T as a function of V/σ for central ETGs from Horizon-AGN simulation. The remarkable correlation (p-value ∼ 0) between them verify the consistency of our morphological classification and that presented in Rosito et al. (2018). |
| In the text | |
Current usage metrics show cumulative count of Article Views (full-text article views including HTML views, PDF and ePub downloads, according to the available data) and Abstracts Views on Vision4Press platform.
Data correspond to usage on the plateform after 2015. The current usage metrics is available 48-96 hours after online publication and is updated daily on week days.
Initial download of the metrics may take a while.