Fig. 7.
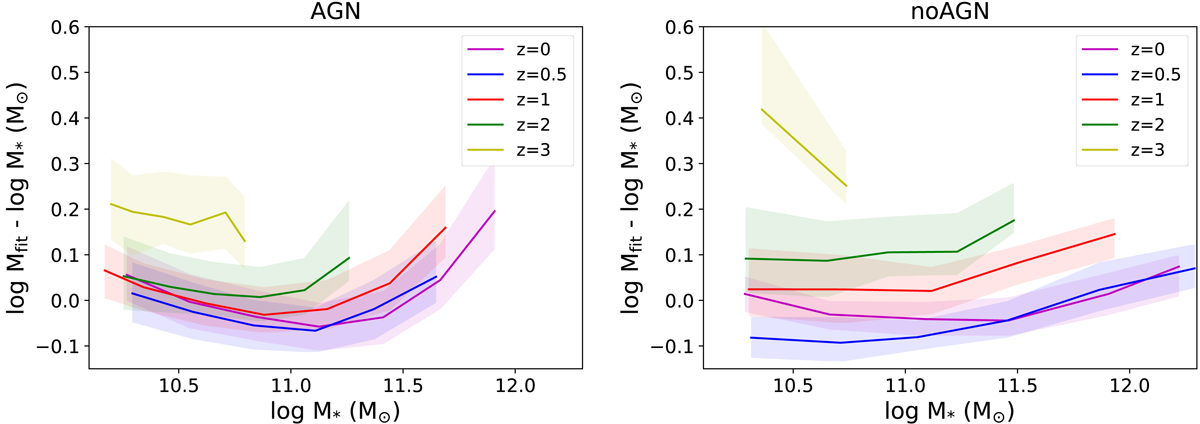
Differences between logMfit (defined in Eq. (2)) computed with parameters at z = 0 and stellar mass at different redshifts for central ETGs from Horizon-AGN (left panel) and Horizon-noAGN (right panel). The magenta, blue, red, green, and yellow lines depict the simulated relations at z = 0, z = 0.5, z = 1, z = 2, and z = 3, respectively. The shaded regions are delimited by the 25 and 75%.
Current usage metrics show cumulative count of Article Views (full-text article views including HTML views, PDF and ePub downloads, according to the available data) and Abstracts Views on Vision4Press platform.
Data correspond to usage on the plateform after 2015. The current usage metrics is available 48-96 hours after online publication and is updated daily on week days.
Initial download of the metrics may take a while.