Fig. 9.
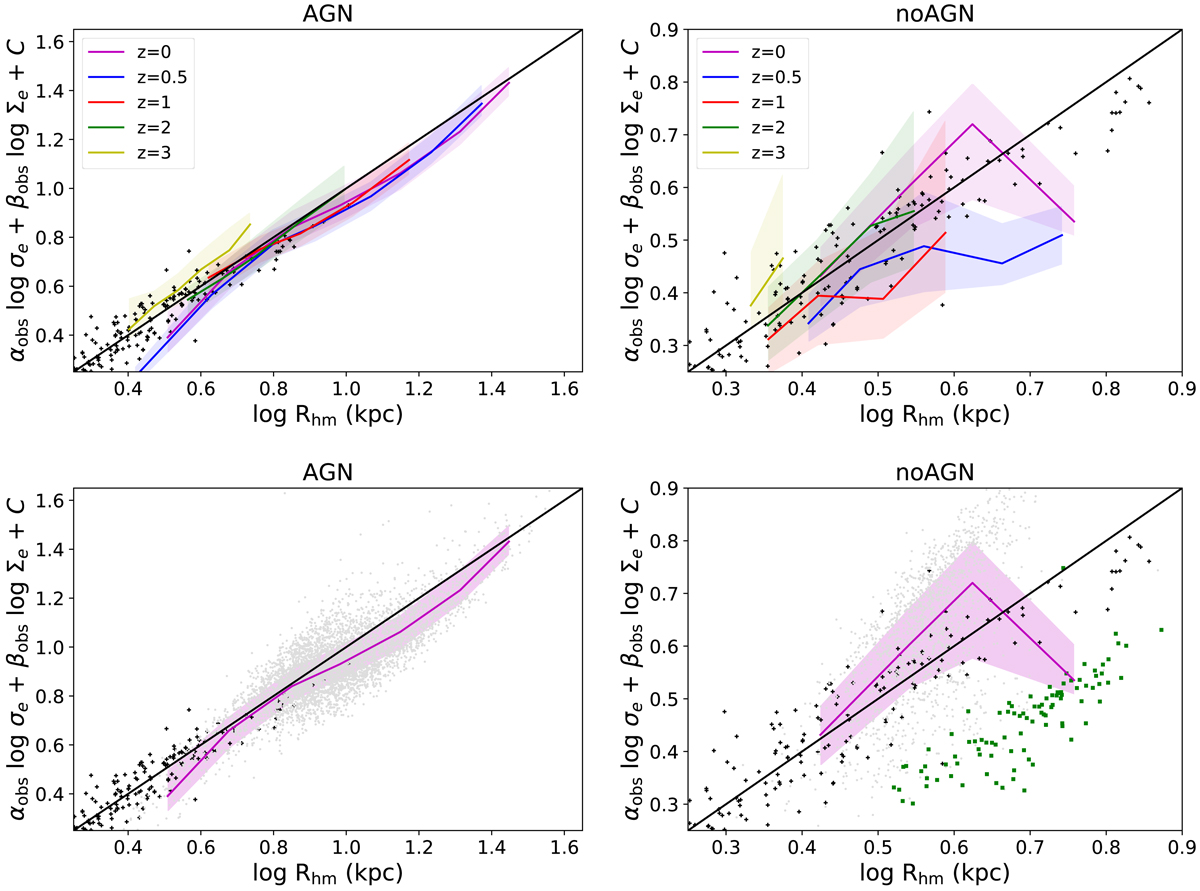
Upper panels: fundamental plane for Horizon-AGN (left panel) and Horizon-noAGN (right panel) central ETGs obtained with the parameters calculated with data from Cappellari et al. (2013a) estimated at z = 0 (magenta lines), z = 0.5 (blue lines), z = 1 (red lines), z = 2 (green lines), and z = 3 (yellow lines). The regions between the 25 and 75% are shaded. For comparison, the observational results from ATLAS3D (black crosses) are also included. Lower panels: similar relations for z = 0 including the individual galaxies. The scatter plot of the simulated galaxies is depicted in grey circles in both panels. Horizon-noAGN central ETGs with average surface density greater than 109.5 M⊙ kpc−2 are highlighted (green squares). Such dense galaxies do not exist in the Horizon-AGN sample. The 1:1 line is depicted in black.
Current usage metrics show cumulative count of Article Views (full-text article views including HTML views, PDF and ePub downloads, according to the available data) and Abstracts Views on Vision4Press platform.
Data correspond to usage on the plateform after 2015. The current usage metrics is available 48-96 hours after online publication and is updated daily on week days.
Initial download of the metrics may take a while.