Fig. 2.
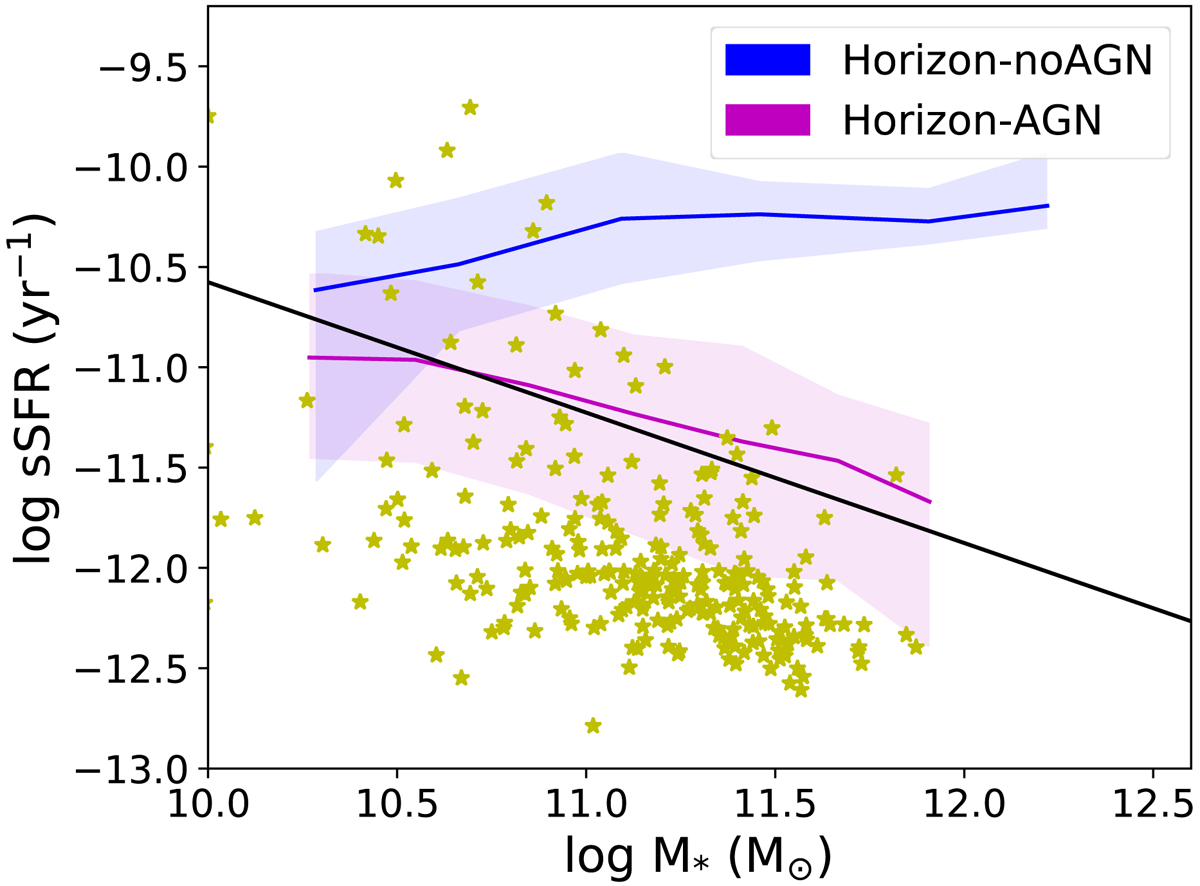
Specific SFR as a function of stellar mass for central ETGs from Horizon-AGN (magenta) and from Horizon-noAGN (blue). The 25 and 75% are depicted by the shaded region. The line separating active and passive galaxies (above and below the line, respectively) reported by Lacerna et al. (2014) and observations of isolated ETGs from UNAM-KIAS catalogue (yellow stars; Hernández-Toledo et al. 2010) are included.
Current usage metrics show cumulative count of Article Views (full-text article views including HTML views, PDF and ePub downloads, according to the available data) and Abstracts Views on Vision4Press platform.
Data correspond to usage on the plateform after 2015. The current usage metrics is available 48-96 hours after online publication and is updated daily on week days.
Initial download of the metrics may take a while.