Fig. 8.
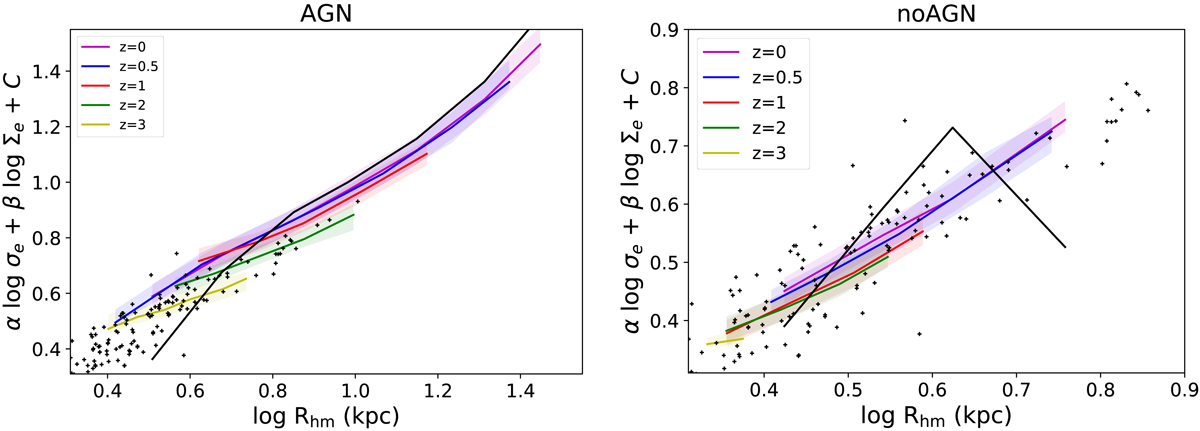
Fundamental plane as a function of redshift for central ETGs from Horizon-AGN (left panel) and Horizon-noAGN (right panel). The magenta, blue, red, green, and yellow lines depict the simulated relations at z = 0, z = 0.5, z = 1, z = 2, and z = 3, respectively. The regions between the 25 and 75% are shaded. The virial relation for galaxies at z = 0 (black solid line) is included. For comparison, the observational results from ATLAS3D are indicated in black crosses.
Current usage metrics show cumulative count of Article Views (full-text article views including HTML views, PDF and ePub downloads, according to the available data) and Abstracts Views on Vision4Press platform.
Data correspond to usage on the plateform after 2015. The current usage metrics is available 48-96 hours after online publication and is updated daily on week days.
Initial download of the metrics may take a while.