| Issue |
A&A
Volume 650, June 2021
|
|
|---|---|---|
| Article Number | A183 | |
| Number of page(s) | 14 | |
| Section | Extragalactic astronomy | |
| DOI | https://doi.org/10.1051/0004-6361/202140848 | |
| Published online | 30 June 2021 | |
In-depth investigation of the physical origin of the soft X-ray excess in PG 1448+273
1
School of Physical Science and Technology, Kunming University, Kunming 650214, PR China
e-mail: This email address is being protected from spambots. You need JavaScript enabled to view it.
2
School of Astronomy and Space Science, Nanjing University, Nanjing, Jiangsu 210093, PR China
e-mail: This email address is being protected from spambots. You need JavaScript enabled to view it.
3
Key Laboratory of Modern Astronomy and Astrophysics (Nanjing University), Ministry of Education, Nanjing 210093, PR China
4
School of Physics and Electronic Engineering, Jiangsu Second Normal University, Nanjing, Jiangsu 211200, PR China
e-mail: This email address is being protected from spambots. You need JavaScript enabled to view it.
5
College of Physics and Electronic Engineering, Qujing Normal University, Qujing 655011, PR China
6
Department of Physics and Astronomy, Yunnan University, Kunming 650091, PR China
Received:
22
March
2021
Accepted:
27
April
2021
Abstract
We present systematic X-ray spectral and variability analyses for the narrow-line Seyfert 1 galaxy (NLsy1), PG 1448+273, using the data from two long-exposure XMM-Newton observations of the source in the different flux states. These X-ray spectral analyses indicate that the two main-stream models of soft X-ray excess, the relativistically smeared reflection scenario and the warm corona scenario, show a similar statistical fit to the data sets. However, the warm corona scenario requires a black hole mass that is much larger than that estimated by the single-epoch optical spectroscopy and the X-ray variability scaling technology to alleviate the conflict between the X-ray and optical/ultraviolet data. The time-varying analyses reveal that PG 1448+273 has significant X-ray variability, especially in the low state. The features of X-ray spectra and variability show significant differences between the high and low states. At the low state, a highly variable ultra-fast outflow feature appears in the X-ray spectra, and the X-ray spectra show a very significant soft X-ray excess. At the high state, a ‘dip’, or oscillation, feature with ∼3.2σ confidence level emerges in the power spectral density at ν ∼ 103.6 Hz, which is a unique time signature of the reflected X-ray reprocessing. Meanwhile, we also detect a tentative soft lag. It is shown that these unique spectral features and variation behaviours can be explained self-consistently in the relativistically smeared reflection scenario, in which the geometric position of the corona changes. Our results suggest that PG 1448-273 can be used as an ideal object to further study the details of the relativistic reflection process.
Key words: galaxies: active / galaxies: individual: PG 1448+273 / black hole physics / X-rays: galaxies
Note to the reader: the size of Figures 1, 2, and 5 has been adjusted on 2 July 2021.
© ESO 2021
1. Introduction
Active galactic nuclei (AGNs) accreting supermassive black holes. They have complex broadband electromagnetic radiation, including non-thermal and thermal radiation components. Compared with optical/ultraviolet radiation, X-ray emission is weakly absorbed and can easily be distinguished from the starlight of the galaxy, thereby effectively providing critical physical information of the centre engine. The intrinsic X-ray radiation of AGNs is believed to be produced by the inverse Comptonization of a presumed hot (kT ∼ 100 keV), optically thin (τ ∼ 0.5) corona to the optical/ultraviolet photons from the accretion disk (Netzer 2013). The radiation component can usually be described by a cut-off power law with the spectral index of ∼1.8 − 2 and a cut-off energy of ∼300 keV. The X-ray spectra of some AGNs show obvious reflection components that are composed of a Compton hump with a peak at ∼30 keV and fluorescence lines, the most important of which is the Fe Kα line at ∼6 − 7 keV. These reflection components originate from the Comptonization reprocessing of the primary X-ray continuum on the broad- and narrow-line regions or the surface layer of the accretion disk or distant neutral material such as the molecular torus (Antonucci 1993; Netzer 2015). Compared with Seyfert 2 galaxies, Seyfert 1 galaxies are usually not or only slightly absorbed (NH ≤ 1022 cm−2). When the X-ray continuum in the high-energy band is extrapolated to the soft X-ray band, 90% of Seyfert 1 galaxies show obvious radiation excess relative to the extrapolated emission below ∼1 keV, which is called soft X-ray excess.
Soft X-ray excess was first discovered by Singh et al. (1985) and Arnaud et al. (1985) using HEAO-I and EXOSAT observations. Initially, this feature was considered the black-body radiation with temperatures of ∼0.1 − 0.2 keV from the innermost region of the accretion flow. However, this scenario was later ruled out because the standard accretion disk cannot produce such a high temperature. Furthermore, it has been found that the black-body temperature required for soft X-ray excess is independent of the black hole mass and remains between ∼0.1 − 0.2 keV (see e.g., Crummy et al. 2006), which disobeys the Stefan-Boltzmann law of the standard accretion disk. This feature also hints that the soft X-ray excess may be related to the physical process of an atomic transition. The study of Gierliński & Done (2004) on PG 1211+143 proposed that the soft X-ray excess could be the signature of strong, relativistically smeared, partially ionized absorption in the wind from the inner disk. However, in this case, extreme high smearing velocity (v ∼ 0.3c) is needed to reproduce the observed soft X-ray excess; such velocity is difficult to reach under the realistic accretion disk winds that are radiatively driven (Schurch & Done 2007; Schurch et al. 2009).
At present, the most promising explanations for soft X-ray excess are the warm corona scenario and the relativistically smeared reflection scenario. The former presumes that the soft X-ray excess originates from the up-scattered Comptonization process to the ultraviolet (UV) seed photons from the disk in a warm (kT ∼ 0.1–1 keV) and optically thick (τ ∼ 10–20) corona (see e.g., Done et al. 2012). This scenario has been successfully applied to several AGNs with smooth soft X-ray spectrum (e.g., RX J0439.6-5311 Jin et al. 2017; Mrk 509 Noda et al. 2011; Zw229.015 Tripathi et al. 2019; Mrk 359 Middei et al. 2020). The latter holds that the soft X-ray excess is a pseudo-continuum formed by the relativistically smeared, low-energy emission-line clusters produced by corona irradiation in the inner region of the accretion disk (see e.g., Fabian et al. 2002; Crummy et al. 2006). Because this scenario is related to the atomic transition process, it more easily explains why the soft X-ray excess has consistency characteristics under a broad black hole mass than the warm corona case. These two models can reproduce the observed X-ray spectrum well, and there is a tricky degeneracy in the goodness of fit (see e.g., Pal et al. 2016; Waddell et al. 2019). Time-varying analysis and spectral analysis for a broad X-ray spectrum are two possible ways to distinguish the two models. For example, Noda et al. (2011) analyse five observations of Mrk 509 from Suzaku. These authors find that the fast variability seen in the hard X-ray band does not appear in the soft X-ray excess, which rules out the origin of relativistic reflection for the soft X-ray excess in Mrk 509 because the soft X-ray should closely follow the hard X-ray variability in the relativistic reflection models (similar results are also shown in Mehdipour et al. 2011 and Boissay et al. 2014). Jin et al. (2017) analyse the variability of RX J0439.6-5311 in detail with a 133 ks XMM-Newton observation. They find a ∼4 ks hard lag (the variability of hard X-ray lag behind that of soft X-ray) with a broad continuum-like profile in the lag spectrum, suggesting that in RX J0439.6-5311, the soft X-ray excess is derived from a separate low temperature, optically thick Comptonization component rather than relativistic reflection or a jet.
In contrast, Waddell et al. (2019) investigate the multi-epoch X-ray spectral variability of Mrk 478 by principal component analysis and point out that the feature of spectral variability favours the relativistic reflection scenario. In a considerable sample of objects, soft X-ray reverberation lags is detected, which is a typical signature of disk reflection, supporting the origin of relativistic reflection for soft X-ray excess (De Marco et al. 2011; Cackett et al. 2013; De Marco et al. 2013; Chiang et al. 2017; Mallick et al. 2018). In addition, studies on several AGNs show that the origin of soft X-ray excess in these sources may be ‘hybrid’ and have more or fewer contributions from the warm corona and relativistic reflection (e.g., Ton S180 (Parker et al. 2018; Matzeu et al. 2020) and PG 1244+026 (Alston et al. 2014)). Therefore, it can be found that these opposite results seem to imply that the origin of soft X-ray excess is diverse, which makes the nature of the soft X-ray excess still not fully understood until now. It is valuable to deeply analyse the origin of the soft X-ray excess for a larger number of typical AGNs, which can provide more clues to the nature of the soft X-ray excess. Especially when the origin of the soft X-ray excess in a certain AGN can be self-consistent and fully determined, the source can be used as an ideal object to study the more detailed physical process of this mechanism. Narrow-line Seyfert 1 (NLsy1) galaxies usually exhibit a more pronounced soft X-ray excess compared to broad-line Seyfert 1 (BLsy1) galaxies, showing the most extreme behaviour in the X-ray band. Studies of the soft X-ray excess for typical NLsy1 galaxies will be key in determining the nature of the corona, resolving the disc-jet connection, and determining the origin of the radio loud/quiet dichotomy in AGNs (see Gallo 2018 for a detailed review).
The X-ray variability of AGNs usually shows the features of red noise. Although many efforts have been made to understand the X-ray variability of AGNs, the exact physical mechanism of X-ray variability is still not fully understood owing to the existence of complex emission components and the complicated interaction between them. Observational studies have found that the time delay between different energy shows differences under short-term variability (high-frequency variability) and long-term variability (low-frequency variability; see e.g., Papadakis et al. 2001; Mallick et al. 2018). The positive or hard lag refers to the variation of hard photon delay relative to that of soft photons and is usually detected at low-frequency variability. The negative or soft time lag is ordinarily observed at high-frequency variability; soft photon variation is delayed with respect to hard photons. The result strongly suggests that the mechanisms of short-term and long-term X-ray variability are different. Long-term X-ray variability may be related to the accretion fluctuation propagation (Lyubarskii 1997). In this scenario, the fluctuation of the local accretion rates propagates to the inner region, leading to changes in optical/UV radiation. These changes further lead to variations of the X-ray emission of the corona. Another possible mechanism of long-term X-ray variability is the change of light bending intensity caused by variation of the geometric position of the corona. This mechanism is a derivative of the relativistic reflection scenario. The potential physical origin of short-term X-ray variation is not clear, which may be related to some turbulence in the corona (e.g., magnetic turbulence; Noble & Krolik 2009).
PG 1448+273 is an NLsy1 galaxy with a redshift of z = 0.00645 (Alam et al. 2015). Its black hole mass is (9 ± 2) × 106 M⊙, as estimated by Vestergaard & Peterson (2006) using single-epoch optical spectroscopy, and the estimated bolometric luminosity is ∼1045.5 erg s−1 (Grupe et al. 2004). The Eddington ratio of the source is L/LEdd ∼ 3, so it is a super-Eddington accretor. Inoue et al. (2007) studied the X-ray spectra of 43 Palomar-Green quasars and found that the source has an unusual soft X-ray excess, which cannot be described by the usual black-body spectrum with a temperature of ∼0.1 keV. Besides, the X-ray emission of this source shows high variability (Ponti et al. 2012). Very recently, Kosec et al. (2020) detected high confidence, ultra-fast outflows (UFOs) with the velocity of ∼0.09c in an XMM-Newton observation for which the source is in a low-flux state. Subsequently, Laurenti et al. (2021), based on a novel modelling tool called the ionized nuclear environment (WINE), studied the more detailed physical properties of UFOs. Also, through the analysis of 20 Swift UVOT and XRT observations, the latter authors found that the △αox of the source decreases significantly after UFO launching, showing obvious X-ray weakness. The transition of AGNs in low states is interesting as it provides the best clues to study the nature of the accretion disk, the origin of the soft X-ray excess, and mechanisms of variability (see e.g., Gallo et al. 2015; Turner & Miller 2009; Tripathi et al. 2019). Motivated by the extraordinary observational features of PG 1448+273, in this paper we conduct detailed and systematic time-varying analyses and spectral analyses for two long-exposure XMM-Newton observations of this source, revealing the origin of the soft X-ray excess and the cause of the long- and short-term X-ray variability in this source.
The paper is organized as follows. Section 2 describes the observations and data reduction. The detailed variability analyses are shown in Sect. 3. Section 4 presents the systematic spectral analyses. A detailed discussion of the physical origin of soft X-ray excess and the cause of the long- and short-term X-ray variability is presented in Sect. 5 based on the results of the analyses. The conclusions and prospects are shown in Sect. 6. The cosmological parameters of H0 = 70 km s−1 Mpc−1, Ωm = 0.3, and ΩΛ = 0.7 are adopted in this work.
2. Observation and data reduction
In this work, we carried out detailed variability and spectrum analyses of two deep-exposure observations of PG 1448+273 observed by the XMM-Newton. The European Photon Imaging Camera (EPIC) on board the XMM-Newton is composed of three co-aligned X-ray telescopes, which simultaneously observe a source by accumulating photons in the three CCD-based instruments: the twins MOS1 and MOS2 and the PN. In this work we only consider the EPIC-PN data because they are most sensitive. The detailed information of these two observations is listed in Table 1.
Observations of XMM-Newton for PG 1448+273.
We retrieved the raw data from the XMM-Newton Science Archive1. Then, according to the specific purpose (see below for details), we followed The XMM-Newton ABC Guide2 to process the raw data (extracting the light curves and spectra of the source) using the XMM-Newton Science Analysis System (SAS v19.0.0) with the latest available calibration files. Using the epatplot task, we ruled out the possibility of the pile-up effect in the observation ID 0781430101. In the extraction process, we extracted the 0.2 − 10 keV source events from a circular region with a radius of 45″ centred on the object. Since this observation was performed with the prime small window model, it was not easy to extract the background events using a circular region. To eliminate the influence of the object on the background as possible, we finally adopted a rectangular area (Box(3925.75, 1451.22, 20.00)) slightly far away from the object and close to the edge of the CCD to extract background events. The area ratio of the background extracted area to the source extracted area is ∼2.3. For observation ID 0152660101, the central region of the object has an obvious pile-up effect. To avoid the pile-up effect in the central region of the object, we extracted source events from an annulus with inner and outer radii of 20″ and 45″, respectively, and we extracted the background events from a source-free circular region, which has a radius of 70″, slightly away from the object. The area ratio of the background extracted area to the source extracted area is ∼2.9. The extracted X-ray events are grouped into at least 25 counts per energy bin to ensure the validity of the χ2 statistics.
In addition, another instrument on board the XMM-Newton, the Optical Monitor (OM; Mason et al. 2001), can provide photometric data from optical to UV bands (U, B, V, UVW2, UVM2, and UVW1). Following the on-line processing tutorial, we processed the OM data by calling the SAS task omichain, and we used the standard task om2pha to generate the XSPEC readable format spectral file.
3. Variability
Thanks to the strong emission of the source and the long exposure time of the two observations, we can extract high-quality short timescale light curves. In this section, we analyse in detail the short timescale light curves obtained from the observations in an attempt to find meaningful clues that can reveal the physical mechanism of the soft X-ray excess and the physical characteristics of the corona.
3.1. Short timescale light curves
The dead-time-corrected, background-subtracted 0.2–10 keV X-ray light curve (time bin = 100 s) is presented in Fig. 1 (top panel). The average fluxes of the source in 2003 and 2017 were 5.14 ± 0.07 counts s−1 and 2.88 ± 0.03 counts s−1, respectively. The source showed significant variability with a fractional variability3 of (30.5 ± 0.2)% when it was a low state in 2017.
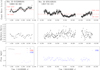 |
Fig. 1. Light curves of PG 1447+273. Top panel: light curve of PG 1447+273 in the X-ray band (0.2–10 keV). Middle panel: X-ray hardness ratio over time. Bottom panel: light curves of PG 1447 + 273 in the optical/ultraviolet band. The time and ID of the observation are denoted in the top panel. The red lines in the top panel represent the average X-ray fluxes during the corresponding observation period. According to the respective average X-ray fluxes, as shown in the figure, the single observation is further divided into high and low states. |
The X-ray hardness ratio4 over time is also shown in Fig. 1 (middle panel; time bin = 500 s). The average hardness ratios of the source in 2003 and 2017 are −0.883 ± 0.002 and −0.869 ± 0.002, respectively. In 2017, although the hardness ratio of the source did not change significantly, there was still a trend that the hardness ratio became softer as the source became brighter. In 2003, the source was in a high state. There was also no obvious change in the hardness ratio, but the difference was that the hardness ratio showed a ‘harder when brighter’ tendency. This tendency could be due to the strong pile-up effect that occurs in this observation. However, after eliminating the pile-up effect, although this tendency is eased, it still exists. This implies that the corona or accretion disk of the source could be in different physical states or that the variability mechanisms are different (also see Sects. 3.2 and 3.4 below).
Figure 1 (bottom panel) shows the optical/UV light curve observed simultaneously by the OM. In 2017, only the fluxes of the UVW2 band were observed, and the fluxes do not show very significant variability with a fractional variability of (8.6 ± 0.5)%. This result indicates that the significant X-ray variability of the source is caused by a mechanism associated with the changes of the corona rather than induced by the changes of UV photons from the accretion disk.
3.2. Excess variance spectra
Excess variance spectra (often referred to as fractional variability (Fvar ) or root mean square (RMS) spectra) are a common tool to quantify spectral variability (e.g., Edelson et al. 2002; Vaughan et al. 2003). This tool can allow us to distinguish the constant and variable components in the energy spectrum to understand the origin of the energy-dependent variability in the accretion system. For each observation, we extracted dead-time-corrected, background-subtracted 0.2–10 keV X-ray light curves under nine different energy segments with a time bin of 100 s. Then, following the prescription of Vaughan et al. (2003), we calculated the fractional variability of each time series and finally obtained the Fvar spectrum.
The Fvar spectra observed in 2003 and 2017 are shown in Fig. 2, respectively. In 2003, the Fvar spectrum of the source shows a parabolic energy dependence, with the strongest variability in the 3–5 keV band. In 2017, the Fvar spectrum of the source presents a monotonous decreasing form, the higher the energy, the stronger the variability. The results further indicate that there are obvious differences in the variation behaviour between the two observations, implying that either the physical state of the corona or accretion disk has changed or the intrinsic variation mechanisms are different.
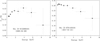 |
Fig. 2. Fractional variability (Fvar) spectra in 2003 (left panel) and 2017 (right panel). |
3.3. Cross-correlation analysis
In the Comptonization model, hard X-ray photons need to undergo more scattering times to obtain energy, travel longer, and escape the corona later than soft photons, so that the hard X-ray emission will be delayed than the soft X-ray emission. In the relativistically blurred reflection model, the origin of soft X-ray excess is attributed to the ionized reflection of hard X-ray photons from the corona in the inner region of the accretion disk. Owing to the additional optical path of these photons, the soft X-ray emission and the Fe Kα fluorescent line need to respond after a few seconds to a few minutes, so that the soft X-ray emission is delayed in the hard X-ray emission. Since the Comptonization and the relativistically blurred reflection models have different predictions for the delay effect between soft and hard X-ray emission, the use of cross-correlation analysis to search the delay is a promising way to distinguish the physical mechanisms of the soft X-ray excess.
We employed the discrete correlation function (DCF; Edelson & Krolik 1988), which is one of the most common methods for studying the cross-correlation between two time series with uneven spacing, to perform the cross-correlation analyses between the soft X-ray band (0.2–2 keV) and the hard X-ray band (2–10 keV) with a time bin of 500 s. We used flux randomization and random subset selection (FR/RSS, Peterson et al. 1998, 2004) to calculate the uncertainty of lag. Specifically, based on the actual observed light curve, we created 2000 randomly sampled light curve subsets and randomly changed the value of each data point in each subset based on the error of the data point (based on Gaussian distribution sampling). Then, DCF analyses were performed on the 2000 light curve subsets. Finally, the centroid lag (τcentroid) was estimated using all correlation values greater than 0.8 times the peak.
Figure 3 shows the τcentroid distributions of 2000 subsets obtained based on the above method for the two observations. The medians of τcentroid and its 1σ uncertainties in 2003 and 2017 are  s and
s and  s, respectively. As a result of the large uncertainty on τcentroid, the lags are consistent with zero within the uncertainties; thereby, a decisive delay time cannot be determined. However, it is still worth noting that for short timescale delay, the implementation of FR overestimates the uncertainty on τcentroid. If only RSS processing is considered, the τCentroid in 2003 and 2017 are
  s and
s and  s, respectively. This result indicates that there could be a soft delay in 2003; the soft X-ray emission lags behind the hard X-ray emission. It can be seen that the ensemble distribution of τcentroid in the left panel of Fig. 3 is biased towards the negative axis. It can be determined that the 3σ upper limit of the soft delay time is ∼728.9 s, which implies that the scale of the corona or the scale of the corona distance from the accretion disk is R ≲ 2.2 × 1013 cm = ∼8.2 Rg (calculate with MBH = 9 × 10⁶ M⊙; Rg is Schwarzschild radius).
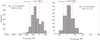 |
Fig. 3. Centroid lag (τcentroid) distributions calculated by DCF for the 2000 subsets obtained by FR/RSS processing in 2003 (left panel) and 2017 (right panel), respectively. The red solid line represents the median of the distribution, and the red dotted lines indicate the 16th and 84th percentiles of the distribution, respectively. |
The DCF analysis between the X-ray and UV bands could also provide meaningful clues (see e.g., Gallo et al. 2018). Therefore, we also performed a DCF analysis between the 0.2–10 keV X-ray data and UVW2 data observed in 2017. The significance levels of correlation for the DCF analysis is estimated by a Monte Carlo (MC) method introduced by Max-Moerbeck et al. (2014). In the MC simulations, we generated 2000 random light curves for each band with a simple power-law power spectral density (PSD) (i.e. P(ν)∝να) following the algorithm described in Timmer & Koenig (1995); the spectral index α for each band was determined by fitting the PSD of the actual observed light curve. The result of the DCF analysis is shown in Fig. 4. The maximum correlation coefficient between the X-ray and UVW2 band is ∼0.3, which only reaches about 1σ correlation confidence level. This result indicates that there is no significant correlation between the X-ray emission and UVW2 emission in 2017.
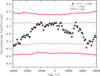 |
Fig. 4. DCF between the X-ray emission and the emission in the UVW2 band. The lines show the significance levels of correlation obtained by the MC simulations. |
3.4. Power spectrum density
The random variability in the X-ray band of AGNs usually has a universal broken power-law PSD. In the high-frequency regime (short time scale), the spectral index of the PSD is ≃2; in the low-frequency regime (long timescale), the spectral index of the PSD is ≃1 (see e.g., Uttley et al. 2002). It is shown that the break frequency νbr of the PSD is dependence on the black hole mass, so analysing the PSD of the X-ray variability is also one of the methods to estimate the black hole mass (Papadakis 2004; Kelly et al. 2013).
Following the standard process of calculating the PSD summarized by Goyal et al. (2018), we calculated the PSD of the two observations; the results are shown in Fig. 5. Using the Python lmfit package5, we performed a linear fit to the ‘binned’ logarithmic periodograms and obtained the spectral indices of the PSD observed in 2003 and 2017 as −2.55 ± 0.31 and −1.89 ± 0.11, respectively. This result is basically consistent with the typical spectral index of α ≃ 2 in the high-frequency regime of the AGN PSD, but it is worth noting that there is an obvious difference between the PSD spectral index when the source is in the high state (in 2003) and low state (in 2017). Moreover, it can be seen that there is no break in the PSDs within ν ≳ 105 Hz, which indicates that the break frequency is νbr < 105 Hz (i.e. the break timescale of the PSD Tbr > 1.16 d). By comparing the statistical relation between the black hole mass and the break timescale of the PSD in the case of high accretion obtained in McHardy et al. (2005), that is the line that corresponds to the trend of the NLsy1 galaxies in Fig. 14 of McHardy et al. (2005), we can infer that the black hole mass of PG 1448+273 is MBH > 107 M⊙. Based on single-epoch optical spectroscopy, Vestergaard & Peterson (2006) estimated that the black hole mass of PG 1448+273 is (9 ± 2) × 106MBH, and this result roughly satisfies the lower bound obtained above.
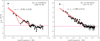 |
Fig. 5. PSDs of light curves in 2003 (right panel) and 2017 (right panel). The red solid lines indicate the fitting results of the power law, and the corresponding spectral indexes α are denoted in the panel. The pink horizontal lines represent the power level of the noise floor. There is an obvious dip (oscillation) feature at the ν ∼ 10−3.6 Hz of the PSD in 2003, and the red dotted line indicates the fitting result after adding a Gaussian component to be responsible for the dip feature. |
We also note that there is a ‘dip’ at ν ∼ 10−3.6 Hz in the PSD in 2003. Adding a Gaussian component to fit the dip with the fixed spectral index, the chi-square value of the fitting is reduced by Δχ2 = −18.66 for  , and the significance of the fitting improvement is ∼3.2σ (the F-test value is 0.0013). Papadakis et al. (2016) propose for the first time a theory that X-ray reprocessing may produce a significant dip (or oscillation) feature in the high-frequency regime of the AGN PSD. In X-ray reprocessing, the signals we observe are the result of the mutual interference of the X-ray primary continuum and the reprocessing radiation, where the latter component is the convolution of the primary emission with the response function of the disk for a given geometry. This process generates a significant dip (or oscillation) feature from ν ∼ 10−4 − 10−3 Hz on the PSD (see Fig. 2 in Papadakis et al. 2016), and the frequency of the dip mainly depends on the height of the corona and the black hole mass of the source.
Emmanoulopoulos et al. (2016) first systematically searched for such a dip (or oscillation) feature in PSD on a sample of NLsy1s galaxy with long XMM-Newton observations, but no any evidence was detected. Until recently, Alston et al. (2019) report that a narrow dip (or oscillation) at ν ∼ 7 × 10⁻⁴ Hz was detected in the PSD of soft X-ray band in IRAS 13224-3809. Our results show that the PSD of PG 1448+273 has a similar dip (or oscillation) feature at ν ∼ 2.5 × 10⁻⁴ Hz in the 2003 observation, which is the second case discovered in observations so far.
4. Spectral analysis
In this section, we use XSPEC (v.12.10.1f; Arnaud 1996) to analyse the X-ray spectra of the two observations in detail. To deeply penetrate into the variability of spectra, we further divide the respective events in the two observation periods into high and low states to extract and generate the spectra according to their respective average fluxes (see Figs. 1 and 6). Specifically, we use the good time interval (GTI) file generated by the tabgtigen task to extract events above and below average flux and then merge high-state events and low-state events into a spectrum, respectively; in Appendix A, we also briefly report the analysis results of the average spectra without distinguishing high and low states for comparison and reference. In the fitting process, we use chi-square statistics to assess the goodness of fit, and the Galactic absorption column density of the source is fixed as NH = 3.0 × 1020 cm−2 (HI4PI Collaboration 2016).
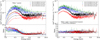 |
Fig. 6. Fitting results of the phenomenological models for the spectra of PG 1448+273. Left panel: the fitting results and data/model ratio plots of a Galactic absorption modified power-law model. The spectral index of the model is tied between all the spectra to examine the spectral variability, and the fitted models are extrapolated to the 0.2–2 keV and 6–10 keV to examine the spectral features. Right panel: the fitting results and data/model ratio plots of the TBabs * gabs* ((cflux*zpower) plus const*(cflux*zbbody)) model. The observation ID and status corresponding to different colour data are denoted in the top panel, and the model used for fitting is also indicated in each panel. |
4.1. Phenomenological model
To preliminarily examine the variability and features of the spectra, we start by fitting the 2–6 keV spectra with a Galactic absorption modified single power law with a tied spectral index for all spectra and then extrapolate it to the 0.2–2 keV and 6–10 keV bands. The fitting results are shown in Fig. 6 (left panel). Significant differences between the spectra of 2003 and 2017 can be found, and there are also clear differences between the spectra of the high and low states in 2017. Below 1 keV, there is a visible soft X-ray excess in each spectrum. Also, in the 2017 spectra, there are significant absorption characteristics at ∼0.25 keV and ∼7 keV, along with excess emission above ∼6 keV. Here the absorption feature of ∼0.25 keV probably is the K-absorption edge of carbon, while the absorption feature at ∼7 keV is the absorption line of Fe XXV/XXVI Kα from UFOs, which was recently reported in Kosec et al. (2020). Kosec et al. (2020) perform a detailed analysis for the RGS spectrum of the source observed in 2017, which shows that the RGS spectrum has complex absorption structures. There is a prominent high-speed blueshifted (∼0.1c) absorption feature of O VIII at 18–19 Å (observed wavelength) in the RGS spectrum, and there are some other weaker absorption structures at 12 Å and 24 Å (see Fig. 7 of Kosec et al. 2020 for details). Laurenti et al. (2021) used the WINE model to study the Fe absorption feature further, deriving the physical properties of the launching of UFOs. Since our work mainly focusses on the physical origin of the soft X-ray excess, we only adopt a phenomenological model of the Gaussian absorption line (gabs in XSPEC) in the subsequent models to be responsible for the absorption characteristic of Fe XXV/XXVI Kα. The strength of the Gaussian absorption reflects the opacity of the winds. It is worth noting that the intensity of the soft X-ray excess and UFO absorption is related to the flux state of the source. In the low state, the source has a more significant soft X-ray excess and UFO absorption.
For further quantification, we use a phenomenological model TBabs * gabs* ((cflux*zpower) + const* (cflux*zbbody))) to fit the 0.3–10 keV spectra, where zbbody approximately represents soft X-ray excess component. Unless otherwise stated, all model fittings below are performed on the 0.3–10 keV band. In the above model, the normalization factors of the zbbody and zpower components are fixed to 1, and the flux of the zpower component is determined by the cflux. The flux integral range is 0.3–10 keV. The parameters of the cflux of the zbbody component are set to be the same as those of the cflux of the zpower component; the const parameter determines the flux of the zbbody component, and this parameter therefore reflects the relative intensity of the soft X-ray excess to the power-law component. The fitting results of the model are listed in Table 2, and the fitting results are presented in Fig. 6(right panel).
Fitting results of the phenomenological model for the spectra of PG 1448+273.
The results show that the temperature parameter kT of zbbody is ∼0.1 keV in all four spectra, without any significant variation. From the perspective of a long timescale, the relative intensity of the soft X-ray excess has changed significantly between 2003 and 2017, and the relative intensity of the soft X-ray excess is stronger in 2017. In contrast, from the short timescale perspective, there is no noticeable change in the relative intensity of soft X-ray excess between the high and low states, whether in 2003 and 2017, but only the flux of the power-law component changed. This result strongly implies that the physical state of the corona or disk of the source has changed between 2003 and 2017 (under the long timescale), while in the short timescale (between the high and low states during a single observation), the spectral variation may be mainly caused by the random fluctuations of the intrinsic emission from the corona. Besides, there are perceptible changes in the overall velocity (i.e. line centre), velocity dispersion (i.e. line width), and absorption intensity (i.e. line depth) of the outflows between the high and low states in 2017. In the low state, the blue shift of the line centre is smaller, but the absorption intensity is greater.
4.2. Physical model
Although the above phenomenological model can fit the observed spectra well, it cannot give an intrinsic physical process. This section investigates two possible physical scenarios for soft X-ray excess: the relativistically smeared reflection scenario and the warm corona scenario.
4.2.1. Relativistically smeared reflection scenario
In this scenario, the soft X-ray excess emission is described by the relativistically smeared reflection from a photo-ionized accretion disk. García et al. (2014) developed a the most updated blurred ionized-reflection model, relxill. This model merges the angle-dependent reflection model xillver with a relativistic blurring model relline. We tried to use the TBabs*gabs*relxill model to fit the observed spectra, where the TBabs is responsible for the Galactic absorption, and the gabs represents the absorption line of Fe XXV/XXVI Kα from the UFOs. In the relxill model, the parameters RIn and Rout represent the inner and outer radii of the accretion disk, respectively. In the fittings, Rout parameter is fixed at 400 gravitational radii, and RIn is set to the innermost circular orbit (ISCO). The emissivity profile of the corona is assumed to be in broken power-law form, determined by the parameters Γ1, Γ2, and Rbr. The quantity Rbr is the break radius, which is less constrained by the fittings and is fixed at six gravitational radii; Γ2 is the emissivity index with a radius between Rbr and Rout. Considering that this area is a Newtonian region far from the inner extremely relativistic area, the Γ2 parameter is fixed to a typical value of 3. The parameter Γ1 is the emissivity index of the inner zone with a radius from Rbr to Rout, which is set as a free parameter. The high-energy cut-off of the coronal incident spectrum (Ecut) is frozen as 300 keV, and the redshift of the source is set to 0.0645. The other parameters are set to vary freely during the fittings. It should be noted that the black hole spin (a), iron abundance (AFe), and disc inclination (θ) are bound together in fitting different spectra.
Figure 7(top panel) shows the data versus model ratio graph returned by the fittings. Generally, this model can basically fit the observed data well. The total goodness of fit is  . The fitting results show that the source has an extreme spin (a = 0.998 ± 0.01) and a very steep emissivity index in the inner region of the disk. This feature has been found in many examples (e.g., Fabian et al. 2004; Crummy et al. 2006). Under such extreme parameters, the Fe Kα line is significantly broadened, making it confused with the continuous spectrum and difficult to distinguish. The iron abundance is AFe = 3.55 ± 0.25, and the disk inclination angle is θ = 64.0 ± 2.6 deg. The fitting results of other parameters are listed in Table 3. Comparing the fitting results in 2003 and 2017, the reflection fraction (Rfrac) has the most significant difference. In 2017, the source had a large reflection fraction, which implies that the corona of the source is closer to the inner region of the accretion disk. At this time, the intrinsic emission from the corona is subject to a powerful gravitational effect, making it difficult for most of the X-ray photons to escape; these photons instead fall into the inner region of the accretion disk. Compton scattering and photo-ionization then occurs on the surface of the accretion disk, resulting in a strong relativistically smeared reflection and eventually leading to an obvious soft X-ray excess in the observed spectra. Also, some photons in the primary emission fall into the black hole horizon, which leads to a decrease in the observed fluxes. In this scenario, the long timescale variability of the source is plausibly attributed to the change of the distance between the corona and the accretion disk. On the other hand, the comparison of fitting results between different states in the same observation shows that on the short timescale, the variation between the high and low states is mainly due to the change of the intrinsic emission of the corona (i.e. the normalization parameter in the model).
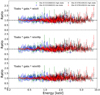 |
Fig. 7. Data vs. model ratio plots obtained by the X-ray spectral fittings of PG 1448+273 with three different relativistically smeared reflection models. The observation ID and status corresponding to different colour data are indicated in the top panel, and the model used for fitting is also denoted in each panel. |
Fitting results of the relativistically smeared reflection models for the spectra of PG 1448+273.
In the relativistically smeared reflection model, the simplest geometric configuration of the corona and accretion disk is a structure called a lamp post. The model under this configuration is provided in the relxill model library, namely relxillp. We also attempt to use the TBabs*gabs*relxilllp model to fit the observed spectra. The data versus model ratio plot is shown in Fig. 7 (middle panel). The fitting results show that the heights of the corona in 2003 and 2017 are h = ∼13 Rg and h = ∼3 Rg, respectively, which roughly satisfies the upper limit scale expected by DCF analyses. However, this model returns a very poor fitting; the total goodness of fit is  , which indicates that the corona and accretion disk could have a more complex geometric structure in PG 1448+273.
The NLsy1 galaxy usually has high accretion rates. In this case, the accretion disk has a high matter density. Therefore, we further try to replace the relxill model with the relxillD model to fit the observed spectra. The relxillD model is the same as the relxill model, but can allow the density of the accretion disk to change freely at a higher value (between 1015 to 1019 cm−3). In the new fittings, the density of the accretion disk is set as a free parameter but is bound between the different spectra, while the remaining parameters are the same as the settings in the relxill model. The density of the accretion disk returned by the fittings is log(ρ) = 17.8 ± 0.10 cm−3. Except for the apparent difference in the reflection fractions, other parameters are not affected by the new model and are basically consistent with the previous model within the error range. The detailed fitting parameters are listed in Table 3, and the data versus model ratio diagram is shown in Fig. 7 (bottom panel). The relxillD model returns the best-fit results among all reflection models, and the total goodness of fit is  .
.
4.2.2. Warm corona scenario
Another possible origin of soft X-ray excess is the warm corona scenario. In this scenario, the gravitational energy released in the disk at each radius is emitted as a (colour temperature corrected) black body only down to a given radius, the coronal radius Rcor. Below this radius, it is assumed that the energy can no longer completely thermalize. The energy is distributed between an optically thick warm Comptonization medium (kT ∼ 0.1 − 1 keV) and an optically thin thermal Comptonization medium, giving rise to soft and hard Comptonization components. Done et al. (2012) developed a self-consistent energy model (OPTXAGNF) to describe the physical process. We adopt the TBabs*gabs*redden*optxagnf model to fit the observed spectra to explore the rationality of this physical scenario, where the TBabs is responsible for the Galactic absorption, and the gabs represents the absorption line of Fe XXV/XXVI Kα from the UFOs. The redden is responsible for the Galactic reddening in the optical/UV band (EB − V = 0.025). In this model, the normalization parameter of optxagnf is frozen to 1, and the model flux is determined by the black hole mass MBH, black hole spin a, and Eddington ratio LEdd. The black hole mass is fixed as 9 × 10⁶ M⊙ estimated by Vestergaard & Peterson (2006) based on the single-epoch optical spectroscopy; the Eddington ratio is set as a free parameter, but it ties together the different spectra. The outer radius of the accretion disk is frozen to 105 Rg. The difference in the fitting results between different spectra is extremely small for the coronal temperature (kT) and the optical depth (τ). Therefore, for these two parameters, the values of different spectra are tied together. The fittings are performed in the case of the black hole spin taking no spin (a = 0), medium spin (a = 0.5) and high spin (a = 0.99), respectively. The results show that the total goodness of fit of the three cases is highly similar (the maximum chi-square difference is only Δχ2 = 27). Except that the Eddington ratio and the coronal radius have significant differences, other parameters are only slightly changed. The Eddington ratio and the coronal radius decrease with the increase in the black hole spin.
In the optxagnf model, the model can be extrapolated to the optical/UV band based on the fitting results of X-ray data. Hence, we compare the extrapolation results of the best-fit models (taking a = 0) with the optical/UV observation data obtained from the 2003 XMM-Newton OM observation. The result shows that the observed fluxes are significantly higher than the extrapolated value (see Fig. 8 left panel; the model with a = 0 has the highest flux in the optical/UV band among all spin values). We note that when the black hole mass is fixed at 9 × 10⁶ M⊙, the optxagnf model cannot fit the optical/UV and X-ray data well at the same time. The result indicates that either the model is not applicable, or the black hole mass is underestimated. Considering that there is no significant change in the fluxes in the UVW2 band in 2003 and 2017, combined with the optical/UV data obtained by the OM observation in 2003 and the respective X-ray data obtained from each observation, we re-fit the spectra with the black hole mass set to free; the black hole mass is tied together in different spectra. The fitting results show that only when the black hole mass is taken as (9.01 ± 1.6) × 108 M⊙ (taking a = 0) can the model perfectly fit the entire observed spectrum; the total goodness of fit is  (see Fig. 8 right panel). The fitting parameters are summarized in Table 4.
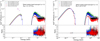 |
Fig. 8. X-ray spectra of PG 1448+273 with the optical/UV data from the OM. Left panel: the lines of different colour represent the best-fitting warm corona models obtained by fitting the corresponding colour X-ray data under the condition of a = 0 and MBH = 9 × 10⁶ M⊙. These best-fitting models are extrapolated to the optical/UV band to compare the observed optical/UV data, and the observed optical/UV fluxes significantly exceed the extrapolated value of the models. Right panel: the lines of different colours represent the best-fitting warm coronal model obtained by simultaneously fitting the corresponding colour X-ray and optical/UV data under the condition of a = 0 and a free black hole mass. |
Fitting results of the warm corona model with free black hole mass for the spectra of PG 1448+273.
5. Discussion
In the previous sections, we investigated the temporal characteristics of PG 1448+273 in detail and fit the X-ray spectra of the source based on two potential physical scenarios responsible for the soft X-ray excess. In this section, we put together all the information and discuss the physical origin of the soft X-ray excess and the physical mechanism of long-term and short-term X-ray variability in PG 1448+273.
5.1. Origin of the soft X-ray excess in PG 1448+273
From the spectral fitting perspective, it can be found that for the warm corona scenario, the model cannot simultaneously reconcile the observation data in the optical/UV band and the X-ray band when considering the black hole mass estimated based on the single-epoch optical spectroscopy in previous studies. A similar result has also been reported in II ZW 177 (Pal et al. 2016). Such results indicate that either the warm corona scenario is invalid in PG 1448+273 or the black hole mass is seriously underestimated. Some studies have suggested that for NLsy1 galaxies, the black hole mass estimated from the single-epoch optical spectroscopy or reverberation mapping could be seriously underestimated owing to projection effects (Decarli et al. 2008) and radiation pressure effects (Marconi et al. 2008). Viswanath et al. (2019) estimate the black hole masses of all sources in a large sample containing radio-quiet NLsy1 (RQ-NLsy1) and radio-quiet, broad-line Seyfert 1 galaxies (RQ-BLsy1) by fitting their optical spectra based on the standard accretion disk model. These authors find no significant difference between the black hole masses of the RQ-NLsy1 and RQ-BLsy1, and the average black hole mass is about 108 M⊙ (see also Calderone et al. 2013). However, these research results still have severe conflicts and controversies with other research results. For example, Popovic et al. (2018) estimate the black hole masses of an NLsy1 sample and a BLsy1 sample via a polarization angle measurement method and find that NLsy1 galaxies have smaller black hole masses; Williams et al. (2018) compare the black hole masses of an NLsy1 sample and a BLsy1 sample using X-ray variability scaling technology and reach the same conclusion. A more detailed discussion of the controversy about the black hole mass is referred to in Sect. 8 of Paliya et al. (2019). Therefore, whether the black hole mass of PG 1448+273 is seriously underestimated, cross-validation is necessary using other methods. The PSD analysis of PG 1448+273 shows no break within vbr < 10−5 Hz. From the statistical relation between the black hole mass and the break timescale, we can roughly infer that a lower limit of the black hole mass of this source is MBH ≳ 107 M⊙. The black hole mass estimated by the single-epoch optical spectroscopy is just at the boundary value of this condition. Williams et al. (2018) estimate the black hole mass of PG 1448+273 utilising the X-ray variability scaling method. The result is 5.98 × 10⁷ M⊙, which is only slightly larger than the black hole mass estimated by the single-epoch optical spectroscopy. Thereby, the black hole mass of PG 1448+273 may not be significantly underestimated as required by the warm corona model, implying that the warm corona model could not hold in PG 1448+273.
In the case of the relativistically smeared reflection scenario, our results reveal that a reflection model with a high-density accretion disk (log ρ = 17.8 ± 0.10 cm−3) is able to fit all observed X-ray spectra best. This density value is similar to the average value obtained by Jiang et al. (2019) based on the high-density disk reflection model for an NLsy1 sample. Jiang et al. (2019) find that compared with the standard density (ne = 1015 cm−3) disk reflection model, the high-density disk reflection model significantly reduces the derived iron abundance as a consequence of the increase in the continuum in the reflection component. In our case, the iron abundance derived from the high-density disk reflection model only experiences a slight decrease compared to that derived under the standard density situation, which is largely because the iron abundance of this source under the standard density situation is not high at close to the solar abundance level (ZFe < 3 Z⊙). In the relativistically smeared reflection scenario, a set of extreme physical parameters (i.e. high-speed spin and very steep emissivity index profile) are required, just like the previous results of other NLsy1 galaxies. Very recently, using the broader X-ray spectra provided by the joint observations of XMM-Newton and NuSTAR, some researchers found that such extreme physical parameters were hard to reconcile the soft X-ray excess component and a moderately broad Fe Kα line as well as a moderate reflection hump above 10 keV (e.g., see reports on Ton S180 by Matzeu et al. 2020 and Mrk 359 by Middei et al. 2020). Nevertheless, compared with Ton S180 and Mrk 359, the X-ray spectra of PG 1448+273 do not show a distinctly distinguishable Fe Kα line, and its RGS spectra do not show completely featureless features, thus avoiding the dilemma in similar Ton S180.
Historically, it is tricky to distinguish the relativistically smeared reflection scenario and the warm corona scenario in terms of goodness of fit. Time-varying analyses are very promising to distinguish the two. The detailed time-varying analyses further support the relativistically smeared reflection scenario accounting for the soft X-ray excess in PG 1448+273. Firstly, the PSD of the source appears an apparent dip (or oscillation) feature of ∼3.2σ confidence level at ∼103.6 Hz in the observation of 2003. Such a feature is a unique timing signature of the X-ray reprocessing by the disk, which is strong evidence of the existence of reflection. In addition, as a result of the different light propagation paths between the photons directly reaching the distant observer and the photons reflected from the disk surface, it is expected that the variation of the reprocessing X-ray emission will lag that of the primary emission. The DCF analysis of PG 1448+237 at high state in 2003 shows a tentative soft delay of ∼241 s. Furthermore, the warm corona model usually predicts a significant correlation between UV and X-ray bands, but this feature is not found in PG 1448+237. Therefore, from the comprehensive results of spectral fittings and time-varying analyses, all observational evidence favours that the relativistically smeared reflection of a high-density accretion disk causes the origin of soft X-ray excess in PG 1448+237.
5.2. Implication of relativistically smeared reflection model for long/short timescale variation
From the long timescale perspective, PG 1448+273 exhibit very different variability features in 2003 and 2017 (see Sect. 3). Under the relativistically smeared reflection scenario, this difference can be self-consistently attributed to the change of geometry (distance) between the corona and accretion disk of the source. A simple schematic is shown in Fig. 9. We note that the realistic geometric configuration of corona and accretion disk is by no means a simplest lamp-post form (see Sect. 4.1). In 2003, the corona of the source was far away from the accretion disk, and only a small part of the primary emission of the corona irradiates the inner region of the accretion disk to produce reflection, resulting in weaker soft X-ray excess. In 2017, the corona of the source was close to the black hole, most of the primary photons emitted from corona fell into the inner region of the disk as a result of the strong gravitational effect. This reduces the observed flux of the source, while the emission is dominated by the reflection component, showing significant soft X-ray excess. Furthermore, the disappearance of the PSD oscillation feature and the absence of soft delay in the DCF analysis in 2017 can be reasonably explained in this context. In 2017, the relative distance between the corona and the disk of the source was close, which makes a short optical path difference between the primary emission and the reflected radiation, which leads to the DCF analysis being unable to resolve any delay feature at the current time resolution. At the same time, when the relative distance between the corona and the disk of the source is close, the theory predicts that the frequency at which the oscillation feature begins to appear in PSD moves to the high-frequency regime, so the feature in 2017 may have moved to the noise region.
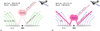 |
Fig. 9. Simple schematic diagram explaining the X-ray spectral variability of PG 1448+273 in the framework of the relativistically smeared reflection scenario. A detailed description is presented in Sect. 5.2. |
Short-term flux fluctuations of the source in 2003 and 2017 are mainly attributed to the intrinsic variation of the corona. It is worth noting that the intensity of short-term variability in 2017 is more significant than that in 2003, especially in the soft X-ray band (see Fig. 2). This is probably related to the change of ionization intensity of UFOs. Related studies have shown that when a source is in a high state, the high-speed outflow wind out of the disk is over ionized, causing the absorption of the outflow to weaken. This shows an inverse correlation between the luminosity of the variable outflow and the absorption intensity; the UFOs therefore are hard to detect (see e.g., Pinto et al. 2018). Such dynamic changes are highly in line with what we saw in PG 1448+273. In 2017, the corona of PG 1448 + 273 was close to the black hole; the irradiation of the corona to the UFOs was weakened owing to the strong light-bending effect. The ionization degree of the UFOs was decreased, leading to a marked Fe absorption features emerged in the X-ray spectra. Moreover, as the absorption of UFOs further brings variable factors, the intensity of the short-time variability increases during this period, especially in the soft X-ray band. In 2003, the corona was far away from the inner region of the black hole, and the variability exhibited opposite characteristics; that is, the Fe absorption line disappeared in the X-ray spectra and the intensity of short-term variation weakened (especially in the soft X-ray band).
Some studies have shown that extreme outflows are highly variable, but the exact nature of their variation and the launch mechanism are still not well understood. Based on the detailed analysis for the single observation of PG 1448+273 in 2017 (i.e. further divided into high and low states in this observation), we find that the line centre and intensity of the Fe absorption line have obvious changes under the fitting results of the most suitable high-density disk reflection model. The results indicate that the timescale of the variability in UFOs is exceedingly short. In addition, the fitting results show that when the source is in the high state, the absorption intensity of UFOs decreases and the speed of UFOs becomes faster, which is consistent with the results of the previous statistical studies (Matzeu et al. 2016; Pinto et al. 2018).
6. Conclusions and prospects
In this paper, a systematic time-varying and spectra analysis of the two long exposure XMM-Newton observations are carried out. It is revealed that the relativistically smeared reflection model of a high-density disk is the most plausible origin mechanism of soft X-ray excess in PG 1448+273, and the long/short time-scale variability of PG 1448+273 is interpreted in a self-consistent manner in the framework of this model. We only consider the most extreme and simplest case; that is the origin of soft X-ray excess is either the pure warm corona scenario or the pure reflection scenario in this work. Some previous studies on other NLsy1 galaxies have found that the origin of soft X-ray excess may be formed by a hybrid mechanisms. Nevertheless, in PG 1448 + 273, we emphasize that the simplest relativistically smeared reflection model of a high-density disk can self-consistently explain all the spectral and time-varying features, which implies that the source can be used as a typical case for further in-depth investigations of relativistic reflection mechanism.
At present, through the in-depth analyses of soft X-ray excess of some typical individual sources, the veil of the origin of soft X-ray excess has been gradually unveiled. More and more evidence indicates that the origin of soft X-ray excess may be diverse. Some sources tend to be the simple warm corona scenario; some sources support the relativistically smeared reflection scenario, and some sources show hybrid features. This suggests that there may be a hidden variable, which determines the dominant mechanism of soft X-ray excess. Based on more joint observations by the XMM-Newton and NuSTAR, as well as the excellent performance of the next-generation X-ray telescopes (e.g., eROSITA and Athena), we are hopeful that systematic large-sample studies will eventually reveal the hidden variable.
The fractional variability is usually used to reflect the variability amplitude. Its and its 1σ uncertainty are calculated using Eqs. (10) and (B.2) in Vaughan et al. (2003).
In this work the X-ray hardness ratio is defined as HR = (H − S)/(H + S), where S and H are the net counts in the soft band (0.2–2 keV) and hard band (2–10 keV), respectively.
Acknowledgments
We sincerely thank the anonymous referee for helpful suggestions. This work is supported by the scientific research fund of talent introduction of Kunming University. We are grateful for the support of scientific research fund of Yunnan Provincial Education Department (2021J0715). We acknowledge financial support from the National Key R&D Program of China grant 2017YFA0402703 (Q. S. Gu) and National Natural Science Foundation of China grant 11733002 (Q. S. Gu). Y. Y. Chen acknowledges financial support from the research project of Qujing Normal University (2105098001/094) and the Youth Project of Yunnan Provincial Science and Technology Department (2103010006). J. L. Liu acknowledges financial support from the National Natural Science Foundation of China grant 11903015. This work has made use of the XMM-Newton data.
References
- Alam, S., Albareti, F. D., Allende Prieto, C., et al. 2015, ApJS, 219, 12 [NASA ADS] [CrossRef] [Google Scholar]
- Alston, W. N., Done, C., & Vaughan, S. 2014, MNRAS, 439, 1548 [CrossRef] [Google Scholar]
- Alston, W. N., Fabian, A. C., Buisson, D. J. K., et al. 2019, MNRAS, 482, 2088 [NASA ADS] [CrossRef] [Google Scholar]
- Antonucci, R. 1993, ARA&A, 31, 473 [Google Scholar]
- Arnaud, K. A., Branduardi-Raymont, G., Culhane, J. L., et al. 1985, MNRAS, 217, 105 [NASA ADS] [CrossRef] [Google Scholar]
- Arnaud, K. A. 1996, in Astronomical Data Analysis Software and Systems V, eds. G. H. Jacoby, & J. Barnes, ASP Conf. Ser., 101, 17 [Google Scholar]
- Boissay, R., Paltani, S., Ponti, G., et al. 2014, A&A, 567, A44 [NASA ADS] [CrossRef] [EDP Sciences] [Google Scholar]
- Cackett, E. M., Fabian, A. C., Zogbhi, A., et al. 2013, ApJ, 764, L9 [NASA ADS] [CrossRef] [Google Scholar]
- Calderone, G., Ghisellini, G., Colpi, M., & Dotti, M. 2013, MNRAS, 431, 210 [NASA ADS] [CrossRef] [Google Scholar]
- Chiang, C.-Y., Cackett, E. M., Zoghbi, A., et al. 2017, MNRAS, 472, 1473 [CrossRef] [Google Scholar]
- Crummy, J., Fabian, A. C., Gallo, L., & Ross, R. R. 2006, MNRAS, 365, 1067 [NASA ADS] [CrossRef] [Google Scholar]
- De Marco, B., Ponti, G., Uttley, P., et al. 2011, MNRAS, 417, L98 [NASA ADS] [CrossRef] [Google Scholar]
- De Marco, B., Ponti, G., Cappi, M., et al. 2013, MNRAS, 431, 2441 [NASA ADS] [CrossRef] [Google Scholar]
- Decarli, R., Dotti, M., Fontana, M., & Haardt, F. 2008, MNRAS, 386, L15 [NASA ADS] [Google Scholar]
- Done, C., Davis, S. W., Jin, C., Blaes, O., & Ward, M. 2012, MNRAS, 420, 1848 [NASA ADS] [CrossRef] [Google Scholar]
- Edelson, R. A., & Krolik, J. H. 1988, ApJ, 333, 646 [NASA ADS] [CrossRef] [Google Scholar]
- Edelson, R., Turner, T. J., Pounds, K., et al. 2002, ApJ, 568, 610 [NASA ADS] [CrossRef] [Google Scholar]
- Emmanoulopoulos, D., Papadakis, I. E., Epitropakis, A., et al. 2016, MNRAS, 461, 1642 [NASA ADS] [CrossRef] [Google Scholar]
- Fabian, A. C., Vaughan, S., Nandra, K., et al. 2002, MNRAS, 335, L1 [NASA ADS] [CrossRef] [Google Scholar]
- Fabian, A. C., Miniutti, G., Gallo, L., et al. 2004, MNRAS, 353, 1071 [NASA ADS] [CrossRef] [Google Scholar]
- Gallo, L. 2018, in Revisiting Narrow-Line Seyfert 1 Galaxies and their Place in the Universe, 34 [CrossRef] [Google Scholar]
- Gallo, L. C., Wilkins, D. R., Bonson, K., et al. 2015, MNRAS, 446, 633 [NASA ADS] [CrossRef] [Google Scholar]
- Gallo, L. C., Blue, D. M., Grupe, D., Komossa, S., & Wilkins, D. R. 2018, MNRAS, 478, 2557 [CrossRef] [Google Scholar]
- García, J., Dauser, T., Lohfink, A., et al. 2014, ApJ, 782, 76 [NASA ADS] [CrossRef] [Google Scholar]
- Gierliński, M., & Done, C. 2004, MNRAS, 349, L7 [NASA ADS] [CrossRef] [Google Scholar]
- Goyal, A., Stawarz, Ł., Zola, S., et al. 2018, ApJ, 863, 175 [CrossRef] [Google Scholar]
- Grupe, D., Wills, B. J., Leighly, K. M., & Meusinger, H. 2004, AJ, 127, 156 [NASA ADS] [CrossRef] [Google Scholar]
- HI4PI Collaboration (Ben Bekhti, N., et al.) 2016, A&A, 594, A116 [NASA ADS] [CrossRef] [EDP Sciences] [Google Scholar]
- Inoue, H., Terashima, Y., & Ho, L. C. 2007, ApJ, 662, 860 [NASA ADS] [CrossRef] [Google Scholar]
- Jiang, J., Fabian, A. C., Dauser, T., et al. 2019, MNRAS, 489, 3436 [CrossRef] [Google Scholar]
- Jin, C., Done, C., & Ward, M. 2017, MNRAS, 468, 3663 [NASA ADS] [CrossRef] [Google Scholar]
- Kelly, B. C., Treu, T., Malkan, M., Pancoast, A., & Woo, J.-H. 2013, ApJ, 779, 187 [NASA ADS] [CrossRef] [Google Scholar]
- Kosec, P., Zoghbi, A., Walton, D. J., et al. 2020, MNRAS, 495, 4769 [CrossRef] [Google Scholar]
- Laurenti, M., Luminari, A., Tombesi, F., et al. 2021, A&A, 645, A118 [CrossRef] [EDP Sciences] [Google Scholar]
- Lyubarskii, Y. E. 1997, MNRAS, 292, 679 [NASA ADS] [CrossRef] [Google Scholar]
- Mallick, L., Alston, W. N., Parker, M. L., et al. 2018, MNRAS, 479, 615 [NASA ADS] [Google Scholar]
- Mason, K. O., Breeveld, A., Much, R., et al. 2001, A&A, 365, L36 [NASA ADS] [CrossRef] [EDP Sciences] [Google Scholar]
- Marconi, A., Axon, D. J., Maiolino, R., et al. 2008, ApJ, 678, 693 [NASA ADS] [CrossRef] [Google Scholar]
- Matzeu, G. A., Reeves, J. N., Nardini, E., et al. 2016, MNRAS, 458, 1311 [NASA ADS] [CrossRef] [Google Scholar]
- Matzeu, G. A., Nardini, E., Parker, M. L., et al. 2020, MNRAS, 497, 2352 [CrossRef] [Google Scholar]
- Max-Moerbeck, W., Richards, J. L., Hovatta, T., et al. 2014, MNRAS, 445, 437 [NASA ADS] [CrossRef] [Google Scholar]
- McHardy, I. M., Gunn, K. F., Uttley, P., & Goad, M. R. 2005, MNRAS, 359, 1469 [NASA ADS] [CrossRef] [Google Scholar]
- Mehdipour, M., Branduardi-Raymont, G., Kaastra, J. S., et al. 2011, A&A, 534, A39 [NASA ADS] [CrossRef] [EDP Sciences] [Google Scholar]
- Middei, R., Petrucci, P. O., Bianchi, S., et al. 2020, A&A, 640, A99 [CrossRef] [EDP Sciences] [Google Scholar]
- Netzer, H. 2013, The Physics and Evolution of Active Galactic Nuclei (Cambridge University Press) [CrossRef] [Google Scholar]
- Netzer, H. 2015, ARA&A, 53, 365 [Google Scholar]
- Noble, S. C., & Krolik, J. H. 2009, ApJ, 703, 964 [CrossRef] [Google Scholar]
- Noda, H., Makishima, K., Yamada, S., et al. 2011, PASJ, 63, S925 [NASA ADS] [CrossRef] [Google Scholar]
- Pal, M., Dewangan, G. C., Misra, R., & Pawar, P. K. 2016, MNRAS, 457, 875 [CrossRef] [Google Scholar]
- Paliya, V. S., Parker, M. L., Jiang, J., et al. 2019, ApJ, 872, 169 [NASA ADS] [CrossRef] [Google Scholar]
- Papadakis, I. E. 2004, MNRAS, 348, 207 [NASA ADS] [CrossRef] [Google Scholar]
- Papadakis, I. E., Nandra, K., & Kazanas, D. 2001, ApJ, 554, L133 [NASA ADS] [CrossRef] [Google Scholar]
- Papadakis, I., Pecháček, T., Dovčiak, M., et al. 2016, A&A, 588, A13 [NASA ADS] [CrossRef] [EDP Sciences] [Google Scholar]
- Parker, M. L., Miller, J. M., & Fabian, A. C. 2018, MNRAS, 474, 1538 [NASA ADS] [CrossRef] [Google Scholar]
- Peterson, B. M., Wanders, I., Bertram, R., et al. 1998, ApJ, 501, 82 [NASA ADS] [CrossRef] [Google Scholar]
- Peterson, B. M., Ferrarese, L., Gilbert, K. M., et al. 2004, ApJ, 613, 682 [Google Scholar]
- Pinto, C., Alston, W., Parker, M. L., et al. 2018, MNRAS, 476, 1021 [NASA ADS] [CrossRef] [Google Scholar]
- Ponti, G., Papadakis, I., Bianchi, S., et al. 2012, A&A, 542, A83 [NASA ADS] [CrossRef] [EDP Sciences] [Google Scholar]
- Popovic, L., Afanasiev, V., & Shapovalova, A. 2018, PoS, 328, 001 [Google Scholar]
- Schurch, N. J., & Done, C. 2007, MNRAS, 381, 1413 [CrossRef] [Google Scholar]
- Schurch, N. J., Done, C., & Proga, D. 2009, ApJ, 694, 1 [NASA ADS] [CrossRef] [Google Scholar]
- Singh, K. P., Garmire, G. P., & Nousek, J. 1985, ApJ, 297, 633 [NASA ADS] [CrossRef] [Google Scholar]
- Timmer, J., & Koenig, M. 1995, A&A, 300, 707 [NASA ADS] [Google Scholar]
- Tripathi, S., Waddell, S. G. H., Gallo, L. C., Welsh, W. F., & Chiang, C. Y. 2019, MNRAS, 488, 4831 [CrossRef] [Google Scholar]
- Turner, T. J., & Miller, L. 2009, A&ARv, 17, 47 [Google Scholar]
- Uttley, P., McHardy, I. M., & Papadakis, I. E. 2002, MNRAS, 332, 231 [NASA ADS] [CrossRef] [Google Scholar]
- Vaughan, S., Edelson, R., Warwick, R. S., & Uttley, P. 2003, MNRAS, 345, 1271 [NASA ADS] [CrossRef] [Google Scholar]
- Vestergaard, M., & Peterson, B. M. 2006, ApJ, 641, 689 [Google Scholar]
- Viswanath, G., Stalin, C. S., Rakshit, S., et al. 2019, ApJ, 881, L24 [NASA ADS] [CrossRef] [Google Scholar]
- Waddell, S. G. H., Gallo, L. C., Gonzalez, A. G., Tripathi, S., & Zoghbi, A. 2019, MNRAS, 489, 5398 [CrossRef] [Google Scholar]
- Williams, J. K., Gliozzi, M., & Rudzinsky, R. V. 2018, MNRAS, 480, 96 [CrossRef] [Google Scholar]
Appendix A: Analysis results for the average spectra
In the main text, we focussed on the flux-resolved spectra in an attempt to explore the nature of the short timescale X-ray variability of the source during a single observation. The analysis for the average spectra without distinguishing the flux state could obtain the model parameters in the average state and provide a better parameter constraint. Therefore, we also analysed the average spectra and give a brief report here. The fitting results of the two best physical models used in the main text (TBabs*gabs*relxillD and TBabs*gabs*redden*optxagnf models) to the average spectra are presented in Table A.1 for comparison and reference. The fitting results of the average spectra agree with those of the flux-resolved spectra (i.e. the results in Tables 3 and 4) except for normalization parameters, which further confirmed that the short timescale X-ray variability of PG 1448 + 273 is mainly caused by the intrinsic flux variation of the corona.
Fitting results of the TBabs*gabs*relxillD and TBabs*gabs*redden*optxagnf models for the average spectra of PG 1448+273.
All Tables
Fitting results of the relativistically smeared reflection models for the spectra of PG 1448+273.
Fitting results of the warm corona model with free black hole mass for the spectra of PG 1448+273.
Fitting results of the TBabs*gabs*relxillD and TBabs*gabs*redden*optxagnf models for the average spectra of PG 1448+273.
All Figures
|
Fig. 1. Light curves of PG 1447+273. Top panel: light curve of PG 1447+273 in the X-ray band (0.2–10 keV). Middle panel: X-ray hardness ratio over time. Bottom panel: light curves of PG 1447 + 273 in the optical/ultraviolet band. The time and ID of the observation are denoted in the top panel. The red lines in the top panel represent the average X-ray fluxes during the corresponding observation period. According to the respective average X-ray fluxes, as shown in the figure, the single observation is further divided into high and low states. |
| In the text | |
|
Fig. 2. Fractional variability (Fvar) spectra in 2003 (left panel) and 2017 (right panel). |
| In the text | |
|
Fig. 3. Centroid lag (τcentroid) distributions calculated by DCF for the 2000 subsets obtained by FR/RSS processing in 2003 (left panel) and 2017 (right panel), respectively. The red solid line represents the median of the distribution, and the red dotted lines indicate the 16th and 84th percentiles of the distribution, respectively. |
| In the text | |
|
Fig. 4. DCF between the X-ray emission and the emission in the UVW2 band. The lines show the significance levels of correlation obtained by the MC simulations. |
| In the text | |
|
Fig. 5. PSDs of light curves in 2003 (right panel) and 2017 (right panel). The red solid lines indicate the fitting results of the power law, and the corresponding spectral indexes α are denoted in the panel. The pink horizontal lines represent the power level of the noise floor. There is an obvious dip (oscillation) feature at the ν ∼ 10−3.6 Hz of the PSD in 2003, and the red dotted line indicates the fitting result after adding a Gaussian component to be responsible for the dip feature. |
| In the text | |
|
Fig. 6. Fitting results of the phenomenological models for the spectra of PG 1448+273. Left panel: the fitting results and data/model ratio plots of a Galactic absorption modified power-law model. The spectral index of the model is tied between all the spectra to examine the spectral variability, and the fitted models are extrapolated to the 0.2–2 keV and 6–10 keV to examine the spectral features. Right panel: the fitting results and data/model ratio plots of the TBabs * gabs* ((cflux*zpower) plus const*(cflux*zbbody)) model. The observation ID and status corresponding to different colour data are denoted in the top panel, and the model used for fitting is also indicated in each panel. |
| In the text | |
|
Fig. 7. Data vs. model ratio plots obtained by the X-ray spectral fittings of PG 1448+273 with three different relativistically smeared reflection models. The observation ID and status corresponding to different colour data are indicated in the top panel, and the model used for fitting is also denoted in each panel. |
| In the text | |
|
Fig. 8. X-ray spectra of PG 1448+273 with the optical/UV data from the OM. Left panel: the lines of different colour represent the best-fitting warm corona models obtained by fitting the corresponding colour X-ray data under the condition of a = 0 and MBH = 9 × 10⁶ M⊙. These best-fitting models are extrapolated to the optical/UV band to compare the observed optical/UV data, and the observed optical/UV fluxes significantly exceed the extrapolated value of the models. Right panel: the lines of different colours represent the best-fitting warm coronal model obtained by simultaneously fitting the corresponding colour X-ray and optical/UV data under the condition of a = 0 and a free black hole mass. |
| In the text | |
|
Fig. 9. Simple schematic diagram explaining the X-ray spectral variability of PG 1448+273 in the framework of the relativistically smeared reflection scenario. A detailed description is presented in Sect. 5.2. |
| In the text | |
Current usage metrics show cumulative count of Article Views (full-text article views including HTML views, PDF and ePub downloads, according to the available data) and Abstracts Views on Vision4Press platform.
Data correspond to usage on the plateform after 2015. The current usage metrics is available 48-96 hours after online publication and is updated daily on week days.
Initial download of the metrics may take a while.