Fig. 3.
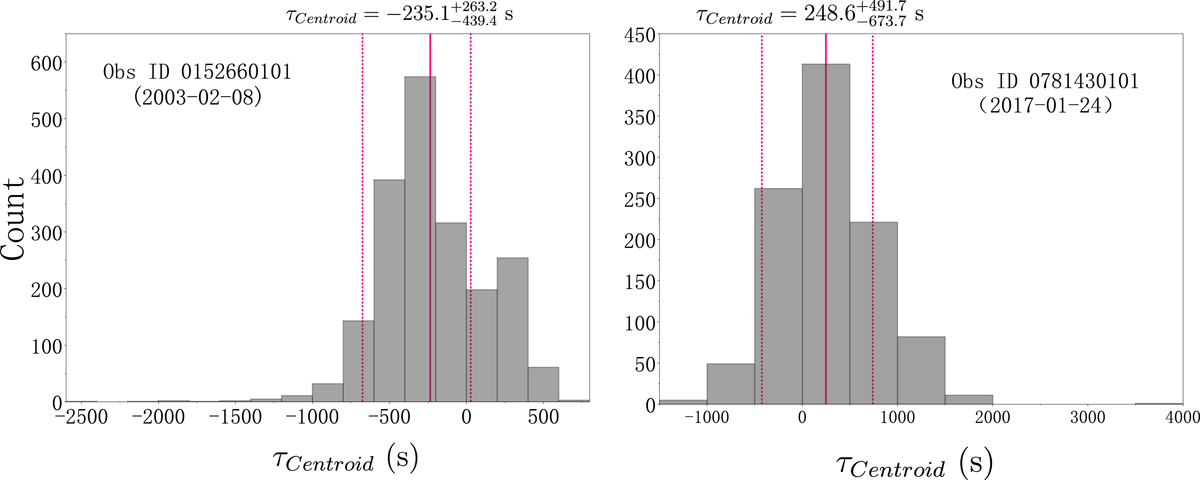
Centroid lag (τcentroid) distributions calculated by DCF for the 2000 subsets obtained by FR/RSS processing in 2003 (left panel) and 2017 (right panel), respectively. The red solid line represents the median of the distribution, and the red dotted lines indicate the 16th and 84th percentiles of the distribution, respectively.
Current usage metrics show cumulative count of Article Views (full-text article views including HTML views, PDF and ePub downloads, according to the available data) and Abstracts Views on Vision4Press platform.
Data correspond to usage on the plateform after 2015. The current usage metrics is available 48-96 hours after online publication and is updated daily on week days.
Initial download of the metrics may take a while.